Meta Platforms (META) Shares DeclineMeta Platforms (META) Shares Decline
Shares of the US tech giant Meta Platforms (META) hit a record high last week, climbing above $780 following the release of a strong earnings report:
→ Earnings per share (EPS) came in at $7.14, significantly exceeding the forecast of $5.88.
→ The company also outperformed expectations on key metrics related to advertising growth.
→ Additionally, the media has highlighted the growing importance of AI technology to Meta’s business.
However, shortly after reaching an all-time high, META shares began to show bearish momentum.
Technical Analysis of the META Chart
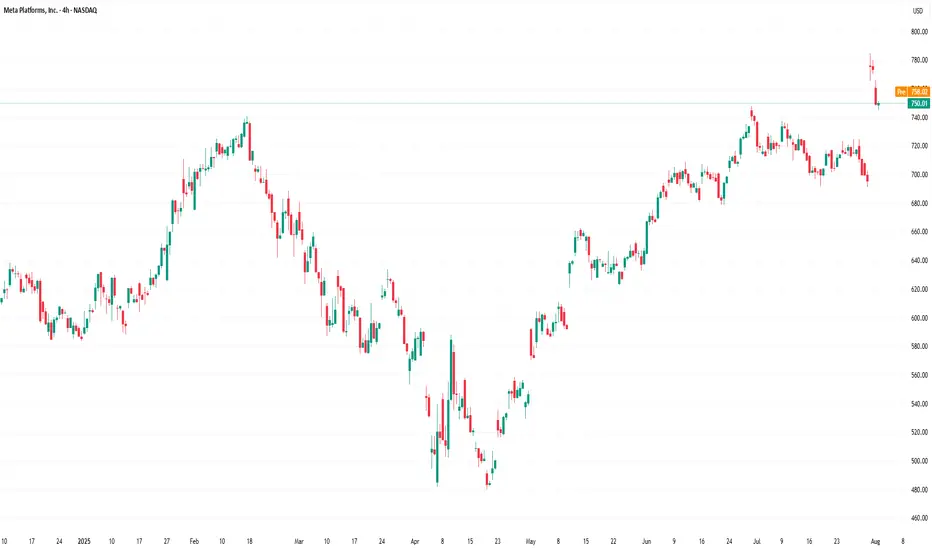
On the four-hour chart, the following signals are visible:
→ A bearish engulfing pattern formed on Thursday;
→ A bearish gap appeared at Friday’s market open, followed by a continuation of the downward move.
This represents a notable pullback from the historical peak — potentially indicating that the initial bullish reaction to the earnings report has faded. The share price decline suggests a correction from overbought territory, as confirmed by the RSI indicator.
The $740 level appears to be a key support zone — previously acting as major resistance before the breakout. Bulls could also find support from the median line and the lower boundary of the ascending channel that has been developing since mid-May.
Given this context, a scenario in which bulls attempt to resume the uptrend within the ascending channel cannot be ruled out, especially considering the company’s strong fundamentals and the presence of multiple technical support levels.
This article represents the opinion of the Companies operating under the FXOpen brand only. It is not to be construed as an offer, solicitation, or recommendation with respect to products and services provided by the Companies operating under the FXOpen brand, nor is it to be considered financial advice.
Metaplatforms
Is this possible with METAIs this possible with META?
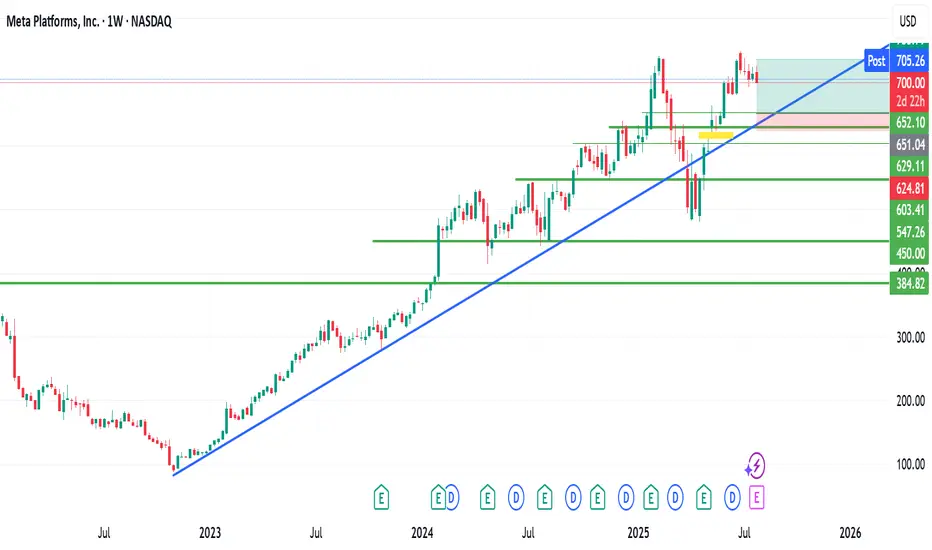
META stock is currently trading at $700.
My technical view as shown on the chart, is looking at a possible retracement to around $650.
The question is ''Is this possible?
If it ever gets to this forecasted zone, I will accumulate massively.
Meta - The breakout in question?🪓Meta ( NASDAQ:META ) is retesting major structure:
🔎Analysis summary:
After Meta perfectly retested a major previous support trendline in 2022, the trend shifted bullish. We have been witnessing an incredible rally of about +700% with a current retest of the previous all time highs. Time will tell but a bullish breakout remains quite likely.
📝Levels to watch:
$750
🙏🏻#LONGTERMVISION
Philip - Swing Trader

Wall Street takes off: 5 secret growth engines for #S&P500 Record closes for the indices on July 21 came from a powerful combo: a surge in #Google , a strong start to the earnings season, gains in #Apple (+0.6%), #Amazon (+1.4%), plus #Microsoft, #Meta Platforms, and #Nvidia . This momentum, coupled with market bets on imminent Fed rate cuts and hopes for a softening US-EU tariff conflict, pushed #S&P500 and #NQ100 to new all-time highs.
5 mega drivers that could keep #S&P500 and #NQ100 on the runway through 2025:
• AI capex and monetization: Top cloud providers are ramping up spending in computing clusters and generative AI solutions. The growing lineup of paid AI products (Google Gemini, Microsoft Copilot+ Apps, Amazon Bedrock) is starting to generate significant revenue, boosting profit estimates for the “Magnificent 7.”
• Fed policy easing: If inflation keeps drifting towards 2%, we may see the first rate cut of the cycle between July and September. Historically, every 25 bps drop in 10-year UST yields adds ~2% to the #NQ100 ’s valuation multiple.
• Record buybacks and dividends: #S&P500 companies hold $3.5 trillion in cash. After tax relief on repatriated foreign earnings earlier this year, several megacap boards approved accelerated buybacks — mechanically supporting stock prices.
• Easing tariff risks: Potential trade deals between the US and EU, and the US and Mexico, would remove the threat of 20–50% tariffs priced into valuations, unlocking CAPEX in manufacturing and semiconductors — sectors with a heavy #NQ100 weight.
• Resilient consumers and services: Unemployment remains near 4%, and household spending is growing 2–3% YoY. This supports e-commerce, streaming, and platform advertising — together making up ~40% of #NQ100 and ~28% of #S&P500 .
The current highs of #S&P500 and #NQ100 aren’t a random spike — they result from strong corporate earnings, expectations of Fed cuts, and hopes of trade détente. If even some of these five drivers materialize, the indices have a strong chance to stay elevated and set new records by year-end. FreshForex analysts believe current prices could spark a new rally, with today’s market conditions offering plenty of entry points in both indices and stock CFDs.

META Platforms Long Setup – Ready for the Next Move?💣 META Masterplan: Bullish Break-In Activated! 💼📈
🌟Hi! Hola! Ola! Bonjour! Hallo!🌟
Dear Money Makers & Silent Strategists, 🤑💰💸✈️
We’ve locked in on our next high-value digital vault: META Platforms Inc.
Built on our signature Thief Trading Style™ — where fundamentals meet stealth technical precision — this is your map to the bullish jackpot.
📍 ENTRY PLAN – Door’s Unlocked!
✅ Enter at any level — this heist is already in motion.
OR
🎯 Set your Buy Limit on a 15m/30m swing low or high — classic pullback infiltration.
🛑 STOP LOSS – Your Exit Route
Before breakout? Hold the line.
After breakout? Drop your SL at the recent 4H swing low – and size it to your risk appetite.
This isn’t luck — it’s calculated theft. 🔐
🎯 TARGET ZONE – Grab & Vanish
🎯 Aim: 770.00
But if the cops (aka sellers) show up early, get out with your loot — no shame in a clean getaway.
“Profit is the win. Perfection is fantasy.”
⚡ SCALPERS' TIPS – Quick In & Out
💵 Big wallet? Enter now.
💳 Tight budget? Follow the swing team.
Either way — longs only, and trailing SL is your safety rope.
📊 WHY META? – Intel Behind the Mission
🔍 This plan is reinforced by:
🔥 Strong Fundamentals
📈 Sentiment Signals
🧠 Quantitative + Macro Flow
💼 COT Data
🌐 Intermarket Correlations
It’s all aligning — the pressure’s building, and the breakout door is creaking open...
🚨 TRADING ALERT – Stay Outta Trouble
💥 Avoid placing new trades during major news drops.
🎯 Use trailing SL to protect and lock profits — your getaway vehicle must be ready.
💖 Support the Heist? Smash Boost!
Fuel the mission — every Boost empowers the crew.
This is Thief Trading Style — we don’t chase, we plan, strike, and vanish with the win. 🏆💪🐱👤
📡 Another breakout mission incoming. Stay hidden. Stay profitable. 🤑🚀

Meta Platforms - This stock tastes sooo good!Meta Platforms - NASDAQ:META - will print a new all time high:
(click chart above to see the in depth analysis👆🏻)
Over the course of the past two months, Meta has been rallying +40%. This recent behaviour was not unexpected at all but rather the consequence of the all time high break and retest. Now - back at the previous all time high - Meta will most likely break out higher again.
Levels to watch: $700, $900
Keep your long term vision!
Philip (BasicTrading)

Meta Platforms - The rally is clearly not over!Meta Platforms - NASDAQ:META - can rally another +30%:
(click chart above to see the in depth analysis👆🏻)
Some people might say that it seem counterintuitive to predict another +30% rally on Meta Platforms while the stock has been rallying already about +750% over the past couple of months. But price action and market structure both tell us, that this will soon turn into reality.
Levels to watch: $850
Keep your long term vision!
Philip (BasicTrading)

META: Close to a 1D Golden Cross. Strong buy.META is almost overbought on its 1D technical outlook (RSI = 69.797, MACD = 30.360, ADX = 40.237) but is about to form a 1D Golden Cross, the first such pattern since March 1st 2023, which was a little after the November 2022 market bottom. The market technically thrives on such conditions and since 2019, the 3 Golden Cross patterns that were formed were bullish continuation formations. Based on the 1W RSI, the current Golden Cross might be more similar with the June 2nd 2020 Golden Cross that was formed after the COVID crash. It rose by +123.42% before pulling back to the 1D MA200 again, so we remain bullish on META with TP = 1,000.
## If you like our free content follow our profile to get more daily ideas. ##
## Comments and likes are greatly appreciated. ##

Will META fill the gap before push upWill META fill the gap before push up.
My thoughts are displayed on the chart, and are technical.
While I already have a buy for the stock, I am open to another entry if this asset pulls back to fill the gap highlighted in the yellow block.
Entry, SL and TPs are all highlighted.
If you find this helpful, kindly follow me, like and comment.
As usual, trade with care

META Formed 1st 4H Golden Cross since Jan 2023!Meta Platforms (META) just completed yesterday its first 4H Golden in almost 2.5 years (since January 24 2023), flashing the strongest bullish signal it could at the moment!
Practically that Golden Cross was formed directly after the November 2022 bottom of the Inflation Crisis. The 4H RSI patterns between the two time periods are identical, so it is highly likely to see the market repeat that price action.
That suggests that the immediate Target on what seems to be an Inverse Head and Shoulders pattern is the 1.1 Fibonacci extension at $770.00, as META did on February 03 2023.
On the long-term and assuming a favorable macro environment (Trade Deals, Rate Cuts) it could reach the 1.786 Fibonacci extension a little over $1000, before the next major market correction.
-------------------------------------------------------------------------------
** Please LIKE 👍, FOLLOW ✅, SHARE 🙌 and COMMENT ✍ if you enjoy this idea! Also share your ideas and charts in the comments section below! This is best way to keep it relevant, support us, keep the content here free and allow the idea to reach as many people as possible. **
-------------------------------------------------------------------------------
💸💸💸💸💸💸
👇 👇 👇 👇 👇 👇

Meta Platforms (META) Shares Surge Over 3% in a DayMeta Platforms (META) Shares Surge Over 3% in a Day
Shares of American tech giant Meta Platforms (META) rose approximately 3.6% yesterday, continuing their upward trend after gaining about 18% in May.
Why Is META Stock Rising?
Reports emerged yesterday that the company plans to fully automate the ad creation process using artificial intelligence.
According to the Wall Street Journal, Meta Platforms (META) is developing a system that will allow ads to be fully created and targeted using artificial intelligence tools by the end of next year.
How Could AI-Based Social Media Advertising Work?
A brand provides a product image and budget, and Meta’s AI then:
→ generates ads that include images, videos, and text;
→ identifies the target audience across Instagram and Facebook (with a combined audience of over 3 billion users);
→ enables advertisers to personalise ads so that users see different versions of the same ad in real-time, based on factors like geolocation.
Technical Analysis of META Chart
From a bearish perspective:
→ the price has reached a line that previously acted as support but has now shown signs of becoming resistance (as indicated by arrows);
→ the round $700 level is seen as a psychological barrier, which the price failed to break above in February.
From a bullish perspective, a key support zone lies between the psychological level of $600 and the upper boundary of the bullish gap from 12th May around $622.
It’s worth noting that META's stock rally is underpinned by strong fundamentals:
→ the latest earnings report exceeded analysts’ expectations;
→ optimistic revenue forecasts through the end of the year;
→ hopes that trade wars will have minimal impact on social media platforms.
Therefore, it’s reasonable to assume that buyers may retain control and push towards new all-time highs above $700.
This article represents the opinion of the Companies operating under the FXOpen brand only. It is not to be construed as an offer, solicitation, or recommendation with respect to products and services provided by the Companies operating under the FXOpen brand, nor is it to be considered financial advice.

Meta - The Correction Is Officially Over!Meta ( NASDAQ:META ) is retesting the previous all time high:
Click chart above to see the detailed analysis👆🏻
For more than 7 years, Meta has been perfectly trading in a reverse triangle formation. And just three months ago, Meta once again retested the upper resistance trendline and reversed towards the downside. But with the retest of the previous all time high, this correction is over.
Levels to watch: $500, $800
Keep your long term vision,
Philip (BasicTrading)

Meta: Is the Plunge Inevitable?Despite its vast reach and market presence, Meta Platforms faces significant and compounding challenges that suggest a potentially turbulent future. While appearing dominant, the company is increasingly vulnerable to external pressures stemming from legal, regulatory, and competitive fronts. These growing headwinds threaten to erode its financial stability and alter its fundamental business model.
A critical area of concern involves the human cost of content moderation. Meta faces multiple lawsuits in Africa, alleging severe psychological harm to moderators exposed to disturbing content. These legal actions, particularly in Ghana and Kenya, argue that Meta bears responsibility for the well-being of these outsourced workers, citing inadequate support and exploitative conditions. A loss in these cases could set costly precedents, forcing Meta to significantly invest in or restructure its global content moderation operations and potentially face substantial liabilities.
Simultaneously, Meta confronts escalating regulatory action, particularly in Europe. Recent significant fines from the EU under the Digital Markets Act highlight regulatory intent to control how tech giants handle user data and maintain market dominance. These penalties, including a substantial fine over its "consent or pay" model and a previous one for unfair trading practices, signal a global trend towards stricter oversight that could constrain Meta's core advertising business model. Adding to this pressure is the ongoing US FTC antitrust trial, which seeks to unwind Meta's key acquisitions of Instagram and WhatsApp, citing anti-competitive practices. The potential forced divestiture of these highly lucrative platforms represents an existential threat, as Instagram alone accounts for a significant portion of Meta's advertising revenue.
These intertwined legal and regulatory battles, combined with intense competition in the digital landscape and the uncertain return on large investments like the Metaverse, create a challenging outlook for Meta. The cumulative effect of these pressures could significantly impact the company's profitability, market share, and public perception. Navigating this complex environment requires Meta to address these fundamental issues effectively, or face the increasing likelihood of a substantial downturn.

Meta Platforms (NASDAQ: META) Receives Analyst UpgradeMeta Platforms (NASDAQ: META) is set to report first-quarter 2025 results on April 30. Ahead of the release, the stock is trading at $532.16, down over 18% year-to-date. Concerns about a pullback in ad spending and rising AI infrastructure costs had weighed heavily on investor sentiment. However, robust engagement trends and a notably cheaper 16x EV/EBIT valuation have prompted a shift in outlook. The stock has been upgraded from Sell to Hold.
Despite macroeconomic challenges and regulatory fines from the EU, analysts maintain a positive long-term view. Benchmark’s Mark Zgutowicz cut his price target to $640 from $820 but reaffirmed a Buy rating. He highlighted Meta’s long-term strength in U.S. digital ad markets and its disciplined capital allocation.
Similarly, Stifel’s Mark Kelley reduced his target to $628, citing cautiousness in the e-commerce and subscriptions space. He acknowledged market discomfort reminiscent of the COVID-19 era.
Meanwhile, Monness’s Brian White maintained a Buy rating with a $775 target, projecting Q1 revenue of $41.73 billion and earnings of $5.54 per share. Analysts, on average, expect EPS of $5.24 and revenue of $41.3 billion, suggesting double-digit growth. The stock holds a Strong Buy consensus from Wall Street. Out of 46 analysts, 42 rate it Buy, three Hold, and one Sell. The average price target of $705 implies a potential 35.5% upside from current levels.
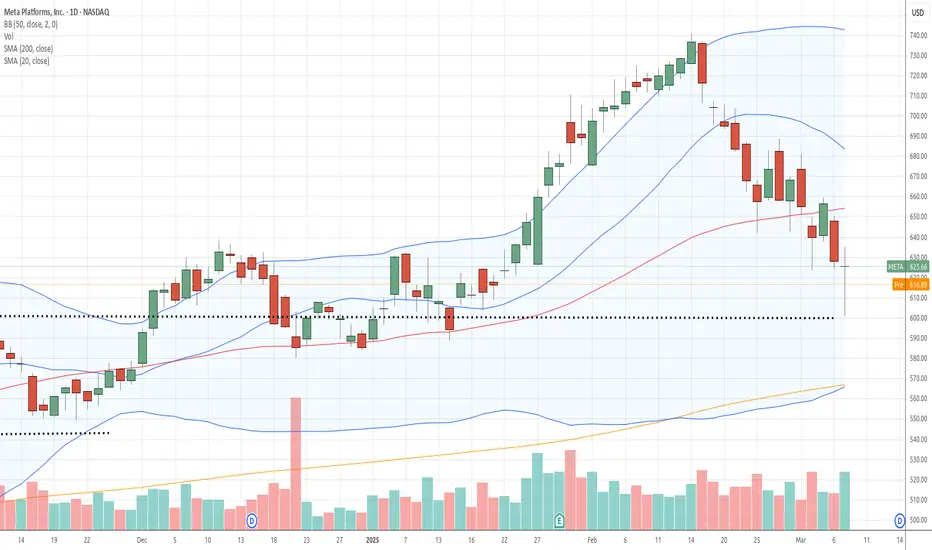
Technical Analysis
META has rebounded sharply off a key ascending trendline support that dates back to April 2024. The recent recovery from around $475 coincided with the ascending trendline. The price has been bullish overall, as seen from the 200-day moving average at $408.64.
Price is now about to reclaim both the 100-day ($549.11) and 50-day ($601.58) moving averages. The chart indicates a possible near-term pullback followed by a push toward the $740.91 high. Volume is currently at 44.25 million shares, suggesting rising interest.

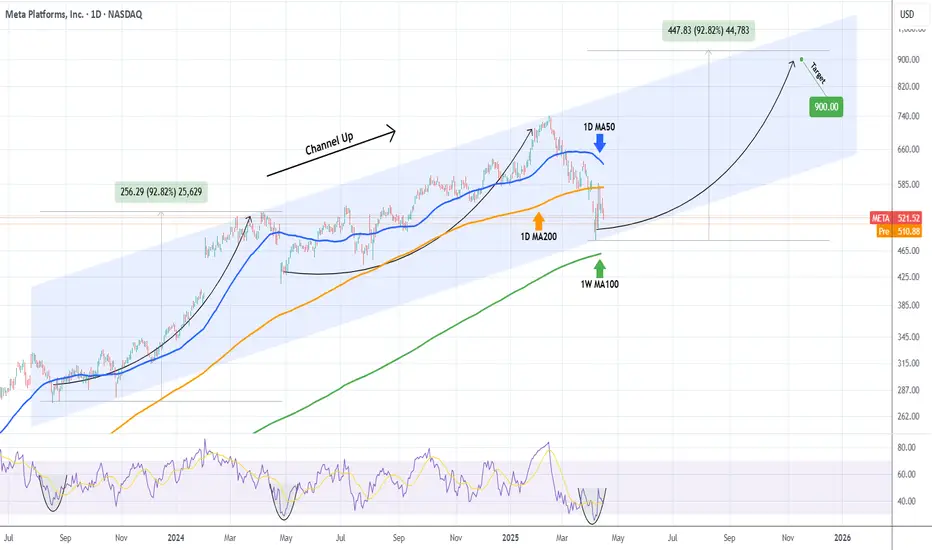
META Slow recovery but $900 possible this yearMeta Platforms (META) had a strong -35% correction in the past two months, dipping even below its 1D MA200 (orange trend-line). By doing so, it reached the bottom (Higher Lows trend-line) of the 2-year Channel Up and rebounded instantly.
The rebound has stopped so far on the 1D MA200 where it got rejected. This keeps the market neutral and the long-term bullish sentiment can only be resumed if the market breaks and closes above its 1D MA50 (blue trend-line). Until then we are neutral but only as long as the 1W MA100 (green trend-line) holds, below it the bearish trend is resumed and the correction can potentially reach -50% to -70%.
If however we close above the 1D MA50, expect a +90% rally, similar to the first Bullish Leg of the Channel Up, slow at start but aggressive after half point. Target $900.
-------------------------------------------------------------------------------
** Please LIKE 👍, FOLLOW ✅, SHARE 🙌 and COMMENT ✍ if you enjoy this idea! Also share your ideas and charts in the comments section below! This is best way to keep it relevant, support us, keep the content here free and allow the idea to reach as many people as possible. **
-------------------------------------------------------------------------------
💸💸💸💸💸💸
👇 👇 👇 👇 👇 👇
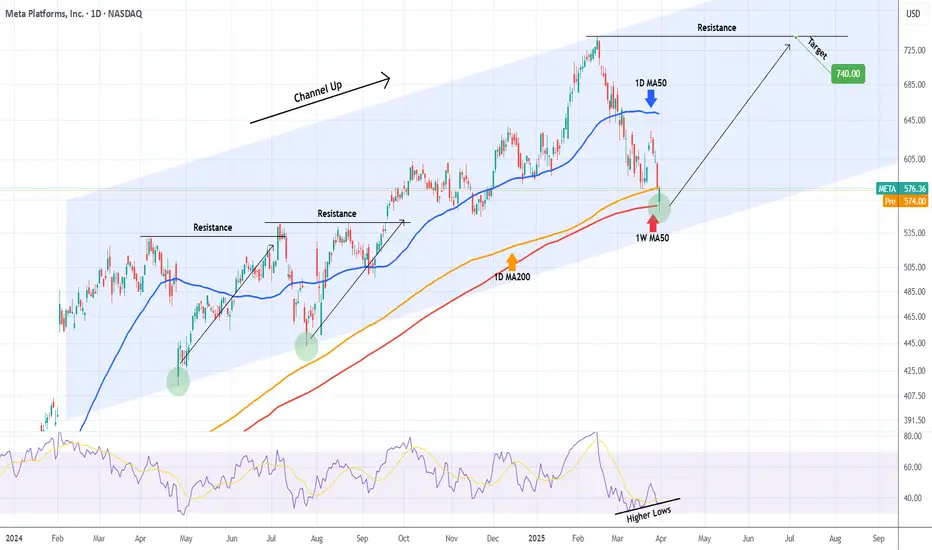
META Can it hold its 1W MA50?Meta Platforms (META) has been trading within a 1-year Channel Up and yesterday it hit its 1W MA50 (red trend-line), breaching the 1D MA200 (orange trend-line) which held the correction last week.
Even though the bottom of the Channel Up is currently $40 lower, holding he 1W MA50 is critical because it has been kept intact since the February 02 2023 bullish break-out.
The first signs are encouraging as the 1D RSI is on Higher Lows, despite the stock's Lower Lows, which is a Bullish Divergence. So as long as this Channel Up bottom Zone holds, we expect META to initiate its new Bullish Leg and test initially its previous Resistance (ATH) as it did on July 05 2024 and August 22 2024. Our Target is $740.
-------------------------------------------------------------------------------
** Please LIKE 👍, FOLLOW ✅, SHARE 🙌 and COMMENT ✍ if you enjoy this idea! Also share your ideas and charts in the comments section below! This is best way to keep it relevant, support us, keep the content here free and allow the idea to reach as many people as possible. **
-------------------------------------------------------------------------------
💸💸💸💸💸💸
👇 👇 👇 👇 👇 👇
Meta Stock Goes 'Untoward', Fall Off The Cliff 200-Day SMAMeta's Descent into Bearish Territory. Understanding the 2025 Stock Crash
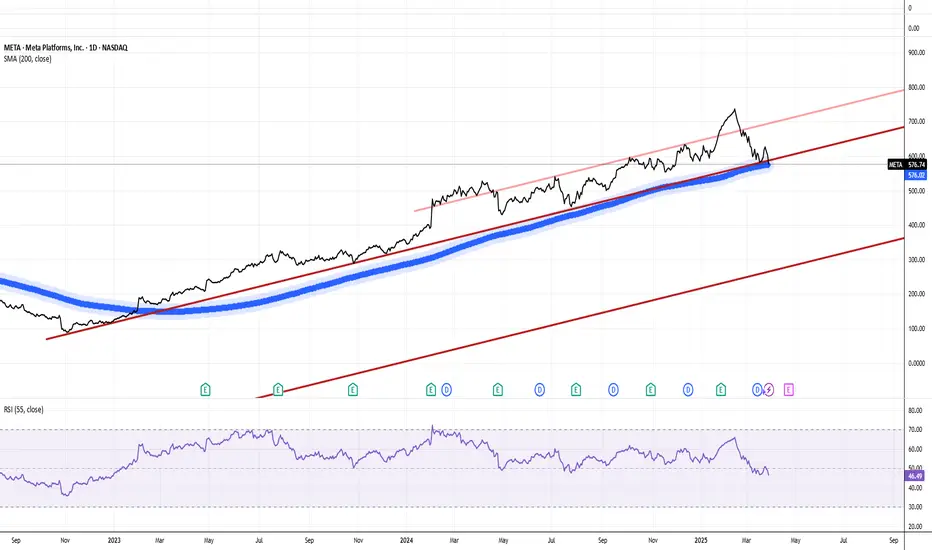
Meta Platforms has recently slipped into bearish territory, with its stock experiencing a significant downturn in early 2025. As of March 31, 2025, Meta shares trade at $576.74, reflecting more than 20.0% decline over the past month and erasing all year-to-date gains. This analysis examines the key factors driving Meta's bearish turn and what it means for investors.
Disappointing Financial Outlook and Investment Costs
Meta's stock decline comes despite previously strong performance, with the company's shares shedding 22% from their February 18, 2025 peak. Although Meta reported robust Q4 2024 profits, its outlook for Q1 2025 has significantly disappointed investors. The company's forward-looking EPS for Q1 2025 is projected at $5.25, raising sustainability concerns despite the previous quarter's EPS of $8.02 beating estimates.
A major contributor to investor anxiety is Meta's massive capital expenditure plans. The company has projected spending $60-$65 billion in 2025 on AI infrastructure alone, raising concerns about cash flow strain if revenue growth falters. These high fixed costs associated with AI investments, including data centers and engineering talent, create particular vulnerability during economic downturns.
Metaverse Losses Continue to Drain Resources
The company's Reality Labs division, responsible for virtual and augmented reality initiatives, continues to be a significant financial drag. This division lost $13.7 billion in 2022 alone with no clear path to profitability. Despite CEO Mark Zuckerberg's continued commitment to the metaverse vision, investor sentiment has soured on these costly experiments as they continue to consume capital without generating meaningful returns.
Broader Market Pressures and Industry Positioning
Meta's decline isn't occurring in isolation. It represents the last of the "Magnificent Seven" tech stocks to turn negative for the year, with the Bloomberg Magnificent 7 Total Return Index down 16% in 2025. The Nasdaq Composite has faced significant correction, declining 7.3% year-to-date and over 12% from its peak.
This market-wide pressure stems from persistent inflation concerns, Federal Reserve interest rate policies, and growing recession fears, creating a particularly challenging environment for growth-oriented technology stocks like Meta.
Influential Market Moves and Analyst Adjustments
Notable market participants have signaled caution regarding Meta's prospects. Cathie Wood's ARK Invest sold over $7 million in Meta stock (12,000 shares) on March 18, 2025—its first Meta sell-off in nearly a year. This high-profile divestment has further fueled bearish sentiment among investors.
Similarly, analysts have begun adjusting their outlook. KeyBanc Capital Markets recently downgraded its price target on Meta from $750 to $710, citing "greater macro uncertainty" and competitive pressures. This downgrade reflects growing concerns about Meta's ability to maintain growth momentum in the current economic climate.
External Challenges Mounting
Meta faces increasing competitive threats from platforms like TikTok and Snapchat, which continue to draw user attention and advertising dollars. Additionally, regulatory headwinds loom large, with an upcoming FTC trial on April 14, 2025, potentially forcing Meta to divest Instagram and WhatsApp—a prospect that has further spooked investors.
In conclusion, Meta stock now stands at a critical juncture, with investors carefully watching whether this represents a temporary correction or the beginning of a more prolonged bearish phase.
--
Best wishes,
Your Beloved @PandorraResearch Team 😎
Meta Platforms (META): A Leading Force in AIKey Supporting Arguments
Deploying AI tools enhances user engagement, drives up ad revenue, and strengthens Meta’s profit margins.
Meta's in-house development of AI chips is poised to lower capital outlays associated with purchasing Nvidia chips and diminish the costs involved in developing proprietary AI models.
Meta's stock has approached a support level, suggesting a potential reversal in its price trajectory.
Investment Thesis
Meta Platforms (META) stands as one of the world’s largest technology companies, specializing in social media, digital advertising, and AI development. It owns major platforms like Facebook, Instagram, WhatsApp, and Messenger, which together engage over 3.3 billion users daily. While advertising remains its primary revenue stream, the company is strategically investing in emerging areas such as generative AI and augmented reality.
Continued Commitment to AI Development as a Key Growth Driver. Meta is strategically channeling investments into AI, spearheading the development of open-source Llama models and deploying generative content across its social platforms. These advancements are anticipated to enhance targeting precision and bolster user engagement, subsequently driving a surge in advertising revenue. In 2025, the company intends to allocate up to $65 billion toward AI infrastructure, reinforcing its leadership stature in the competitive AI market.
Focus on Proprietary AI Chips to Lower Capital Costs and Enhance AI Model Development. Meta has initiated trials of its proprietary AI training chip, marking a significant move toward minimizing reliance on suppliers like Nvidia. This new chip is tailored for specific AI tasks, offering enhanced energy efficiency over conventional graphics processing units. By developing its own chips, the company stands to lower expenses and potentially capitalize on the burgeoning demand for AI processing by selling surplus capacity.
Stock May See a Rebound from Current Levels. Following the market correction triggered by concerns over a deteriorating macroeconomic landscape in the United States, the company's share price is stabilizing around the $600 mark. We anticipate that this threshold may establish itself as a significant support level, potentially serving as a springboard for the shares to rebound and continue their upward trajectory. Furthermore, the relatively modest forward P/E ratios, approximately 21-23x, underscore the oversold condition of Meta shares and suggest a possible reversal.
Our price target for META over a 2-month horizon is $685, accompanied by a "Buy" recommendation. We advise setting a stop-loss at $530.

Meta: Further DownwardWe locate the META in a broader wave IV correction, which should unfold in a three-part - - structure. The current wave should push the price below the key support at $547.57. Once that level is broken, we anticipate a corrective rebound during wave , which should temporarily lift the price back above $547.57. The wave top should be followed by wave , which is expected to complete the overall correction with a final low inside the beige Target Zone between $491.53 and $414.50. This bottom should mark the end of wave IV. However, if the stock instead breaks out to the upside and overcomes the resistance at $740.91, we will have to expect a new high in wave alt.III before wave IV resumes its downward course (30% probability).

META is coming back to life!NASDAQ:META
As we discussed before a breakdown out of this Bullish Trend since 2022 would be very bearish and take META to the $400's.
Well, they said, hold my beer, and bounced hard exactly at the bottom of the channel and Anchored VWAP.
It's not over yet, as we need to follow through next week with a nice engulfing candle to make people into believers!
Not financial advice.

META to the $400s?! I hope so!!!NASDAQ:META
Is the show over or will the show go on?
At the bottom of the Bullish Channel that started in October 2022.
A breakdown of this channel could lead NASDAQ:META back to a stock price in the 400's...
A Breakdown retest of the lower Anchored VWAP band could be a false breakdown and bounce area as well. If we break through that though then this name is going to the $400's area.
Not financial advice

$META Tradespoon - Long Entry $618.57Tradespoon model generated long signal for Meta Platforms NASDAQ:META . Predicted range: $618.57–$644.03. Trend: -1.32%. NASDAQ:META
Meta - The Breakout Is About To Be Confirmed!Meta ( NASDAQ:META ) is attempting the breakout:
Click chart above to see the detailed analysis👆🏻
Over the past couple of months, we have been witnessing an incredible rally of about +750% on Meta. Looking at the long term reverse triangle pattern, this rally was not unexpected and such is the breakout. We still need to see confirmation, but then Meta will target the four digit level.
Levels to watch: $700, $1.000
Keep your long term vision,
Philip (BasicTrading)
