Meta stock plunge 14% in Premarket RoutThe tech world was rocked as Meta Platforms Inc. (NASDAQ: NASDAQ:META ) saw its shares nosedive by as much as 15% in premarket trading, sending shockwaves through US futures markets. The precipitous drop came from lackluster revenue guidance and concerns over CEO Mark Zuckerberg's ambitious AI spending plans.
Investors expressed skepticism over Zuckerberg's vision to pour tens of billions into artificial intelligence initiatives, fearing it would drive up costs and erode profitability. Meta's first-quarter earnings report, while boasting profits of $4.71 per share and revenue of $36.5 billion—beating analyst expectations—failed to assuage concerns as the company provided subdued revenue guidance for the upcoming quarter.
Meta's revenue forecast of $36.5 billion to $39 billion fell short of analysts' projections, dimming the optimism that had propelled the company's stock to record highs. Zuckerberg's announcement during the post-earnings conference call about ramping up AI investment further rattled investors, leading to a mass sell-off.
The market reaction was swift and brutal, with Meta's stock plunging to just over $426, marking a potential $160 billion loss in market value if sustained until the opening bell. This abrupt downturn punctuates Meta's remarkable stock performance over the past year, with shares soaring 107% in the last 12 months and 42% year-to-date, until the recent setback.
Russ Mould, investment director at AJ Bell, highlighted investor concerns about Zuckerberg's perceived lack of financial discipline and the sudden pivot from cost-saving measures to aggressive AI spending. The reversal of sentiment underscores the fragility of investor confidence in Meta's management strategy, dampening the company's recent efforts to project financial prudence.
The fallout from Meta's downturn rippled across broader indexes, with S&P 500 futures and Nasdaq 100 futures tumbling, signaling a turbulent trading day ahead. As investors brace for further earnings announcements from tech giants like Microsoft and Alphabet, coupled with the release of US GDP estimates, the uncertainty surrounding Meta's future trajectory casts a shadow over the broader tech sector.
In conclusion, Meta's sharp decline serves as a cautionary tale of the perils of investor sentiment and the delicate balance between innovation and financial stewardship in the tech industry. As the dust settles, all eyes will be on Meta's next moves and its ability to regain investor trust amidst heightened scrutiny and market volatility.
Metaplatforms

META Platforms Options Ahead of EarningsIf you haven`t sold META when ARK did that:
nor bought the META before the previous earnings:
Then analyzing the options chain and the chart patterns of META Platforms prior to the earnings report this week,
I would consider purchasing the 480usd strike price Calls with
an expiration date of 2024-5-3,
for a premium of approximately $24.80.
If these options prove to be profitable prior to the earnings release, I would sell at least half of them.

TESLA lays off more than 10% staff. Is this its 'META moment'?It was reported this morning that Tesla (TSLA) "will lay off more than 10% of its global workforce, an internal memo seen by Reuters on Monday shows, as it grapples with falling sales and an intensifying price war for electric vehicles".
The market has so far reacted with strong selling of more than -3% in early trading. But is this really bad news?
Not so long ago (November 09 2022), another high tech giant that was heavily decimated at the time, Meta Platforms (META), announced lay offs of around 13% of the company (more than 11000 employees). This was just 5 days after the November 04 2022 market bottom. The result (chart on the right) was an aggressive recovery above the 1D MA50 (blue trend-line), which turned into a Support for 240 days straight.
Of course the fundamental difference is that the 2022 Low for Meta was the Bear Cycle bottom of the Inflation Crisis while Tesla's Channel Down has been the picture of its underperformance for almost a year relative to the rest of the market (and the Magnificent 7 in particular).
However it shouldn't be overlooked that such cost driven news are fundamentals capable of turning the profitability of a company around and Meta's case is such a representative example. Meta was massively oversold in November 2022 (-75% from ATH) and similarly Tesla is massively oversold now (-60% from ATH). Meta managed to completely recover and smash through to new All Time Highs (+38% from previous ATH). In November 2022 it was all doom and gloom for the social media giant and it is worth searching for news headlines at the time to see the similarities with Tesla's situation today.
Time will tell of course, but we wanted to bring this comparison to you and help you draw your own conclusions.
-------------------------------------------------------------------------------
** Please LIKE 👍, FOLLOW ✅, SHARE 🙌 and COMMENT ✍ if you enjoy this idea! Also share your ideas and charts in the comments section below! This is best way to keep it relevant, support us, keep the content here free and allow the idea to reach as many people as possible. **
-------------------------------------------------------------------------------
💸💸💸💸💸💸
👇 👇 👇 👇 👇 👇

Meta Surged to New Heights is there Room for Continued Growth Meta and Amazon stocks have risen following an increase in their price targets by a Wall Street analyst team. Jefferies, the analysts, reiterated a buy rating for Meta ( NASDAQ:META ) and raised their price target for the Facebook parent company to $585 from $550. Additionally, they raised their price target for Amazon stock to $225 from $190. Meta's stock has risen more than 3.5% to $525.62, and Amazon's stock is up more than 1% at $184.88, approaching an all-time high above $188 reached in July 2021.
Jefferies' report stated that Meta ( NASDAQ:META ) has too many advantages to count compared to competitors in the digital advertising market. Meta's revenue is mostly driven by ads, and the company has been investing in artificial intelligence tools to help drive more engagement and ad sales on its applications. They include Facebook, Instagram, Reels, WhatsApp, and Threads. As a result of these investments, Meta ( NASDAQ:META ) has developed several strategic advantages over peers, such as a strong artificial intelligence-based recommendation engine for its Reels short-video product that is driving more time spent on Facebook and Instagram.
Meta ( NASDAQ:META ) is set to report its first-quarter earnings on April 24 and has seen a 47% increase in its stock price this year. In addition, Meta Platforms Inc. ( NASDAQ:META ) is reintroducing cash bonuses for content creators on its social media apps. The company is testing the "Spring Bonus" initiative in the United States, South Korea, and Japan, rewarding creators on Instagram for engagement not just on videos and reels, but pictures as well. The maximum creators can earn in thirty days is $30,000. The company will also similarly reward select creators for engagement on Threads, its Twitter-like social app, and content labeled as "collaboration" or "branded" will not be eligible for monetization.
Technical Outlook
Meta ( NASDAQ:META ) for 20 weeks now has been trading above the 200, 100 and 50-day Moving Averages respectively with a Relative Strength Index (RSI) of 63 indicating strong bullish sentiment.

META: $440 is the least sellers can target.META Platforms may have turned neutral on the 1D timeframe (RSI = 53.558, MACD = 15.800, ADX = 23.681) but remain extremely overbought on the 1W (RSI = 76.808). The stock hit the HH trendline that dates back to January 2018, while the 1W MACD is about to form a Bearish Cross. During these six years, the stock has had five standard corrections (excluding the 2022 Bear Cycle) between -15.90% and -44.00%.
The minimum one was the most recent in August 2023. We expect at least such a -15.90% correction before buyers start accumulating again above the 1W MA50, so our sell target is placed accordingly (TP = 440.00).
See how our prior idea has worked out:
## If you like our free content follow our profile to get more daily ideas. ##
## Comments and likes are greatly appreciated. ##

Meta Platforms:From Struggle to Surge - 2024 Investment OutlookIn 2022, Meta Platforms faced turbulent market conditions amid doubts surrounding CEO Mark Zuckerberg's metaverse ambitions, resulting in a significant 64% decline in share prices. However, the company's trajectory has undergone a remarkable transformation since hitting rock bottom, with shares soaring by 321% since the close of 2022.
Despite this impressive rebound, Meta's shares continue to present an attractive investment opportunity, supported by several compelling factors.
Meta stands out as one of the top-performing stocks in 2023, trading at a forward price-to-earnings ratio of 25.6, representing a discount compared to the Nasdaq-100 index's average forward P/E of 30.4. Wall Street analysts anticipate significant growth for the company, with projected compound annual rates of 14% for revenue and 21.3% for earnings per share over the next three years.
Moreover, Meta's unparalleled dominance in the social media landscape is a key driver of its appeal. With Facebook, WhatsApp, Instagram, and Messenger boasting over 4 billion monthly active users collectively, Meta's reach is unmatched, engaging nearly half of the global population.
The company benefits from formidable competitive advantages, including powerful network effects and a substantial data advantage, positioning it as a leader in digital advertising. With $132 billion in revenue in 2023, Meta has become the preferred platform for advertisers seeking targeted advertising and value for their spending.
Meta's robust financial performance further enhances its investment appeal, with a 2023 operating margin of 35% and $43 billion in free cash flow. The company's strong finances enable it to return capital to shareholders through stock buybacks and dividends, reflecting its commitment to delivering value to investors.
In conclusion, Meta Platforms emerges as a compelling investment opportunity in 2024, offering an appealing valuation, unparalleled social media reach, and robust financial performance. With its leadership position in the digital landscape and strategic investments in the metaverse, Meta is poised for continued growth and success in the years to come.

Meta Stock Surges Above $500 As It Touts AI-Powered GainsMeta Platforms ( NASDAQ:META ) experiences a remarkable surge, surpassing the $500 mark once again, as the company unveils its pioneering advancements in generative artificial intelligence (AI), signaling a new era of innovation and engagement within the social media landscape.
Meta's Outlook:
Meta's adoption of powerful generative AI models for video recommendations across its ecosystem marks a significant strategic move to enhance user engagement. Facebook head Tom Alison reveals positive results from utilizing large language models to optimize video recommendations, showcasing an 8%-10% increase in watch time for Reels on Facebook. ( NASDAQ:META ) company outlines its technology roadmap, highlighting plans to scale AI-driven enhancements across its platforms through 2026, aiming for more engaging and responsive user experiences.
Market Performance:
Meta's ( NASDAQ:META ) stock experiences a notable uptick, climbing nearly 4% amidst investor optimism surrounding the company's AI initiatives. With shares surging nearly 180% over the past year, Meta solidifies its position as a frontrunner in the AI landscape.
Meta's Open-Source AI Approach:
Meta's ( NASDAQ:META ) commitment to an open-source approach to AI, exemplified by the availability of its large language model Llama to developers and researchers, underscores its dedication to fostering innovation and collaboration within the AI community.
Strategic Implications:
Meta's AI advancements not only drive user engagement but also hold the potential for increased monetization opportunities through enhanced ad targeting and user interaction. CEO Mark Zuckerberg emphasizes the importance of unifying recommendation systems across various content formats, highlighting the company's focus on delivering personalized and compelling user experiences.
Catering to the Next Generation:
Tom Alison underscores Meta's efforts to cater to the evolving preferences of Gen Z users, emphasizing the importance of social media as a platform for personal expression and exploration of diverse interests.
Expansion in E-commerce Advertising:
In addition to its AI endeavors, Meta garners attention for its growing presence in e-commerce advertising, with the Wall Street Journal reporting substantial investments from Chinese e-commerce platform Temu, highlighting Meta's increasing role in facilitating global commerce.
Conclusion:
Meta Platforms' ( NASDAQ:META ) relentless pursuit of innovation and its strategic embrace of AI-driven technologies position it at the forefront of the social media landscape. With continued advancements in AI and expansion into new avenues of advertising and engagement, Meta reaffirms its commitment to shaping the future of social media and digital interaction.

Facebook, Instagram & Threads Back Online After OutageMeta Platforms. (NASDAQ: NASDAQ:META ), the parent company of popular social media platforms like Facebook and Instagram, faced a brief outage on Tuesday morning, disrupting services for users worldwide. Despite the outage lasting approximately two hours, Meta swiftly restored access to its platforms, alleviating concerns among users and investors alike.
Key Outage Details:
The outage primarily impacted Facebook and Threads, with users reporting difficulties accessing the platforms as early as 10 a.m. ET. Instagram users also faced issues, including feed refreshing problems. However, Meta spokesperson Andy Stone reassured users, stating that the technical issue was promptly resolved, attributing it to a temporary glitch.
Impact on Presidential Primaries and Social Media Campaigns:
The timing of the outage coincided with Super Tuesday presidential primaries in the U.S., raising concerns for political campaigns reliant on social media platforms for voter engagement. The disruption underscored the critical role platforms like Facebook and Instagram play in modern political communication strategies.
Market Reaction and Tech Disruptions:
The outage prompted a flurry of activity on social media, with hashtags like "#instagramdown" and "#facebookoutage" trending on X. Meta's stock saw a slight dip, reflecting investor sentiment amidst the temporary service disruption. Additionally, Meta acknowledged "major disruptions" across its business products, including Meta Admin Center and Facebook Login.
Broader Tech Landscape:
Google's YouTube also experienced technical difficulties on the same day, further highlighting the interconnected nature of tech platforms. While Meta's outage was swiftly resolved, disruptions in other services like Gmail raised questions about potential underlying infrastructure issues in the tech ecosystem.
Conclusion:
Despite occasional setbacks like the recent outage, Meta ( NASDAQ:META ) continues to be a dominant force in the social media landscape. As users and investors navigate occasional disruptions, Meta's ability to swiftly address technical challenges reaffirms its commitment to ensuring seamless user experiences.

META Analysis! Trend Reversal!META Weekly Analysis!
Inverted Head and Shoulders Pattern Formation in META!
Trend Reversal in META!
META was in a clear downtrend. After it has made a Inverted Head and Shoulders pattern on a weekly timeframe. It has given a breakout to it's neckline and retested it so it can be act like a next support level which i've extended. Inverted Head and Shoulders pattern is a Trend Reversal Pattern. Now we can see a strong bullish momentum. The important upside levels are marked on the chart so please have a look on it and one more important thing is we can set a stop loss below the neckline.
Thank You!
Disclaimer = All my analysis are for Educational Purpose only. Before entering into any trade - 1) Educate Yourself 2) Do your own research and analysis 3) Define your Risk to Reward ratio 4) Don't trade with full capital

META Technical Analysis and Trade Idea#META has experienced a remarkable bullish surge. However, the 1D timeframe indicates potential weakness as we see the trend ranging sidweays creating lower highs. We are considering a possible retracement towards the 50-61.8% Fibonacci zone potentiall trading through the gap evidenced on the chart. This area typically attracts increased liquidity due to sell stops, potentially encouraging long positions from institutional traders.
Trading Considerations Meta Platforms:
Counter-Trend Short: Explore a short entry near the current price level, strategically placing a stop-loss above the recent highs. Maintain a 1:1 risk-reward ratio for this trade.
Fibonacci Buy: Target a potential buy opportunity close to the 61.8% Fibonacci retracement level. This aligns with the possible accumulation of long positions by larger market players. Utilize a stop-loss below the recent swing low, and define target levels as shown on the screenshot.
Disclaimer: This analysis offers my personal market interpretation for educational purposes and should not be considered direct financial advice. Always prioritize your own independent research and thorough risk assessment before making any trading decisions.

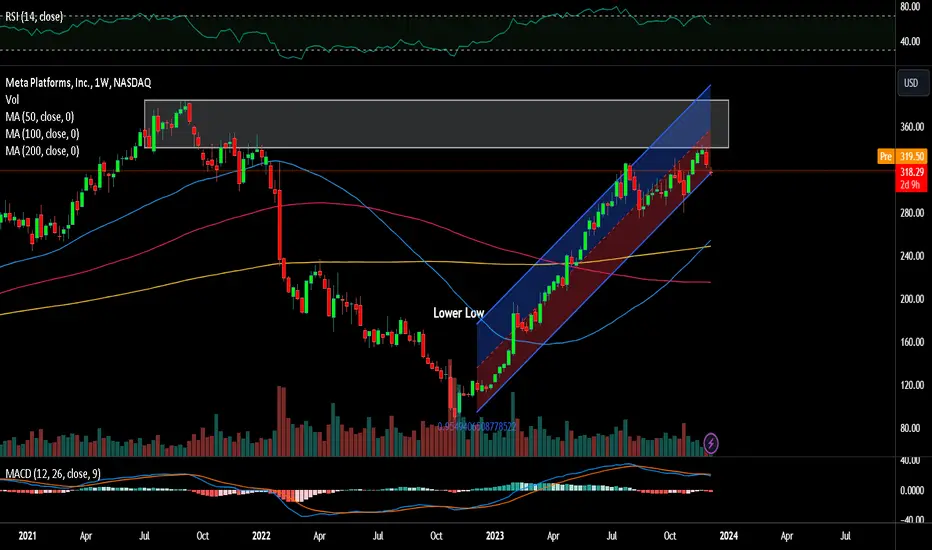
META Is it finally time to correct?Meta Platforms (META) has been among the biggest winners in 2023 and of course is having a great start to 2024 as well. Those who follow us know that we have been big bulls on META even right on its 2022 bottom (see charts below), when most of the market had lost faith in the company's operations, business model and its ability to generate profit.
We even mapped to perfections its V-shaped recovery to new All Time Highs (ATH)
As the company had one of its best 1W candles in history last week following the dividends announcement, we are starting to consider a short/ medium-term pull-back for the stock. This is also justified by historic price action. Since the current large Megaphone pattern started in mid 2018, META has corrected to or below its 0.236 Fibonacci retracement level within a -16.00% to -19.77% decline range, 5 times. On all cases except for the initial 2023 recovery, the 1W RSI was overbought above the 70.00 mark. Right now the 1W RSI is on its most overbought state in history.
As a result, we have a growing belief that it is time for the social media giant to start correcting again. A minimum of -16.00% decline will deliver a $410.00 Target level for META, just below the 0.236 Fibonacci level. Note that during all such declines, the 1W MA5 (blue trend-line) provided support, closing all candles above it.
Do you think it is time for a 4 - 6 week correction?
-------------------------------------------------------------------------------
** Please LIKE 👍, FOLLOW ✅, SHARE 🙌 and COMMENT ✍ if you enjoy this idea! Also share your ideas and charts in the comments section below! This is best way to keep it relevant, support us, keep the content here free and allow the idea to reach as many people as possible. **
-------------------------------------------------------------------------------
💸💸💸💸💸💸
👇 👇 👇 👇 👇 👇

META Platforms Options Ahead of EarningsIf you haven`t bought the dip on META:
Then analyzing the options chain and the chart patterns of META Platforms prior to the earnings report this week,
I would consider purchasing the 395usd strike price in the money Calls with
an expiration date of 2024-2-9,
for a premium of approximately $19.15.
If these options prove to be profitable prior to the earnings release, I would sell at least half of them.

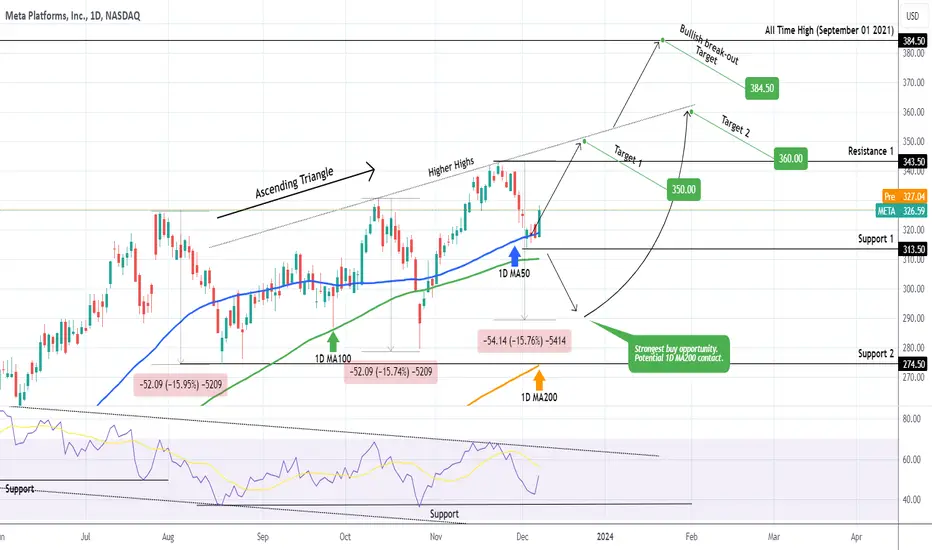
META One more rally before correction.Meta Platforms (META) gave us an excellent bottom buy opportunity last time we looked at it (December 08 2023, see chart below) having hit already Target 1 (350.00) and currently going for Target 2 (384.50) following the Higher Highs break-out:
As long the Higher Highs trend-line holds, we expect a technical rejection at or slightly above the 384.50 All Time High (ATH) target and subsequent correction towards at least the 1D MA50 (blue trend-line). The last medium-term correction has been -8.70%, which gives us a minimum target of 351.00 on the downside.
If the decline extends, we can see a maximum (from a technical perspective) decline of around -15.75% (similar to October 26 and August 18 2023) that could test the 1D MA200 (orange trend-line) and will be the strongest long-term buy opportunity.
-------------------------------------------------------------------------------
** Please LIKE 👍, FOLLOW ✅, SHARE 🙌 and COMMENT ✍ if you enjoy this idea! Also share your ideas and charts in the comments section below! This is best way to keep it relevant, support us, keep the content here free and allow the idea to reach as many people as possible. **
-------------------------------------------------------------------------------
💸💸💸💸💸💸
👇 👇 👇 👇 👇 👇

Meta - Buy The DipHello Traders, welcome to today's analysis of Meta Platforms.
--------
Explanation of my chart analysis:
During 2022 Meta Platforms declined massively and dropped more than -70% all the way down to the previous support at the psychological $100 level. From there we saw a pump of more than 250% after which we could now see a short term pullback followed by new all time highs.
--------
I will only take a trade if all the rules of my strategy are satisfied.
Let me know in the comment section below if you have any questions.
Keep your long term vision.

Navigating the $META Wave
Investors have paid higher prices over time to buy NASDAQ:META and the stock is in a rising trend channel . This signals increasing optimism among investors and indicates continued rise. NASDAQ:META stock has broken up through resistance at dollar 327.
This predicts a further rise. In case of negative reactions, there will now be support at dollar $327. Volume has previously been low at price tops and high at price bottoms. This weakens the rising trend and could be an early signal of a coming trend break.
New Partnership
NASDAQ:META and ONDC Partner To Support Small Businesses in India for Seamless Conversation Buyer and Seller Experiences. As per its commitment to upskill 10 million small businesses across the country, Meta Small Business Academy offers a certification to empower entrepreneurs and marketers to gain critical digital marketing skills to grow on the Meta apps.

Meta and IBM Team up Against Dominant Big Tech PlayersIn a prominent push toward open-sourcing artificial intelligence, IBM and Meta on Tuesday launched a group called the AI Alliance, an international coalition of corporations, universities and organizations that are collectively committed to "open science" and "open technologies."
The Alliance, according to a statement, will be "action-oriented," and is meant to better shape the equitable evolution of the technology.
Some prominent members of the organization include AMD, Cornell University, Harvard University, Yale University, NASA, Hugging Face and Intel.
The goal of the group, according to a statement, is to enhance responsible innovation by ensuring trust, safety and scientific rigor. To achieve that goal, it will push for the development of benchmarks and evaluation standards, support AI skill-building around the world and highlight members' use of responsible AI.

META Is it a BUY again?Meta Platforms (META) hit our $320.00 target after our most recent November 19 call (see char below) following a clear rejection on the Higher Highs trend-line:
The stock has since held the 1D MA50 (blue trend-line) as its short-term Support and turned into a buy again. The short-term target is still limited to the Higher Highs trendline and in that sphere of logic, we will target $350 (Target 1).
If however Support 1 (313.50) breaks, we might see another almost -16% decline, similar to the previous two bearish legs since July 28, which can test the 1D MA200 (orange trend-line). That will be the strongest buy opportunity on the medium-term and we will target again the Higher Highs trend-line at $360 (Target 2).
Any candle closing above the Higher Highs trend-line will be an automatic bullish break-out signal, targeting straight the All Time High at $384.50.
-------------------------------------------------------------------------------
** Please LIKE 👍, FOLLOW ✅, SHARE 🙌 and COMMENT ✍ if you enjoy this idea! Also share your ideas and charts in the comments section below! This is best way to keep it relevant, support us, keep the content here free and allow the idea to reach as many people as possible. **
-------------------------------------------------------------------------------
💸💸💸💸💸💸
👇 👇 👇 👇 👇 👇
Meta Platforms Inc. Join Forces In Open AI Advocacy InitiativeMeta Platforms (NASDAQ:META) and International Business Machines (NYSE: IBM) have announced the formation of an AI Alliance, a coalition of over 50 AI companies and research institutions advocating for an open model of AI.
The alliance, which includes notable members such as Intel INTC and the National Science Foundation, aims to pool resources for “open innovation and open science” in AI, The Wall Street Journal reported.
The majority of the members are proponents of open-source tech, which involves freely shared technology and a history of collaboration among Big Tech, academia, and independent coders.
IBM and Meta have been working together since August to form this alliance. Darío Gil, senior vice president at IBM and director of IBM Research, expressed dissatisfaction with the AI discussions over the past year, stating, “We did not feel that it reflected the diversity of the ecosystem that is making this AI moment possible.”
Despite IBM’s AI history being tainted by the faltering of its Watson system, Gil said its new Watsonx system is a completely new platform. Similarly, Meta, despite some setbacks in AI development, is attempting to establish a foothold in the thriving AI market through its open-source AI system, Llama 2 AI model.
The formation of the AI Alliance comes at a time when businesses are seeking more AI product providers to reduce the risk associated with single-vendor dependency. This need for a more distributed approach is something the AI Alliance aims to address.
META Price Momentum
META is trading near the top of its 52-week range and above its 200-day simple moving average.
Investors have been pushing the share price higher, and the stock still appears to have upward momentum. This is a positive sign for the stock's future value.
Meta And IBM Launch AI Alliance Amid OpenAI ChallengesMeta and IBM formed an AI alliance to counter OpenAI dominance, reshaping AI's future with success hinging on execution and safety commitment.
In a strategic move to reshape the AI landscape, Meta Platforms and IBM have spearheaded the formation of the AI Alliance, a coalition comprising over 50 leading artificial intelligence (AI) companies and research institutions. Notably, this alliance, born out of dissatisfaction with the one-sided discourse dominated by entities like OpenAI, is geared towards promoting open innovation and open science in the rapidly expanding AI domain.
Unlocking the Power of Collective Innovation
In a joint effort, Meta Platforms and IBM have orchestrated the birth of the AI Alliance, a collaborative force of over 50 influential players in the field of artificial intelligence, according to a WSJ report. Notably, this alliance, which boasts prominent members such as Intel, Oracle, Cornell University, and the National Science Foundation, aims to champion “open innovation and open science” in the realm of AI.
Meanwhile, Dario Gil, IBM’s Senior Vice President and Director of IBM Research, voiced dissatisfaction with ongoing AI discussions, emphasizing the need for a more inclusive representation of the diverse ecosystem driving the current AI advancements.
Gil acknowledged the overshadowing narrative led by generative AI since the advent of OpenAI’s ChatGPT a year ago. Unlike closed systems maintained by their creators, the AI Alliance is championing the cause of open-source technology, fostering collaboration among industry giants, academia, and independent programmers.
Notably, many members of the alliance already possess their AI products but are striving to keep pace with the attention garnered by OpenAI and its partner, Microsoft.
Shifting Tides in the AI Market
As enterprises globally are projected to spend nearly $16 billion on generative AI solutions in 2023, the AI Alliance is strategically positioning itself to offer a more distributed and resilient alternative. Notably, the recent upheaval at OpenAI has prompted businesses to seek diversified providers, minimizing the risk associated with relying on a single vendor.
Meanwhile, Meta’s foray into the open-source AI market through its Llama 2 AI model and IBM’s introduction of the Watsonx system underscore the alliance’s commitment to driving innovation. In addition, IBM’s Gil expressed the significance of adopting a decentralized approach, asserting that it enhances resilience by preventing any single institution from obstructing the success of the open engine. He stated, “This alternative method is more decentralized and robust.”
The AI Alliance’s launch signifies a pivotal moment in the AI landscape. As businesses explore alternatives to mitigate risk, the alliance, with its emphasis on open innovation, stands as a compelling option. Meanwhile, Ritu Jyoti, Group Vice President of Worldwide AI at IDC, notes, “It will all depend on how well they execute it.”
Meanwhile, the alliance’s focus on areas like regulation and safety, with plans to release a benchmarking tool for AI safety and model validation, further solidifies its commitment to reshaping the future of AI through collective effort.

🔴 META PLATFORM: Daily Technical Analysis & SetupHi Traders!
From a technical point of view, NASDAQ:META is very interesting for Day Traders, but at the same time it could also give some opportunities to Aggressive Traders (Intraday) in short term. Having said that, if we look at Daily Chart the trend is bullish in mid-long term, but in the short term we do not exclude a bearish consolidation before another rally. For Day Traders Setup is very simple, wait for pullback to take long position as shown on the chart. Money Management also seems interesting, with a risk of 2% we get a Risk/Return Ratio > 1:8 (not bad).
🔴 INTRADAY ANALYSIS
How can we get to our Setup Area?
==============================
Now we need to understand how META could reach our Setup Area, and it could do so simply in two ways: with a bullish scenario (Top and Impulsive Structure still in play) or with a bearish scenario (ABC Pattern in play), as shown on two chart below. Both of these two scenarios should be able to reach our setup area on the daily chart:
Trade with care
Like | Share | Comment

🚨♾Meta Platforms(META)♾ will Go Down at least ➖20%🚨🏃♂️♾ Meta Platforms(META) ♾ is moving near the 🔴 Resistance zone($332-$315) 🔴.
💡Also, we can see Regular Divergence (RD-) between two consecutive peaks .
In terms of Elliott wave theory , the Meta Platforms(META) seem to have completed the main wave 3 at the 🔴 Resistance zone($332-$315) 🔴 with the help of the Expanding Ending Diagonal Pattern .
🌊It is interesting to note that in the middle of main wave 3 , the main Bullish Long Island Pattern can be seen, which confirms our wave count.
🔔I expect the Meta Platforms(META) to lose at least ➖20% of its value after breaking the lower line of the Expanding Ending Diagonal and reaching the 🟡 Price Reversal Zones(PRZ) 🟡, Support line(1) and 🔵 200_SMA(Weekly) 🔵.
📚If you want to know about the types of Gaps , you can read the following article.👇
Meta Platforms( METAUSD) Analyze, Daily time frame⏰.
Do not forget to put Stop loss for your positions (For every position you want to open).
Please follow your strategy; this is just my Idea, and I will be glad to see your ideas in this post.
Please do not forget the ✅' like '✅ button 🙏😊 & Share it with your friends; thanks, and Trade safe.

Meta (NASDAQ:META) Faces Legal Heat in the U.S. and EuropeSocial media giant Meta Platforms (NASDAQ:META) is in trouble over privacy issues. In a setback for Meta, Judge Timothy Kelly of the U.S. District Court for the District of Columbia ruled that the U.S. Federal Trade Commission (FTC) can seek to lower the amount of money the company makes from users below the age of 18 years.
Price Momentum
META is trading near the top of its 52-week range and above its 200-day simple moving average.
What does this mean?
Investors have been pushing the share price higher, and the stock still appears to have upward momentum. This is a positive sign for the stock's future value.

A Positive View on META Platforms Inc. Meta Platforms (NASDAQ:META) and has recently revised the price target from $380 to $435, highlighting its innovative approach, integration of artificial intelligence, and strong financial standing as key drivers of growth.
One of the factors contributing to this positive sentiment is Meta Platforms’ recent initiatives, such as the launch of the Threads app, which is viewed as a catalyst for future growth. These developments have further solidified financial institutions that Meta Platforms is a strong buy, with a promising outlook for its future performance.
META's Positive Outlook
META’s market capitalization stands at an impressive $858.8 billion, highlighting its prominence in the technology services sector. Despite a challenging year for the company, with a negative earnings growth of -38.26% in the previous year, META has shown resilience and is projected to experience a positive earnings growth of +40.43% this year. Looking ahead, the company is expected to maintain a steady earnings growth of +20.88% over the next five years.
In terms of revenue growth, META experienced a decline of -1.12% in the previous year. However, the company’s strong market position and potential for growth are evident from its financial indicators. META’s price-to-earnings (P/E) ratio stands at 30.1, indicating that investors are willing to pay a premium for the company’s future earnings. The price-to-sales ratio of 2.79 and price-to-book ratio of 6.95 further reflect the market’s positive sentiment towards META’s prospects.
Taking a broader perspective, META operates in the technology services sector, specifically in the internet software/services industry. As a leader in this industry, META has established its corporate headquarters in Menlo Park, California, a hub for technological innovation.
Despite challenges in the past, META is expected to experience significant earnings growth this year and maintain a steady growth trajectory over the next five years. As a prominent player in the technology services sector, META’s stock performance is influenced by broader market movements and sentiment. Investors and analysts will eagerly await the next reporting date to gain further insights into META’s financial performance and growth potential.
