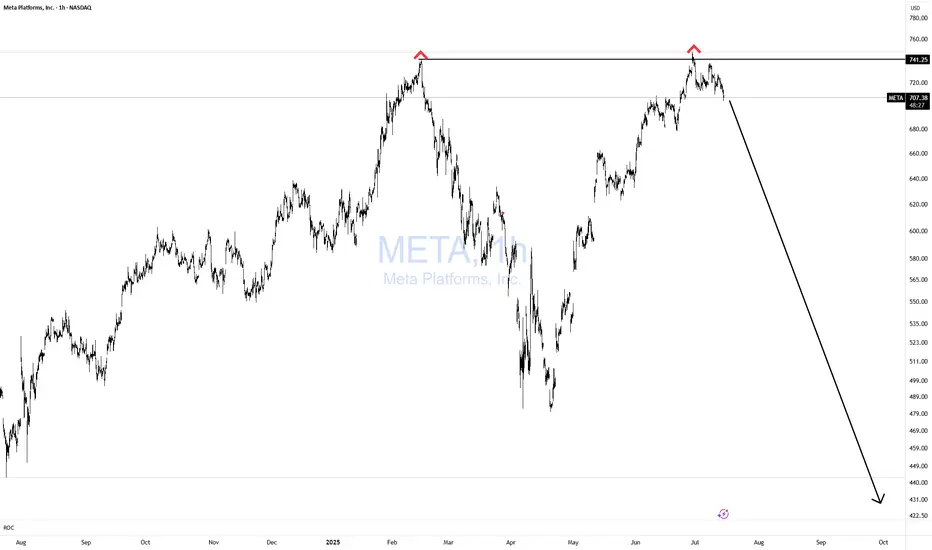
META Double Topping!Does it get any easier than this? NOPE!
If you can't spot this pattern from 1000 miles away, then you need a lot more time in the seat, training yourself in TA.
Simple with great risk reward!
Bulls GTFO!
Metashort
META Bearish Swing Alert – Bear in Hiding? Watch for Breakdown B
🔻 NASDAQ:META Bearish Swing Alert – Bear in Hiding? Watch for Breakdown Below $690 🐻
📅 Posted: July 18, 2025
💡 All models say “bearish,” but volume is the wildcard. Tight play, big potential.
⸻
🧠 AI Consensus Summary: Bearish But Not Triggered
Model Bias Key Notes
Grok 🐻 Bearish RSI 40.5, weak volume, neutral options flow. No clear flow bias.
Claude 🐻 Bearish Same indicators. Recommends conditional entry.
Gemini ⚠️ Bearish Wait Bearish bias but no trigger yet due to low volume.
Llama 🐻 Cautious Bear Trade only if breakdown below $678 with volume.
DeepSeek 🐻 Bearish No bull signals. Neutral options flow confirms low conviction.
⸻
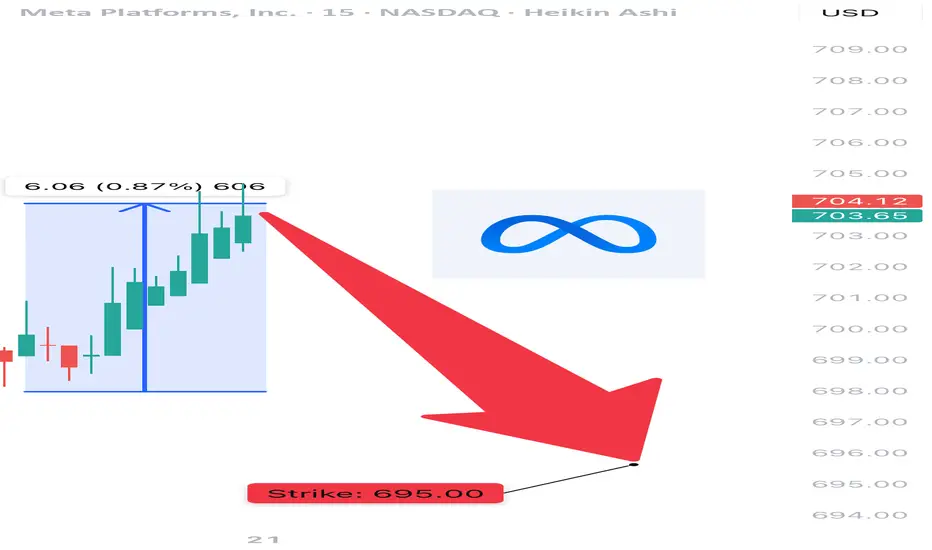
⚙️ Setup Details – META Naked Put
🎯 Strike: $695.00
📅 Expiry: August 1, 2025
💰 Entry Price (Premium): $22.70
💵 Profit Target: $30.00
🛑 Stop Loss: $14.00 (~40% of premium)
📏 Contract Size: 1
📈 Confidence Level: 70%
⏰ Entry Timing: Market open — only if price breaks below $690 with volume confirmation
🕒 Signal Timestamp: 2025-07-18 @ 10:54 AM EDT
⸻
🔍 Why This Works
• ✅ Technical Trend: RSI < 45, negative 5-day/10-day momentum
• 🧊 Options Flow: Flat — no bullish bias = clean downside setup
• 🧨 Trigger Level: Breakdown below $690 = institutional exit confirmed
• ⚠️ Key Caveat: Weak volume = don’t front-run the breakdown
⸻
📌 Levels to Watch
• ⚠️ Breakdown Confirm: Below $690 with volume > 1.25x
• 🧱 Target Zone: $678 support
• ❌ Invalid If: Bounces back over $705 on volume
⸻
🚨 Risk Warning
This isn’t the “all-in” moment — it’s a sniper trade.
No volume = no entry. Tight stop. Fast hands. Smart size.
⸻
📊 TRADE SNAPSHOT
{
"instrument": "META",
"direction": "put",
"strike": 695.0,
"expiry": "2025-08-01",
"confidence": 0.70,
"profit_target": 30.00,
"stop_loss": 14.00,
"size": 1,
"entry_price": 22.70,
"entry_timing": "open",
"signal_publish_time": "2025-07-18 10:53:53 UTC-04:00"
}
⸻
🔁 Follow for more AI-backed trades
💬 Is META breaking down — or faking out?
👀 Drop your entry thoughts in the comments.
META PUTS IN THE MORNINGHere is META currently rejecting the supply zone around 660.60. If price returns anywhere within the RED Zone tomorrow I will entering. If it Wicks at OPEN ill be entering heavy.

META - A Clear Short CandidateThere are just too many signs to not take a Short in META.
- failed to reach the Warning-Line.
- massive resistance
- breach of the Trend-Barrier
- insanely overextended
Potential (partial) targets are the
- U-MLH
- Orange CL
- White CL
- L-MLH of both
May Santa be with us §8-)

meta going downanother trillion market cap companie, as the rest of them all apart of msft that has head and shoulders, all of them have the same pattern, an perfect droping in price pattern, that has the major indexes as well, so a coming drop in price is comming, if not corrected in the next days, going up a lot and in the thecnical indicators, because all of my technical indicatpors has a big divergence on the price and the indicator value, causing an sentiment of eminent drop in price,
again do your research, this is not an investment idea, this is only my point of view, that the market is in a eminent drop in value, that can sp500 reach 2300 points again,
do your research, and do your investment as your research says what you found out, but this is my point of view,

META daily channel is getting tight.NASDAQ:META daily chart shows consolidation and has a lot of room to supply above recent highs, should the daily 5 SMA confirm to the upside. Watching closely to see which way this consolidation resolves, as there are always a million opinions, but only one confirmation.

Put US stock: META👋Hello Traders,
Our 🖥️ AI system detected that there is an ICT Short setup in META for scalping.
Please refer to the details Stop loss, FVG(Supply Zone),open for take profit.
For more ideas, you are welcome to visit our profile in tradingview.
Have a good day!
Please give this post a like if you like this kind of simple idea, your feedback will bring our signal to next better level, thanks for support!

Short Meta updateThe recent top is our first pivot point, we will anchor short entries below the 472 level with target 1 at the previous top 384. This is the first test trade against a pivot top and a tight stop range should be set.
There is a massive short coming which will be a steep fall, a crash fractal unless the cycle alters in an unlikely event.
Trade safe, stay connected..... good luck

Short $META at $350 down to $81 targetLike many of the other tech stocks META looks extended here.
I could see one more move up into the $350 region, and if it hits there, I think that sets up a good short opportunity.
Lots of people saying we're starting a new bull trend, but what makes me think that's not true?
In a bull trend, you see a slow rise up, not a 300% bounce in a year. That indicates to me that this move has been corrective and not impulsive.
I think we're nearing a top and once we hit it, I think it'll be a fast decline down to the $81 target on the chart.
I'll be playing this move through options w/ expiry into late 2024/early 2025

META has setup rather bearishMETA had a pretty good breakdown on it earnings and has retested nicely. Breaching below the 100-MA and has a rather large air pocket to the 200-MA. Plenty of good spots to put a stop loss.

META has the potential for an EPIC failThe squeeze to the upside was phenomenal!
But in my view, they over-pumped it - who ever it was...
The white Center-Line provided good support when price failed at the GAP/Resistance Zone. this zone is built just with the range of the GAP-Bar.
After the CL support, meta reached the another temporary high at the orange CL, bounce back to the white CL again and once more got pumped up to the orange CL/GAP/Resistance zone, where it hangs out now.
Of course; If I had the money to move markets, I would want my Stock to be as high as possible to a) unload and b)short it for a Double-Whammy.
The huge divergence with price and RSI speaks for it self.
I know that I know NOTHING.
But I know what I can "Project" into the future.
It's good to be prepared, also for a move in the opposite direction, which is Up Up and away.
That means, if I short, my risk is small. No need to be a Hero and win a T-Shirt for putting myself at risk to loose my House, Cats & Dogs.
I am fully aware, that price is currently ABOVE the white CL and no lower low is broken yet. That's what makes a short so difficult.
Peace4TheWorld!

Time to short, target 230Following weekly,
I got an overbought signal from my indicator and I think this is the end of run, we can expect some pull back to FIBO.
TP 230
SL 269 - please wait weekly close.

Meta waiting for selling a stop order !according to my chart analysis Meta Facebook will go down if price reached entry level .

Meta will down for last wave of triangle Meta will down for last wave of contracting triangle , wave e can see under HKEX:175
after that , it can go up

Meta ShortNASDAQ:META
Rejecting candle, Gap below, Weak on green days, Meta is on the way to close the gap.
TP - Gap close if reject or cpi will change the results may close trade before.

META still in bearish channelNASDAQ:META has rallied since the earnings of late October, but is still in a long-term bearish channel.
It has retraced 78.6% of the the gap (down) made the day of its Earnings report.
I can picture the stock rallying to $130, but not much farther, and then being smacked down around mid-to-late December.

META to extend losses even more?Meta - 30d expiry - We look to Sell a break of 107.98 (stop at 115.15)
The primary trend remains bearish.
There is no clear indication that the downward move is coming to an end.
This is curremtly an actively traded stock.
108.32 has been pivotal.
A break of the recent low at 108.32 should result in a further move lower.
Our overall sentiment remains bearish looking for lower levels.
Our profit targets will be 91.04 and 88.04
Resistance: 126.40 / 134.00 / 142.00
Support: 115.00 / 108.50 / 96.00
Please be advised that the information presented on TradingView is provided to Vantage (‘Vantage Global Limited’, ‘we’) by a third-party provider (‘Signal Centre’). Please be reminded that you are solely responsible for the trading decisions on your account. There is a very high degree of risk involved in trading. Any information and/or content is intended entirely for research, educational and informational purposes only and does not constitute investment or consultation advice or investment strategy. The information is not tailored to the investment needs of any specific person and therefore does not involve a consideration of any of the investment objectives, financial situation or needs of any viewer that may receive it. Kindly also note that past performance is not a reliable indicator of future results. Actual results may differ materially from those anticipated in forward-looking or past performance statements. We assume no liability as to the accuracy or completeness of any of the information and/or content provided herein and the Company cannot be held responsible for any omission, mistake nor for any loss or damage including without limitation to any loss of profit which may arise from reliance on any information supplied by Signal Centre.

META Important Milestone!As you know, I am a long term investor. Thus, I usually buy stocks for the long term, and never short any equities due to shorting's unlimited risk. With a P/E ratio of 10, it would be reasonable to think that META is a good bargain considering its status as a social media giant. However:
1. META's Userbase is declining, something never seen before in the history of the company.
2. Competition like Google's Youtube and ByteDance's Tiktok is catching up and overtaking META
3. New Apple (AAPL) IOS changes, which made META's data collection process much harder, has and will adversely affect its ad revenue (which is 98+% of its total revenue)
---------- Specifically, the IOS change requires META to get the user's permission to collect data for Ads. Until now, data shows that only 33% of users allow META to collect their data for more personalized ads. I think you can see how this affects Ad revenue.
Thus, the "metaverse" is the only thing that may/may not save META from its inevitable doom. However, that means that:
1. The metaverse needs to develop in the years ahead, and not just stay at a gaming level
2. META must have enough cash to fund research into the metaverse
3. It must dominate the metaverse industry
Although I personally think that META is a lost cause, I choose not to label this as "#METAshort" because I think all investor have their own opinions. Here are some good points about META:
1. 10 P/E ratio (lower than S&P 500 average
2. META's adaptability
3. Technicals? (Not seen yet)
I choose to write this now because META's Q3 results are tomorrow and are key to how META's stock and the metaverse will develop in the future.
Anyway, thats all for my idea. Please leave a comment and boost this idea so it can go out to other investors! 😊
P.S. Someone give me coins :)

META BEAR FLAG OTW. Bearish on $META below 137 until 123 unless break AND hold above 143. $VIX is also showing bullish context to comfirm this $META bear flag (failure to go lower) @ Weekly level 137. Would take majority of profit off the table at $128.71 because their may be a pullback to retest around 135.

META stock Trading ideas - 31-Aug-2022Meta has hit the levels 155-158 multiple times, it is more likely that the stock would tend to move lower to the next support.
The next support area currently is at 149 levels.
