FBNot financial advice.
The essence of investing & trading is the intelligent and patient preying on the greed, fear, impatience, addiction and ignorance of the majority. It's definitionally Darwinian.
Metaverse
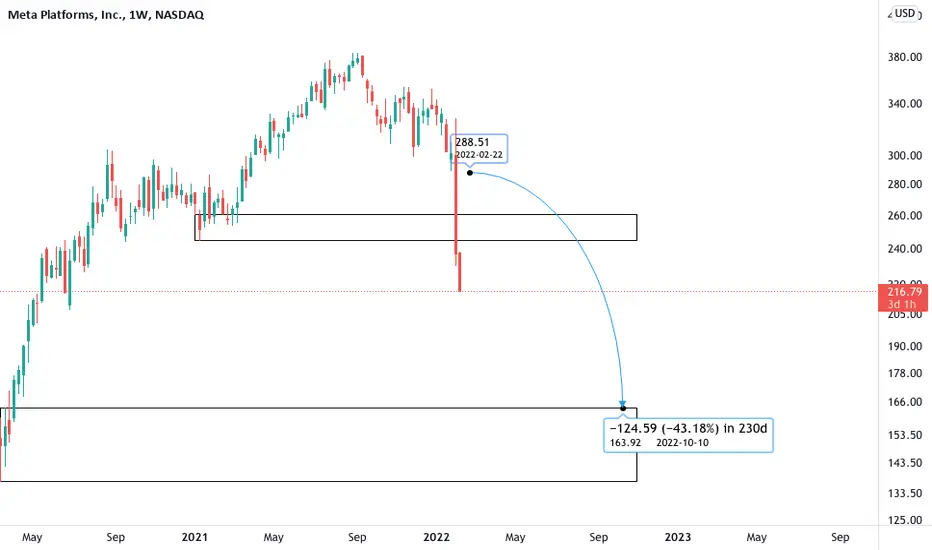
300$ Facebook is a huge buying opportunityLot of stars aligned there
Overlap
38.2% Fibo trend bottom
61.8% Fibo from range
Projection of weekly SMA200
$300 psychological number

$SAND/USDT 2h (#BinanceFutures) Ascending triangle on supportThe Sandbox is pulling back to descending TL / 200MA which is about to golden cross with 50MA!
Current Price= 1.3503
Buy Entry = 1.3472 - 1.2470
Take Profit= 1.6099 | 1.8454 | 2.1595
Stop Loss= 1.0354
Risk/Reward= 1:1.2 | 1:2.1 | 1:3.3
Expected Profit= +24.12% | +42.27% | +66.49%
Possible Loss= -20.18%
Fib. Retracement= 0.559 | 0.702 | 0.883
Margin Leverage= 1x
Estimated Gain-time= 10 days
Tags: #SAND #SANDUSDT #NFT #Metaverse #P2E #Gaming #Creation #Launchpad #DeFi #SolEco
Website: www.sandbox.game
Contracts:
#ERC20 0x3845badAde8e6dFF049820680d1F14bD3903a5d0
#SPL 49c7WuCZkQgc3M4qH8WuEUNXfgwupZf1xqWkDQ7gjRGt

$GMT/USDT 3h (#BinanceFutures) Descending trendline break retestGreen Metaverse Token is pulling back to 50MA support where we expect a bounce then a short-term recovery!
Current Price= 1.0873
Buy Entry= 1.0837 - 0.9723
Take Profit= 1.3545 | 1.6167 | 1.8789
Stop Loss= 0.7658
Risk/Reward= 1:1.25 | 1:2.25 | 1:3.25
Expected Profit= +31.76% | +57.26% | +82.77%
Possible Loss= -25.50%
Fib. Retracement= 0.382 | 0.5 | 0.618
Margin Leverage= 1x
Estimated Gain-time= 2 weeks
Tags: #GMT #GMTUSDT #STEPN #Web3 #NFT #Metaverse #M2E #Social #App #Gaming #GST #BSC #Solana
Website: stepn.com
Contracts:
#BEP20 0x3019BF2a2eF8040C242C9a4c5c4BD4C81678b2A1
#SPL 7i5KKsX2weiTkry7jA4ZwSuXGhs5eJBEjY8vVxR4pfRx

BTC.D Intermarket Analysis This is the BTC Dominance (BTC.D) chart.
BTC.D Down = BTCUSD UP
BTC.D UP = BTCUSD Down
Right now the BTC.D Chart is at a discounted market, however, it seems to be trading up into a premium market which is (technically speaking) why BTCUSD has been falling recently. Based on this chart, BTC will likely drop a lot more from where it's at should we reach up into a further premium for the BTC.D market.
What is BTCD? BTCD is short for Bitcoin dominance (BTCD) and is defined as the ratio of Bitcoin's market capitalization to that of the rest of the cryptocurrency markets. Bitcoin (BTC) is a digital currency that was first introduced back in 2009.

Facebook price overviewThe price is in downtrend since it made it high, so I would expect the price to drop further around 120$ or 130$ , then it would reverse.
Please like share and comment

SAND - Trade setupDownward breakout through the descending triangle pattern, Looking at the market conditions there will be retest towards the breakout point which is my entry range. It needed to be observed that the retest must take place with low volume therefore indicating weak retracement so that we can enter short side. I'll update once my trade entry got triggered in the update section.
Disclaimer : Anything provided here is not a financial advice.

BLOKTOPIA will rise short-termpay attention , BLOK will rise short term. I dont believe it will drop any further, but trade at your own risk. NFA

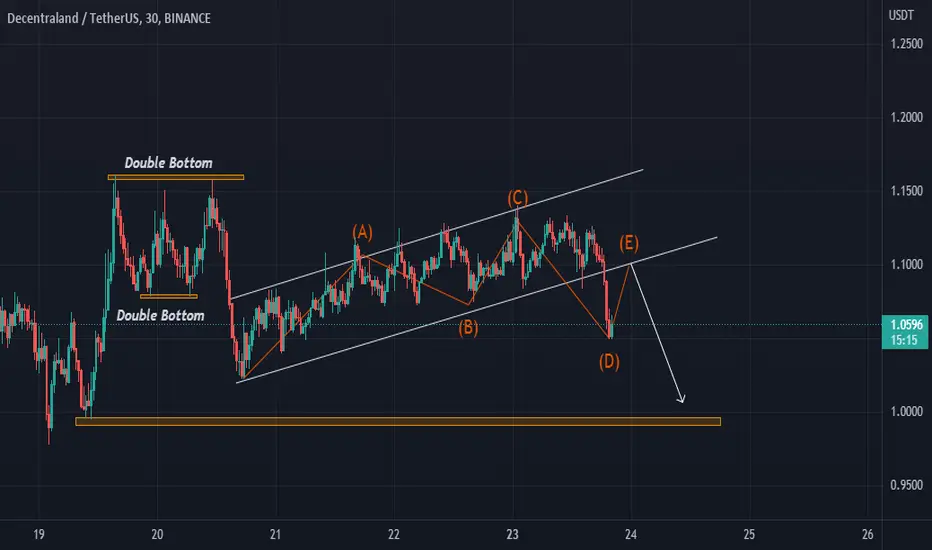
DecentralandMANA/USDT update im waiting for mana to take 1.0350-1.0500 and to take sell for any new update i will post another analysis

AGIX 74,000% 2-8 YEARS!!- AGIX is a great project (artificial intelligence) AI is the future, we already have robots delivering parcels, self driving cars, robotic tech like hoovers and so much more along with so much more coming!
- If you want to make money, then you need to understand that you DOLLAR COST AVERAGE when the markers are down and DOLLAR COST AVERAGE OUT when the markets are up using FIB TARGETS!
- £37 ($46) 2-8 Years from now!!!

A Real Gem!Boson Protocol has partnerships with Tommy Hilfiger and Hugo Boss. The price has been suppressed for months due to the bear market.
Times Square ad and app v2 launch start in the summer. It's one of the few projects that really excites me.

$GST/USDT 4h (#KuCoin) Descending channel breakout⚡️⚡️ #GST/USDT ⚡️⚡️
Exchanges: KuCoin, Huobi.pro, FTX
Signal Type: Regular
Current Price:
2.9169
Entry Zone:
2.9204 - 2.6784
Take-Profit Targets:
1) 3.4039
2) 3.9359
3) 4.6198
Stop Targets:
1) 2.2919
Published By: @Zblaba
Green Satoshi Token is trying to regain 50MA which would initiate a nice recovery!
Risk/Reward= 1:1.2 | 1:2.25 | 1:3.6
Expected Profit= +21.63% | +40.64% | +65.8%
Possible Loss= -18.10%
Fib. Retracement= 0.382 | 0.5 | 0.618
Margin Leverage= 1x
Estimated Gain-time= 2 weeks
Tags: #GSTUSDT #STEPN #NFT #Metaverse #M2E #Social #App #Gaming #GMT #BSC #SolEco
Website: stepn.com
Contracts:
#BEP20 0x4a2c860cEC6471b9F5F5a336eB4F38bb21683c98
#SPL AFbX8oGjGpmVFywbVouvhQSRmiW2aR1mohfahi4Y2AdB

XMRUSDT (MONERO) Daily TA : 05.26.22If you're in profit you can close 50% of your position and just leave the rest of it for more gain . If price can break this resistance the nexty target will be $ 265 .
Follow us for more analysis & Feel free to ask any questions you have, we are here to help.
⚠️ This Analysis will be updated ...
👤 Arman Shaban : @ArmanShabanTrading
📅 05.26.2022
⚠️(DYOR)
❤️ If you apperciate my work , Please like and comment , It Keeps me motivated to do better ❤️

Reverse Head & Shoulder ReversalGALA looks like it's ready to prime itself with a beautiful reverse H&S!
If it can break the neckline at 0.83, it's possible to see it reach the local high of 0.91.
If it fails to break the neckline POC, a tumble back to 0.79 and below is possible.
Not financial advice - Just what I'm doing.


FB (Meta) - Recovery Along Trend Line Similarities can be seen between the first dotted upward trend leading to a rejection, and the second also leading to a rejection
Both retrace to the same uptrend
This is the daily chart, with the first rejection at 2.618 and the second at 4.618
Good buy potential on this daily timeframe

DecentralandMANA/USDT chart is on 30min making Rising Wedge Pattern im waiting for full breakout and i will take SHORT POSITION
$RBLX earnings today 👁🗨*This is not financial advice, so trade at your own risks*
*My team digs deep and finds stocks that are expected to perform well based off multiple confluences*
*Experienced traders understand the uphill battle in timing the market, so instead my team focuses mainly on risk management*
Recap: My team purchased shares of online video game company Roblox Corp $RBLX at $30.72 on 5/5/22. Our first take profit was originally set at $43 per share.
Today my team has averaged down on $RBLX at $22.25 per share. This brings our average down to $26.48. We do not think that $43 per share will be reached anytime soon, and so to be on the safe side we have established a new take profit at $32. This would be a 20.8% increase from our average.
First entry: $30.72
2nd entry: $22.25
Take profit: $32
Earnings are to be reported today after hours. We aren't expecting much, but we are willing to hold this one out long-term until it reaches our take profit.
Good luck to all today!
If you want to see more, please like and follow us @SimplyShowMeTheMoney

Revomon - VR & Mobile Next Generation Monster catch MetaverseRevomon is probably one of the first promising, partly centralized partly decentralized games, based on both VR and mobile, which allows users to tame monsters and evolve them and fight other players. The game is still mostly in its early stages, however, despite being an alpha access, the game is already playable on virtualreality and mobile with various futures, such as converting collected monsters into NFTs and burning them for rewards, a clan system, a ingame marketplace, and the possibility to fight both, NPCs and other players, future planes, as well as refactoring the clan system, include an open world (with NFT lands), quests, other achievements, new revomon (= revolution monsters) and more marvelous game content will be worked on in the coming months, coupled with more ways to give users the opportunity to earn something on the side while they play.... (play2earn features)
The chart currently looks kinda boring, like most crypto projects it got and still get hit hard by high emission and btc overall drop, altough the team is well funded for next 1 1/2 years and have wide options to collect more funds to keep this promising project alive. I expect to see a market recovery until end of year, with Revomon being a full game, the best candidate to grow with the market again and getting the reputation and awareness its deserves. Buying small batches, via DCA, could lead to a good exposure long term with an acceptable Risk / Reward ratio. The token is oversold in various timeframes, but holding timely better than other metaverse games.
This is not a recommendation to buy or sell Revomon tokens. Do always your own research and never invest more than you can afford to lose

DecentralandMANA/USDT i see this crypto testing Strong Support zone if dont break this support i will take LONG position into my Supply zone and waiting for breakout to SELL

BITCOIN 12H TA : 05.18.22 (Update)As you can see, the price is still in the decision range (Trading Range or Sideway Zone) and the buyers did not have enough power to break this resistance, and this can pave the way for more sellers to enter the short positions . Significant support range is from $ 26,800 to $ 29,300, and significant resistance range is from $ 31030 to $ 32700.
Follow us for more analysis & Feel free to ask any questions you have, we are here to help.
⚠️ This Analysis will be updated ...
👤 Arman Shaban : @ArmanShabanTrading
📅 05.18.2022
⚠️(DYOR)
❤️ If you apperciate my work , Please like and comment , It Keeps me motivated to do better ❤️

ZKTUSDT hidden gem on Layer 2. Major updates are here!Fundamental Analysis #ZKTUSDT
zkTube has Rebranded to ZKTMETA :
Key Takeaways
By merging its metaverse operation systems with its industry-leading Layer-2 network, ZKTMETA is turning the dream of a rich metaverse into the average consumer’s reality
The project is all set to facilitate metaverse games with the sophistication of epic proportions thanks to the raw power, affordability, and security of its Layer-2 network
At the same time, it’s empowering creators by laying the groundwork for them with the metaverse operation system. This will undoubtedly accelerate the pace of innovation as more and more creators bring their diverse imaginations to the table
The potential of ZKTMETA is already being realized in the form of its first metaverse game known as MetaTube.
1.Building a Metaverse Operation System on Layer 2
2.Why Layer-2 is the Right Choice ?
3.The Future of Metaverse is Here
4.The First Metaverse Game on ZKTMETA
Checkout their official twitter updates @zkTubeOfficial
Technical Analysis
1.Breakout from 13-21-55 EMA and retesting the level and show's perfect time to enter.
2.Breakout from descending triangle and retesting shows momentum .
3. Etherscan shows major coin holder's are accumulating in dip.
#ZKTMETA #ZKTUSDT #metaverse #blockchain

💂🏻CryptoSoldier💂🏻: BUY AXSBINANCE:AXSUSDT
📈 Spot Trade: BUY AXS
⚠️ SL: -
🏅 TP: - In Image
⏳ Time aprox: 7~10 dias
💂🏻If you agree this Trade hit the like button.
💂🏻Si estas de acuerdo deja tu like.
