Decentraland is coming to a vital demand zone!!! MANA!Decentraland - On the weekly chart we have a confirmed trend to the downside. Making lower lows and lower highs.
On the daily chart we are trending up making higher highs and high lowers. We have a liquidity void @ $3.66 that needs to be filled. We have a little demand zone that price action could react at the $2.60 region to push up. If this fails and we go $2.43 we are going to the downside. I expect a push up start of the week next week to fill the void above. However this could just be a liquidity grab to the downside.
If we can break above $4.oo the bulls have gained control on the higher time frame.
Most alts are coming to a vital demand zones that need hold or more downside is coming. The next week is going to be a vital candle in the direction we are going.
Metaverse

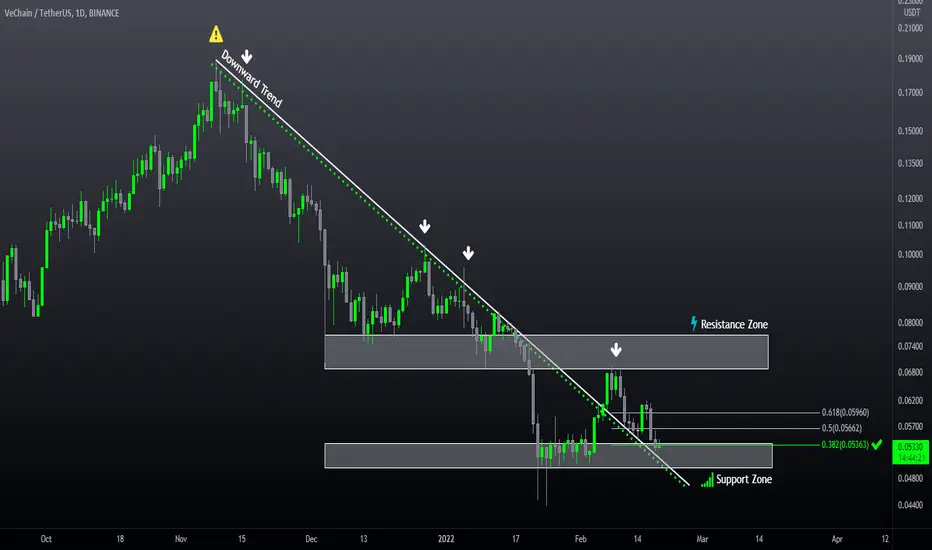
VECHAIN DAILY ANALYSIS🟢 #VET has broken the bearish trend line and is maintaining this range and re-testing the trend line. Price has reacted positively to the 0.382 Fibonacci level and is expected to be moving towards the resistance shown in the chart. Otherwise, the process will fall to the support level and it will be decided again to continue the process. Use the appropriate loss limit for your trades, which has a very high possibility of emotional movement in the market.
⚠ This Analysis will be updated.
🟢Amir Hossein
📅 02.19.2022
⚠️ (DYOR)
SENSO: $0.80 cents | Your 100x Experience in the Metaverseunder rate under the radar
yet leading Players in the Gaming Meta Space is on board
put on a trade and treat it like a Time Deposit
in a Dormand Broker (dormant account)

GALAUSDT 🐋 Clean ChartGALAUSDT 1D
There are endless things beyond what we can see.. 🧿
Chart based on Volume Profile and VWAP :
Value Area : Yellow
High volume node : Red
Entry prices : Green
Follow me on Tradingview if you don't want to miss my next analysis.
Going so far then I'm going so far.. ⏱

Sand OutlookSand chart is simple. As long as it is in this descending trendline, it will not go up. It is also way lower than LSMA crossover 4H! In order to exit from this descending trendline, it should first break this trendline and then stay ahead of LSMA crossover line. Good lock.

Zooming in on MANABTC is behaving, bullishly bouncing off its support, poised to break $45k with resistance around $45,150 area. Sometimes after MANA rallies, it takes a break and the other tokens take a turn. I was concerned about yesterday's rally being shorted after Samsung's V-day novelty wore off, but thanks to JP Morgan stepping into Decentraland, MANA is following its path to the next levels. I zoomed in on the 1hr to illustrate where MANA is at and where it will have minor resistances on its way up to the next targets. This is not financial advice. MANA does need to break $3.41 or risk creating a short-term H&S. An hour ago, I was keeping an eye on the $3.16 level. Should MANA drop below this support, a drop to $2.97 is likely. Don't get me wrong, I believe MANA will hit $2.97 in the future, BUT I think it will hit $3.88, $4.34, maybe $5.10 first. Again, not financial advice...but yes, MANA is following all the fundamentals.

A Tour of JP Morgan's Onyx Lounge in DecentralandA quick look at the new Onyx Lounge by JP Morgan in Decentraland (MANA) and where the existing economic activities in the metaverse are. (It might not be what you think.)

AXS cup & handle targets to 82 for first TPAXS cup & handle targets to 82 for first TP AXS cup & handle targets to 82 for first TP AXS cup & handle targets to 82 for first TP
@micdot7

Very oversold right nowRemember that facebook is run by mark zuckerberg, he's an alien lizard with superhuman iq. This in itself is bullish.
FB will have to reinvent itself, we will have to see if the metaverse is a success. But this stock is very cheap now and sentiment on all time low. Feel like this might bounce again.

MANA: WILL METAVERSE TAKE THE MARKET BY STORM?Some points to mention regarding the chart:
1. The significant role of MA21.
2. The steady and consistent volume, albeit at lower levels compared to the previous bull rally.
3. The 2.5 - 3.5. is of great significance considering the price history in this region. The manner of breakout is consequential.

$FB Key Levels Analysis & targets - Deep targets$FB Key Levels Analysis & targets - Target 1& 2 hit
Target 3 & 4 are on deck
——————
I am not your financial advisor, but I will happily answer questions and analyze to the best of my ability but ultimately the risk is on you. Check out my ideas, but also do your own due diligence.
I have a huge tolerance for volatility so please know that. If you’re new to my trade setups please try them on a small scale first. Then go in with a risk you’re comfortable with.
I am not a bull. I am not a bear. I just see what I see in the charts and I don’t pay too much attention to the noise in the news.
If you want me to analyze any stock or ETF just leave me a comment and I’ll do it if I can. (If I have time)
And most importantly… Have fun, y’all!!
(\_/)
( •_•)
/ >🚀

Facebook - METANice day to everybody,
I am preparing to entry.
Meta had quite strong, maybe panic reaction, after earning.
The reaction was really strong.
Now is gap between 320-250USD. This gap should be filled in the furute.
I am not entering now, but preparing for taking the position. I would like to see some accumulation around 200USD or a little bit less.
Whole stocks market is tricky and I would like to be more sure before entry.
Tip: you can see how gap works. It's like magnet, previsou gap was between 230-250 and now is filled.

Facebook: META - FB' Future / Prediction Meta Platforms, Inc., doing business as Meta and formerly known as Facebook, Inc
is facing a bit of a challenge as of late but will soon grow some wings...
it should turn from 294.61 & go up from there but if break below 2920? then it will kiss 245.94 (worst case)
*The curves

I am 250% Bullish......and patient. The chart really hasn't changed. Mana bounced off of the lower trend line (BLUE). Months ago, I started illustrating MANA's progression through Cup and Handle patterns, one leading into another, acknowledging the function of time as an unknown. Time is on our side, as the patterns play out, the deeper the head, the higher the target. Same concept is illustrated today using micro and macro Inverse Head and Shoulder patterns as projected through resistances and their relationship to the Fib .5.
Although this is the daily chart to show the big picture, zoomed in on the 2hr, MANA is currently completing an Inverse H&S (ORANGE) with a target in the $3.33 range. This will leave MANA in last week's position, needing to close above last week's high of $3.55, hopefully with more strength from the recent drop. This would lead to $3.64 and then the $3.80 area, completing another Inverse H&S (GREEN) with a target around the ATH. From the ATH, MANA would complete the macro Inverse H&S (PURPLE) with a target of around $10. There is no data above the ATH and MANA may see the same parabolic pump, (1/2 around 250% from current price, but 500% higher than the Fib. low @ $1.71). Just as what goes up always comes down, that which comes down, will again go up. The industry is growing (just beginning), not shrinking. These are just my ideas and not financial advice. I do not recommend using this chart as a function of time...I truncated it to fit in the screen. I am not expecting anything below $2. What happens after $10? Depending upon when THAT happens, probably a drop to $4.90 in early October or $5.90 at the end of December...not crazy talk, just when the lower support that now sits around $2 would hit projected Fib. retracements after $10...so who knows?
Link to 2hr time frame:

#bitcoin updateIf bitcoin 1 week chart candle closes like this today... Short with your lives. Not a financial advice, I'm just sharing my thoughts.

SLP smooth love potion 3 day chart finally getting legsSMOOTH LOVE POTION (SLP)
3 day chart...its gaining some legs
as well as some nice volume...lets keep
an eye on this AxieInfinity little bother
token.... prices and resistance listed,

ENJIN COIN DAILY ANALYSIS ENJUSDT (ENJIN COIN )
💹 Time Frame: Daily (Update)
➖➖➖➖➖➖➖➖
🟢ENJ took a strong rejection from the major resistance zone around $2.16 - $2.25. Also, there's a supporting uptrend line, which can act as a support in the future. Around, $1.43 - $1.50 is the next
support area where you can look for buying opportunities. Let's see what is going to happen in next coming days?
🟢 This Analysis will be Updated
Amir Hossein
📅 02.12.2022
⚠️ (DYOR)

TLM double bottom detected?This is my prediction. TLM is still moving at the bottom and try to going up. I think this is a cool pattern. It's not a short time for TLM to moving up, but I believe it's a really beautifull pattern. I still hold my TLM because I believe in this game project. This game has the highest number of players compared to other games including "AXIE INFINITY" with more than 1 million players (check this -> dappradar.com ). This is just an analysis, please think again and use your own analysis before buying TLM. How about your prediction? Please comment below and let's share information. Cheers
Nb : $0.8571 is fibb 1.618

SAND DAILY ANALYSIS📊 SANDUSDT (SANDBOX)
💹 Time Frame: Daily
➖➖➖➖➖➖➖➖
🟡SAND is trying to break the Downward trend for the third time but rejected. Let's see which direction is going to break? Up or Down?
🟡 This Analysis Will be updated.
Amir Hossein
📅 02.12.2022
⚠️ (DYOR)

#LOOKS Rare "Has the euphoria worn off? FEB tough month#LOOKS Rare "Has the euphoria worn off? FEB tough month!
The ongoing competition between #opensea and #looksrare may be waning. Recent market activity details 7-day transaction levels at the $800.0M +/- range with #opensea boasting 195,000 users vs. #looksrare 8,920. Volume levels may be indicative of ongoing interest in rewards base trades.

Mana long$MANA has broken the resistance level and now turned it into a support buy bouncing off the level for two times. Bullish movement to next resistance level at 3,93 is possible to happen next.


Beautiful double top on 4hours BTC chart.I'm expecting a lot of selling pressure to possible start from around here.
