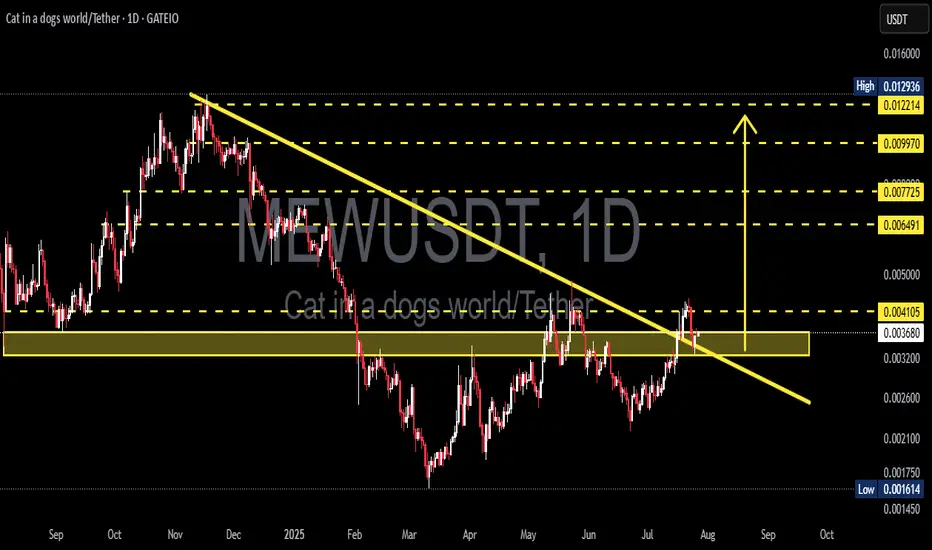
MEWUSDT Breakout! Rounded Bottom Reversal and Key Retest Zone!MEWUSDT has officially broken out of a long-term descending trendline that has capped price action since December 2024. The formation of a Rounded Bottom (Cup) suggests a strong accumulation phase and potential for trend reversal. The current retest of the breakout zone will be crucial in determining the next big move!
---
🔍 Technical Analysis Details:
1. Chart Pattern: A clear Rounded Bottom (Cup) pattern has formed, often signaling a bullish reversal. Price has broken through the descending trendline, and is now retesting the breakout zone (highlighted in yellow), which previously acted as resistance and is now turning into key support.
2. Resistance Levels (Upside Targets):
⚡ 0.004105 – First breakout point
🟡 0.006491 – Mid-level resistance
🟡 0.007725 – Previous local high
🟡 0.009970 – Strong resistance zone
🔵 0.012214 – Psychological resistance
🔵 0.012936 – Major swing high
3. Key Support Levels:
🟡 0.003200 – Current demand zone (yellow box)
🔵 0.001614 – Historical bottom
---
✅ Bullish Scenario:
If MEWUSDT holds above the 0.0032–0.0041 support zone and confirms it as a new base:
🎯 Target 1: 0.00649
🎯 Target 2: 0.0077
🎯 Higher targets: 0.0099 up to 0.0129 This breakout may be the start of a strong bullish rally, especially if accompanied by increasing volume.
---
⚠️ Bearish Scenario:
If price fails to hold the breakout zone and falls back below the trendline:
Price may revisit 0.0026 – 0.0020 support
Further weakness could push it back to the 0.001614 historical low
---
🧠 Conclusion:
MEWUSDT is showing early signs of a bullish reversal after breaking out of a long-term descending trendline and forming a rounded bottom pattern. The current retest zone is critical — holding this level could confirm the start of a bullish trend with multiple upside targets.
#MEWUSDT #CryptoBreakout #TechnicalAnalysis #Altcoins #MemeCoin #CryptoTrading #BullishSetup #RoundedBottom #TrendReversal #SupportAndResistance
MEWUSDT
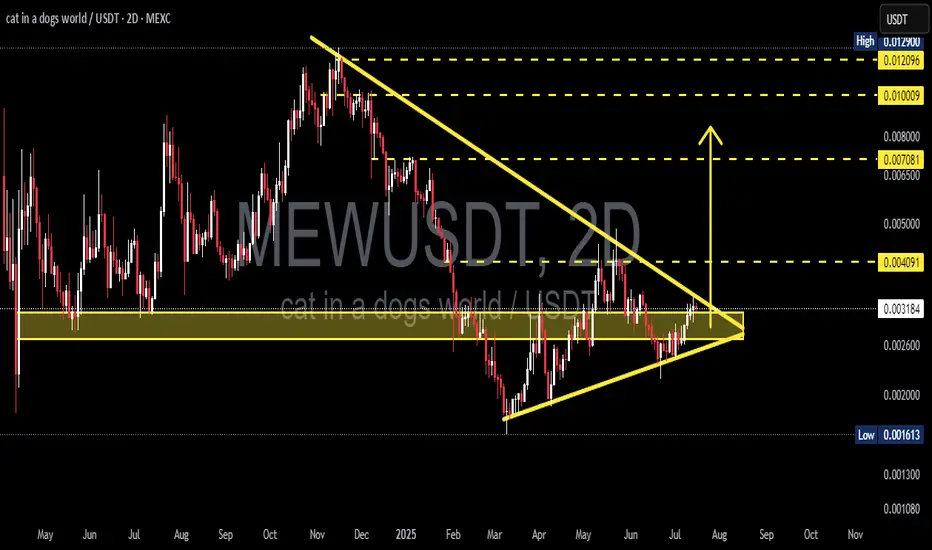
MEW/USDT Ready to Explode? Major Breakout from Symmetrical!After weeks of tight consolidation, MEW/USDT is showing signs of a major breakout from a well-formed Symmetrical Triangle pattern on the 2D time frame. This could mark the beginning of a powerful expansion phase if confirmed by volume and price action.
🔍 Pattern Analysis & Technical Structure
Main pattern: Symmetrical Triangle – a classic formation characterized by lower highs and higher lows, indicating a battle between buyers and sellers before a major move.
MEW has now broken through the triangle’s descending resistance line, signaling that buyers may be taking control.
The breakout occurred near the apex of the triangle, which often leads to explosive moves.
🟢 Bullish Scenario: Multi-Stage Upside Potential
If the breakout holds and gains confirmation (via volume or a successful retest), the next potential price targets are:
1. Initial Target: 0.0049 – nearest horizontal resistance and previous reaction level.
2. Mid Target: 0.0070 – measured move based on the height of the triangle from base to breakout.
3. Major Target Zone: 0.0090 – 0.0130 – previous distribution zone and high-confluence resistance.
📈 Upside potential exceeds +300% from current price if all bullish targets are hit!
🧠 Note: Symmetrical triangle breakouts are known to result in strong momentum-driven rallies, especially if supported by a rise in volume and broader market sentiment.
🔴 Bearish Scenario: Watch for Fakeout Risk
Despite the breakout, there’s always a risk of a false move:
If MEW fails to hold above the 0.0032 breakout zone and falls back inside the triangle, it may signal a bull trap.
A breakdown below the ascending support line could open the door for deeper downside:
Support Level 1: 0.0025 – recent accumulation base.
Support Level 2: 0.0016 – major low and strong demand zone.
Losing these levels would invalidate the current bullish setup.
⚙️ Key Confirmation Signals:
Volume: A breakout with strong volume = high conviction. Low volume = higher fakeout risk.
Successful Retest: A bounce from the breakout zone confirms strength and may provide a solid long entry.
Macro Sentiment: Watch Bitcoin dominance and market mood to confirm sustainability.
📊 Quick Technical Summary:
Pattern: Symmetrical Triangle
Breakout Level: 0.0032
Short-Term Trend: Bullish
Mid-Term Outlook: Neutral → Turning Bullish (if confirmed)
Key Resistance Levels: 0.0049 – 0.0070 – 0.0090 – 0.0129
Key Support Levels: 0.0025 – 0.0016
💬 Final Thoughts:
MEW/USDT is at a make-or-break moment. A validated breakout from this triangle could kick off a massive uptrend. But as always, stay alert to false breakouts — proper risk management is essential.
📌 Don’t just chase the breakout — watch the retest, volume, and broader context.
#MEWUSDT #MEWBreakout #SymmetricalTriangle #CryptoBreakout #AltcoinSetup #TechnicalAnalysis #TradingView #CryptoChart #BullishPattern #BreakoutAlert
MEW Main Trend. Memcoin. 2025 07 02Logarithm. Time frame 3 days.
Cat in a dogs world (MEW)
X -133 thousand subscribers (this is not enough).
Reduction from the maximum -87%. For such assets, this is not enough.
I imposed a descending channel on the chart (current descending trend of the main trend), and a horizontal one, if by some miracle this local Ross hook is broken upwards (not forming a local head and shoulders), not only to the resistance of the secondary trend (red line), but to break through it. Percentages to key zones of support/resistance levels are shown for clarity.
After the downward trend is broken, such "psychological-fundamental" assets are usually pumped up by +800-1000% from the minimums or more. Low liquidity, and the contingent of people who subscribe to these projects, allows this to be done easily at the right time: "the hamster is not scared". After pumping — a slow death, with pumps an order of magnitude smaller. Therefore, do not forget to sell in the alt season.
When working with such cryptocurrencies by liquidity, observe money management, use partial entry or on a breakout. Do not use margin leverage, as there may be snot in any direction for a large percentage, which will lead to liquidation "out of the blue".

MEW Sell/Short Setup (4H)We have a supply zone from which a strong drop has previously formed. This zone has been tested once already, but with only minimal penetration. Given this shallow penetration and the price’s inability to make a lower low, we are once again expecting a potential short position from this zone.
We’re looking for a short position because the larger market structure is bearish.
If the price reaches the supply area, we’ll be looking to enter a position. We expect the liquidity pool below the chart to be swept, leading price to hit our targets.
However, if a daily candle closes above the invalidation level, this outlook will no longer be valid.
Do not enter the position without capital management and stop setting
Comment if you have any questions
thank you

#MEWUSDT - Recovered after the sell-off, is the drop coming? Hey folks! 🚀
Today, we’re diving into the analysis of a highly volatile coin. Our special guest for the day: #MEWUSDT.P! 🔥
Looking at the #MEWUSDT chart, we saw a sharp pullback from $0.00300 after facing strong selling pressure, dropping all the way down to $0.0026. Right now, it's making a correction before what looks like another potential drop. 📉⚡
I'm eyeing an entry around $0.0028, but knowing how the market loves to hunt stops, I've also placed sell orders at $0.0030 and $0.0031—just in case. Gotta stay one step ahead, right? 🎯🔥 (Let’s not even get into the stop hunting madness! 😅)
Kept the chart clean and simple, with clear targets marked. Let’s hope this trade turns out nice and green! 💰🚀
P.S: Friends, just a quick reminder; please don’t focus too much on the stop loss value in my analysis. It’s just there to show that I entered a short position. 😊 Those who know, know, but let’s remind those who are seeing it for the first time!
Drop your thoughts in the comments, let’s discuss! 🔍⚡
Manage your risk, stay in the game! 🎯🔥
#AlyAnaliz #TradeSmart #CryptoVision #Binanciega #MEWUSDT

cat in a dogs world #MEW price analysis🍿 Despite all the "trash" that has been happening on the crypto market lately and will continue at least today, someone decided to try their luck or has a clearly calculated plan!?)
1️⃣ Trading volumes of OKX:MEWUSDT are growing smoothly but steadily and now the price is at a critical point, so buying is dangerous.
2️⃣ But it is most likely worthwhile to “take a pencil” and monitor the future behavior of the $MEW price.
3️⃣ If the #MEW price manages to stay above $0.0030-0.0031 in the next few days, you can try buying with a growth prospect of x2 to 0.0056-0.0058.
_____________________
Did you like our analysis? Leave a comment, like, and follow to get more

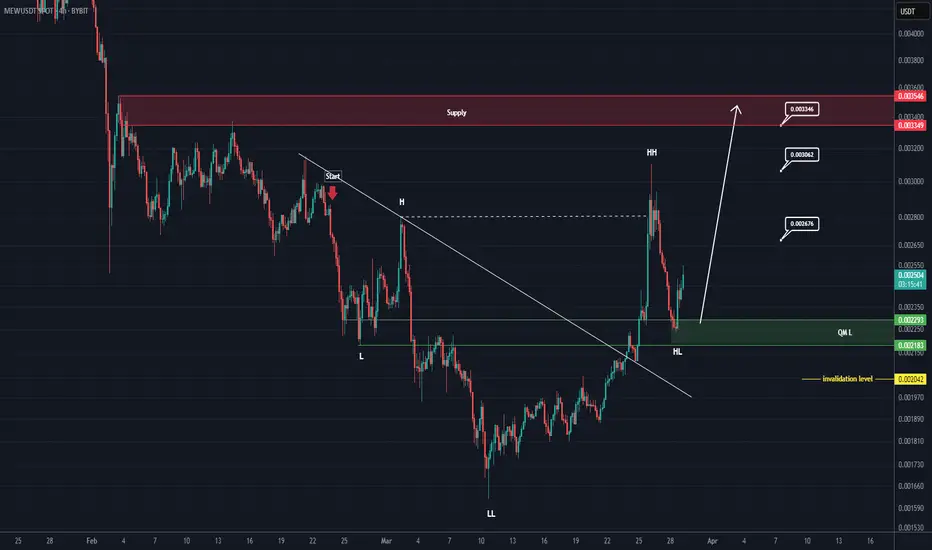
MEW Looks Bullish (4H)From the point where we marked start on the chart, MEW appears to be forming a bullish QM.
As long as the green zone holds, it can move toward the targets.
A 4-hour candle closing below the invalidation level will invalidate this pattern.
For risk management, please don't forget stop loss and capital management
When we reach the first target, save some profit and then change the stop to entry
Comment if you have any questions
Thank You
MEWUSDT Approaching a Breakout!MEWUSDT Technical analysis update
-MEWUSDT is trading within a pennant pattern on the daily chart.
-The price is currently above the 100 and 200 EMA.
-A bullish crossover between the 100 and 200 EMA could occur soon.
-There has been a notable increase in trading volume in recent days.
-The price is approaching a key resistance level on the volume profile and may break out soon.

Trading Idea for MEW: Potential LongThe MEW coin has been under pressure for a long time and has been testing buyer zones. A potential long entry may be forming at current levels. The possibility of upward movement remains, but it is crucial to manage risks and avoid excessive leverage. Monitor price action and confirmation signals.
Recommendations:
• Entry: Upon confirmation of demand at support levels
• Stop-loss: Below local lows
• Targets: Nearest resistance levels
Protect your capital and manage your risks!

After Bouncing From Support Point $MEW is Gearing for A Breakoutcat in a dogs world token ($MEW) launched Mar 2024 brought all the attention to the cat coin sector and was the driving force that kickstarted what crypto-natives call “cat season” as it crossed $900M+ market cap within days of its debut.
Built on the Solana ecosystem, $MEW has bounced from the psychological support point cooling it off, now gearing up for a bullish reversal move with a breakout above the 78.6% Fibonacci retracement point serving as temporary hurdle needed to jump by to achieve this stint.
With the Relative Strength Index (RSI) at 66, this gives more credence to our bullish thesis on $MEW coin. Further solidifying our stance on $MEW bullish breakout is the falling wedge pattern that has occurred starting December last that has since seen the token loose about 83% of market value.
cat in a dogs world Price Live Data
The live cat in a dogs world price today is $0.002665 USD with a 24-hour trading volume of $298,503,903 USD. Cat in a dogs world is down 2.18% in the last 24 hours, with a live market cap of $236,919,397 USD. It has a circulating supply of 88,888,888,888 MEW coins and a max. supply of 88,888,888,888 MEW coins.

MEW buy/long setup (8H)It seems we have a diametric pattern on the chart, with its wave F currently completing.
The green zone is a high-potential area for a MEW, which could propel the price upward.
The target could be the red box.
Closing a daily candle below the invalidation level will invalidate this analysis.
For risk management, please don't forget stop loss and capital management
Comment if you have any questions
Thank You

Falling Wedge Breakout: Is MEW/USDT Ready to Surge?The chart analysis for MEW/USDT on the daily timeframe (1D) reveals a compelling narrative for potential bullish movement, underpinned by a falling wedge pattern breakout and subsequent confirmation of support levels. Each candle on the chart represents a day's worth of price action, capturing a longer-term trend that appears poised for upward momentum.
Technical Analysis of MEW/USDT
Before the formation of the current triangle pattern, MEW was in a clear uptrend, indicating a bullish market bias. This was followed by a consolidation phase, culminating in the development of a falling wedge pattern—a classic bullish indicator. The breakout from this pattern, marked explicitly on the chart as a "Downtrend break and re-testing" point, is a strong signal of a potential price rally. The price has successfully retested the broken resistance line, which now serves as a new support, bolstering the bullish case.
A rectangle box on the chart highlights the anticipated target zone, emphasizing a defined price objective for traders watching this breakout. Below this, a purple-shaded area marks a historical support/resistance zone, a key level that has been tested multiple times, further reinforcing its significance in determining price action.
The combination of these technical signals—breakout, retest, and historical support zones—paints a bullish outlook for MEW/USDT. The broader uptrend that preceded the consolidation phase strengthens the likelihood of this pattern playing out to its projected target.
Understanding MEW Meme Coin
MEW, or "Cat in a Dogs World," is a Solana-based meme coin gaining attention in the cryptocurrency space. Its playful branding and community-driven nature align with the characteristics of other meme coins. However, as with many assets in this category, its value is largely speculative and driven by factors like social media trends, community engagement, and overall market sentiment.
As a meme coin, MEW presents high volatility, with the potential for sharp price swings in either direction. Built on Solana’s blockchain, it benefits from the platform's speed and scalability, making it more robust compared to meme coins on slower networks. However, as an emerging asset, MEW’s long-term value and viability remain uncertain, and investors should approach it with caution.
Conclusion
The technical setup for MEW/USDT suggests a bullish continuation, supported by the falling wedge breakout, retest, and historical support zones. However, as a meme coin, MEW's performance is highly influenced by market sentiment and speculative interest. While the chart presents a compelling case for upside movement, investors must weigh the high volatility and speculative nature of meme coins against their risk tolerance. As with all investments, combining technical analysis with fundamental research is crucial when evaluating opportunities in the cryptocurrency market.
Disclaimer: This is not a financial advise. This analysis is purely for informational purposes and should not be considered as investment advice. Trading involves risk, and you should consult with a financial professional before making any decisions.

**MEW: New Monthly Trend — Long to April 2025**New monthly trend active on MEW—had to create another post for this beauty!
Prepare to possibly see $0.08 before April 2025.
Follow this post as well!

Trade Details for MEW/USDT (1-Hour Timeframe)Trade Details for MEW/USDT (1-Hour Timeframe)
Entry Price: $0.006969
Stop Loss: $0.006893
Target Price: $0.007201
Risk-Reward Calculation:
Risk: $0.000076
Reward: $0.000232
Risk-Reward Ratio: 1:3.05
This setup offers a favorable risk-reward ratio, with a potential reward more than three times the risk.

MEW ANALYSIS (1D)It looks like we have a big diametric on the daily time that we are now at the end of wave E.
As you know, MEW is a highly volatile symbol and it can easily reverse the bullish wave it created, so control the risk.
Get trigger and approval for your trades.
The best range to sell is the red range.
Closing a daily candle above the invalidation level will violate this analysis.
For risk management, please don't forget stop loss and capital management
Comment if you have any questions
Thank You

LONG signal MEWUSDT Max Profit
15m TF. $BINANCE:MEWUSDT is forming an ascending triangle on a small timeframe, signaling the potential for an upward breakout. The current price is 0.009481 USDT, and the price is approaching the resistance level at 0.009505 USDT.
Volumes are starting to increase near the resistance, confirming buyer activity. Indicators show growing bullish momentum, with support at 0.009200 USDT protecting the current structure.
🔑 Technical Context
The ascending triangle formation suggests a breakout above 0.009505 USDT.
Rising volumes near the resistance confirm buyer interest.
The nearest support level at 0.009200 USDT mitigates the risk of corrections.
🚩 Trading Strategy
Entry Point:
Consider opening a long position on a confirmed breakout above 0.009505 USDT.
Stop-Loss:
Place a stop-loss below 0.009200 USDT to limit potential losses.
Take-Profit Targets:
0.009700 USDT – the first target for partial profit-taking.
0.009850 USDT – the main target within the ascending trend.
0.010000 USDT – the maximum target based on the breakout projection.
📈 Recommendations
Volume Analysis: Monitor for continued volume growth during the breakout.
Entry Timing: Wait for a confident close above 0.009505 USDT.
Trend Confirmation: Use 5m and 15m timeframes to confirm the continuation of the bullish move.
Conclusion
$BINANCE:MEWUSDT shows strong potential for an upward breakout. Careful monitoring of volumes and resistance levels provides an opportunity to capitalize on the current market setup.

Mew/UsdtBYBIT:MEWUSDT
### **Current Price & Market Cap**
- **Current Price**: $0.009406
- **Market Cap**: $836.30 million
At its current market cap of **$836.30M**, **MEW** is very close to touching a $1 billion market cap, which is a significant psychological milestone in the crypto world. 🚀 Achieving this could potentially trigger more attention from investors and push the price higher. This suggests that the structure of **MEW** is looking quite strong, and if the price holds at current levels, it could be a good sign for future growth. 📈
---
### **Resistance Level: $0.012916**
- **Resistance** is the price level at which selling pressure is likely to increase, making it harder for the price to break through.
- If **MEW** can hold or break above **$0.012916**, it suggests bullish momentum. This level represents a point where price action has previously struggled to move beyond, so a successful breakout could mean further upside potential.
- If **MEW** manages to break this resistance level, the next targets could be higher, perhaps even driving the price towards new highs, especially if the market cap approaches $1B. 💥
---
### **Support Levels: $0.007979 / $0.00600**
- **Support** refers to a price level where demand is expected to be strong enough to prevent the price from falling further. If the price drops to one of these levels, buying pressure could step in, creating a potential bounce.
- **Support Levels**:
- **$0.007979** is a key level of support. If the price dips below current levels but finds buyers here, it could stabilize and start moving up again.
- **$0.00600** is another crucial support range. If the price doesn't hold at **$0.007979**, this next level provides additional support before potentially falling further.
These support levels represent areas where the price could "bounce" if there’s enough demand to prevent further declines. If **MEW** holds around or above these levels, it could indicate a stronger foundation for future gains.
---
### **Conclusion:**
- **Bullish Scenario**: If the price holds above **$0.009406** and breaks through the **$0.012916 resistance**, we could see **MEW** targeting new highs, possibly pushing closer to a ** SEED_TVCODER77_ETHBTCDATA:1B market cap**. This could trigger increased investor interest and lead to more upside momentum.
- **Bearish Scenario**: If the price fails to hold at **$0.009406**, look out for possible support around **$0.007979** or **$0.00600**. A breakdown below these levels could lead to further downward pressure and may require a new support level to be formed.
---
As always, it's essential to keep an eye on price action and volume at these levels. Volatility is common in crypto, so it’s important to stay informed and make decisions based on your own risk tolerance.
**Disclaimer**: This is not financial advice. Always do your own research (DYOR) before making investment decisions. 📚🔍

$MEW meme coin analysis Hi 👋🏻 it's me your " Raj_crypt0 " ........ ✍🏻
I am going analysis #meme sector coin OKX:MEWUSDT ..... ✍🏻 #DYOR #NFA
nothing to explain in meme coins , it's just gambling coins in my opinion
My accumulation / BUY - $0.011 below
🎯 $0.0375 ( principle trade )
🎯 $0.1951
Stop 🛑 $0.004 below ....... Follow article for future updates 🤠

MEWUSDT Bearish Wedge!MEWUSDT TEchnical analysis update
MEWUSDT has formed an ascending broadening wedge pattern at the peak, indicating potential bearish momentum. The price breakdown has been confirmed on the 4H chart, and a retest of the breakdown level has been completed, reinforcing the bearish outlook. The price is now moving steadily toward the lower levels of the pattern, suggesting further downside potential if selling pressure continues.
Regards
Hexa

Cat in a dogs world MEW price is pleasantly surprisingIt seems that MM algorithms are still comfortable trading #memecoins and their capital is there. The price moves very clearly from level to level, for example $MEW 👇
The preliminary impulse from our purchase zone in a very short time gave a +150% price movement OKX:MEMEUSDT
Of course, now the price of this #SolanaMemeCoin is “a little bit high”, but you can try your luck and pick up a long in the range of $0.0063-0.0075.
What do you think, will it be possible to take away +100-130% of the price movement?
Yes 👍 No 👎

MEW: Solana-Based Meme Coin Soars 14% on Major Exchange ListingsIn the competitive world of meme coins, Cat in a Dog’s World ($MEW) has emerged as a key player after securing a significant listing on the South Korean crypto exchange Upbit. Following in the footsteps of Dogecoin (DOGE) and Shiba Inu (SHIB), MEW's inclusion in the KRW market has catapulted its price by 14%, positioning the coin for continued upward momentum.
Upbit’s announcement of the MEW/KRW trading pair comes as a major development, giving the Solana-based token exposure to a broader market. With Upbit being a major player in the Asian crypto space, the listing brings MEW closer to mainstream adoption, sparking bullish sentiment in the market.
MEW's Growing Influence
The recent listing on Upbit is a significant milestone for $MEW, marking it as the third meme coin to achieve this feat after Dogecoin and Shiba Inu. The decision to peg MEW to the Korean Won (KRW) is crucial as it opens the token to a massive audience of South Korean traders and investors. This development follows the earlier listing of MEW in BTC and USDT markets, further extending its market reach.
In addition to Upbit, Kraken also listed $MEW on October 8th, 2024, sparking further price rallies and pushing the token to its recent ATH. These exchange listings are a testament to the growing interest in the Solana-based meme coin, positioning it as a token to watch in the coming months.
With $MEW gaining significant trading volume (up 370%) and a remarkable 14% price jump following the Upbit listing, it’s clear that the token is benefiting from increased market visibility and investor confidence. MEW’s total futures open interest (OI) is also up 16%, adding to the optimism surrounding its bullish trajectory.
Technical Outlook: MEW Primed for Further Gains
From a technical perspective, $MEW shows signs of continued bullish momentum. As of the time of writing, $MEW is up 4.51%, trading at $0.009561 after breaking through a former resistance point. This price action comes on the heels of the Upbit listing, positioning $MEW to revisit previous highs and potentially reach new all-time highs (ATH).
The Relative Strength Index (RSI) sits at 62.67, indicating bullish conditions without being overbought. This positioning primes MEW for an upward move towards its pivot point of $0.01, a psychological level that could open the floodgates to further price rallies. Should MEW surpass this point, it could enter a new bullish cycle with increased price discovery.
In the event of a retracement, MEW has solid support at $0.008, a former resistance level that could provide a strong foundation for future growth. This combination of bullish indicators and fundamental catalysts makes MEW a token with high potential in the meme coin space.
Conclusion: MEW’s Road to the Top
MEW's recent listings on Upbit and Kraken have sparked a new wave of optimism, pushing the Solana-based meme coin into the spotlight. With technical indicators supporting a bullish case and increased trading volume confirming investor interest, $MEW is positioned for continued gains. As it approaches its pivotal $0.01 level, all eyes are on $MEW as it looks to break into new highs.

#MEW/USDT#MEW
The price is moving in a descending channel on the 1-hour frame and is sticking to it well
We have a bounce from the lower limit of the descending channel and we are now touching this support at a price of 0.007820
We have a downtrend on the RSI indicator that is about to be broken, which supports the rise
We have a trend to stabilize above the moving average 100
Entry price 0.008400
First target 0.009337
Second target 0.009965
Third target 0.010845

MEWUSDT Long Setup / Are you a cat person or a dog personOKX:MEWUSDT
BYBIT:MEWUSDT
BINANCE:MEWUSDT.P
📈Which side you pick?
Bull or Bear
SL1 ---> Low-risk status: 3x-4x Leverage
SL2 ---> Mid-risk status: 5x-8x Leverage
(If there is just one SL on the chart, I suggest, low risk status)
👾Note: The setup is active but expect the uncertain phase as well.
➡️Entry Area:
Yellow zone
⚡️TP:
0.006912
0.007202
0.007492
0.007925
🔴SL:
0.005929
🧐The Alternate scenario:
If the price stabilize against the direction of the position, below or above the trigger zone, the setup will be canceled.
