Will MEXC hit $12 in this bull run?🚨 NYSE:MX (MEXC) Looks Ready to Explode 🚨
Since 2018, MX has been forming clean HH & HL on the HTF.
Now it's approaching another potential Higher High — and if this plays out…
👉 $12 is on the table.
Structure is king. Bullish momentum is real.
⚠️ Only invalidation? Below $0.77 (CHoCH zone).
So here’s the real question:
Will NYSE:MX hit $12 next… or break the entire bullish structure?
Drop your thoughts 👇
NFA & DYOR
Mexc

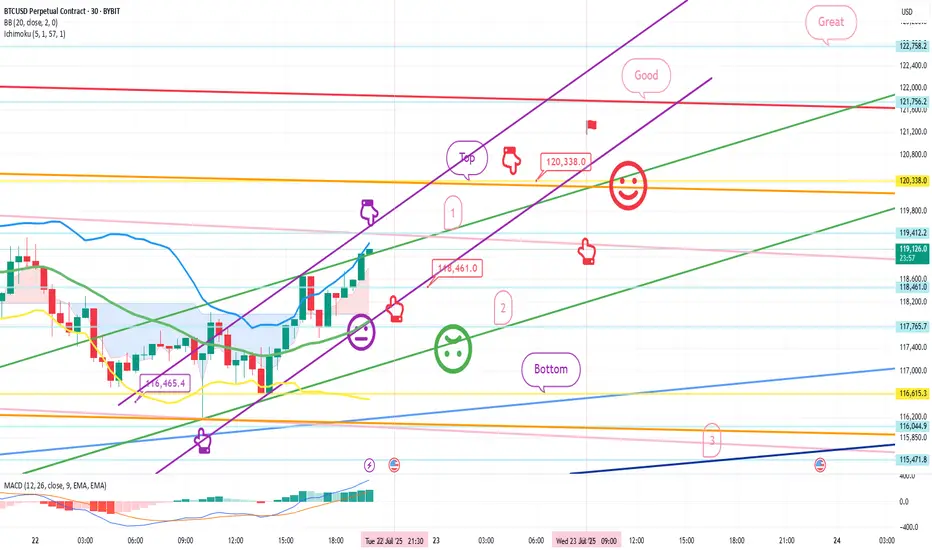
July 22 Bitcoin Bybit chart analysisHello
It's a Bitcoin Guide.
If you "follow"
You can receive real-time movement paths and comment notifications on major sections.
If my analysis was helpful,
Please click the booster button at the bottom.
This is Bitcoin's 30-minute chart.
Nasdaq indicators will be released at 9:30 in a little while.
Although Bitcoin's mid-term pattern is broken,
it looks like a strong upward trend based on signals and candlestick positions.
In the case of Nasdaq, the 6-hour and 12-hour charts MACD dead cross is in progress,
and even if there is no plunge and only a sideways movement,
it seems likely that today's strategy will be successful.
In the bottom left, from the analysis article on the 18th,
the final long position entry point of $116,465.4 Bottom
is connected as is.
*Red finger movement path
One-way long position strategy
1. $118,461.9 long position entry section / green support line breakout, stop loss price
2. $120,338 long position 1st target -> Good, Great in order of target price
See the 1st section at the top as a touch section for an upward wave rather than a short position entry,
and if this section breaks through right away, an upward trend can be connected.
If the purple parallel line support line is maintained without breaking away,
there is a possibility of a vertical rise.
If the top section is touched,
after the first liquidation,
it would be good to use the 1st section to re-enter a long position.
The 2nd section at the bottom is important,
and if it is pushed to this section according to the movement of Nasdaq today,
it can fall strongly.
Please check the real-time support line shape.
From the breakout, Bottom -> 3 sections are open.
If you touch the 3rd section after tomorrow, the mid-term pattern will be restored.
This is the 12+ day section.
Up to this point, I ask that you simply use my analysis for reference and use only.
I hope that you will operate safely with the principle of trading and stop loss.
Thank you.
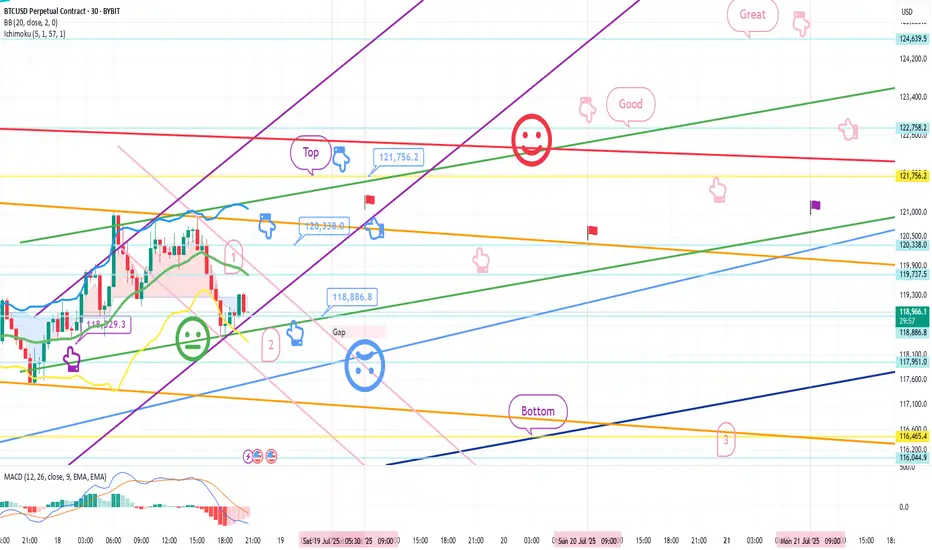
July 18 Bitcoin Bybit chart analysisHello
It's a Bitcoin Guide.
If you "follow"
You can receive real-time movement paths and comment notifications on major sections.
If my analysis was helpful,
Please click the booster button at the bottom.
Bitcoin 30-minute chart.
There is no Nasdaq indicator announcement today.
The mid-term pattern was broken in the morning wave,
but I proceeded as safely as possible.
At the bottom left, I connected the final long position switching section in the analysis article on the 15th with a purple finger.
*When the blue finger moves,
Bidirectional neutral
Short->Long or long waiting strategy
1. Short position entry section of $120,338 / Stop loss price when orange resistance line is broken
2. Long position switching of $118,886.8 / Stop loss price when blue support line is broken
3. Long position 1st target of $121,756.2 -> Target price in the order of Good and Great
If it falls immediately from the current position or
touches the top once and falls, it is a vertical decline condition.
If it falls immediately, it is the final long waiting in section 2.
(When the sky blue support line breaks, the stop loss price is the same)
From the sky blue support line break, the 6+12 section is where the mid-term pattern is restored,
and it is roughly the bottom section.
If the strategy is successful, I have left a simulation with a pink finger on the right,
so please check the switching and profit-taking section,
and operate safely in each position, long, short, and no position, based on whether the purple support line breaks from the current position.
From the green support line break, the low point of today's daily candle is broken,
so it would not be good for a long position, right?
Up to this point, please use my analysis article only for reference and use,
and operate safely with principle trading and stop loss price.
Thank you.
July 14 Bitcoin Bybit chart analysisHello
It's a Bitcoin Guide.
If you "follow"
You can receive real-time movement paths and comment notifications on major sections.
If my analysis was helpful,
Please click the booster button at the bottom.
This is a Bitcoin 30-minute chart.
There is no separate Nasdaq indicator announcement.
Nasdaq upper gap reversal condition and
Bitcoin is moving sideways after a sharp rebound until the afternoon.
I created today's strategy based on the vertical decline condition based on the 5-minute trend reversal in Tether Dominance.
On the lower left, I connected the long position entry section of 117,451.1 dollars that I entered on the 11th.
* In the case of the red finger movement path,
This is a one-way long position
current position chase purchase strategy.
1. Chasing purchase at 121,897.1 dollars / Stop loss price when the green support line is broken
2. 124,639.5 dollars long position 1st target -> Good, Great in order of target price
Since I left a simulation in the middle,
I think it would be good to use it for re-entry after liquidating the long position.
The movement within the 1st section at the top and the 2nd section at the bottom
is an extreme sideways movement, and from a long position,
if it succeeds in rebounding within the 2nd section, it becomes a strong upward condition.
From the 3rd section breakout today,
the low point is broken in the newly created weekly and daily chart candles this week,
so please note that the upward trend may be delayed.
The next support line is the Gap8 section created last week.
Up to this point, I ask that you simply refer to and utilize my analysis
and I hope that you operate safely with principle trading and stop loss prices.
Thank you.

July 10 Bitcoin Bybit chart analysisHello
It's a Bitcoin Guide.
If you "follow"
You can receive real-time movement paths and comment notifications on major sections.
If my analysis was helpful,
Please click the booster button at the bottom.
Here is the Bitcoin 30-minute chart.
There will be a Nasdaq indicator announcement at 9:30 in a little while.
There is a high possibility that Nasdaq will shake up and down significantly,
but Bitcoin still looks safe in terms of signal and pattern.
In the analysis article on July 7,
I connected the strategy as it was at the last long position entry point of 107,484 dollars.
*When the red finger moves,
it is a one-way long position strategy.
1. 110,707.4 dollars long position entry point / stop loss price when the sky blue support line breaks
2. 111,783.3 dollars long position 1st target -> Top 2nd -> Good 3rd target price
The 1st section at the top is today's best short position entry point,
and the 2nd section at the bottom is a sideways market.
In the middle, with a pink finger,
I left a re-entry position after liquidating a long position, so
I think it would be good to use it.
From the breakout of the sky blue support line, it can be pushed to Bottom -> 109,116 dollars.
The report is not yet renewed,
but from now on, it will be very important, right?
This week, it seems like it will continue to shake up and down,
so I hope you operate safely with principle trading and stop loss prices.
Thank you.

July 7 Bitcoin Bybit chart analysisHello
This is Bitcoin Guide.
If you "follow"
You can receive real-time movement paths and comment notifications on major sections.
If my analysis was helpful,
Please click the booster button at the bottom.
Here is the Bitcoin 30-minute chart.
There is no separate Nasdaq indicator announcement today.
I think the Nasdaq lower gap section retracement will be the focus.
Recently, sideways movement or adjustments have been coming out before the trend,
So I proceeded safely in preparation for variables.
*When the blue finger moves
Bidirectional neutral
Short->long switching or 2nd section long waiting strategy
1. $109,380 short position entry section / cut-off price when orange resistance line is broken
2. $108,997.8 long position switching / cut-off price when purple support line is broken
3. $109,610.9 long position 1st target -> Top 2nd target -> Good 3rd target
It seems important whether the purple support line is broken from the current position. If the first section at the top touches 108,997.8 dollars and comes down,
it may become a vertical decline section.
If it comes down right away, it is a long-waiting strategy in the final second section,
and if it deviates from the bottom section today
(6+12 pattern)
because it is a full candle when the gap section is touched,
it may fall to 107,484 dollars indicated at the very bottom.
I have important work to do tomorrow,
so I will take a day off and come back on Wednesday.
Please use my analysis so far for reference and
I hope you operate safely with principle trading and stop loss prices.
Thank you.

July 4 Bitcoin Bybit chart analysisHello
This is Bitcoin Guide.
If you "follow"
You can receive real-time movement paths and comment notifications on major sections.
If my analysis was helpful,
Please click the booster button at the bottom.
Here is the Bitcoin 30-minute chart.
There is no Nasdaq index announcement today.
There is a possibility that Nasdaq will fall sharply,
but even if it moves sideways, the probability of the strategy succeeding increases.
On the left, with the purple finger,
I connected the 2nd section of the long position that I entered yesterday.
*When the blue finger moves,
Bidirectional neutral
Short->Long or long waiting strategy
1. 109,638.1 dollars short position entry section / cut-off price when orange resistance line is broken
2. 108,764.4 dollars long position switching / cut-off price when green support line is broken
3. 110,273.1 dollars long position 1st target -> target price in order from Miracle
If the strategy is successful, I left a simulation with the pink finger,
so please refer to it.
Those who held long positions yesterday, please check if the purple support line is broken,
If it falls immediately from the current position or
If the pink resistance line is not broken when the 1st section at the top is touched,
It is a vertical decline section,
And if the 109,638.1 dollar short position entry section at the top is not touched,
It is a long waiting strategy at the 2nd section at the bottom.
I think it would be good to think of it as a game in the 1+4 section.
From the 2nd section breakout, I have marked the Bottom -> 3rd section at the bottom.
Up to this point, please just refer to and use my analysis,
I hope you operate safely with principle trading and stop loss prices.
Thank you for your hard work this week.

July 3 Bitcoin Bybit chart analysis
Hello
This is Bitcoin Guide.
If you "follow"
You can receive real-time movement paths and comment notifications on major sections.
If my analysis was helpful,
Please click the booster button at the bottom.
Here is the Bitcoin 30-minute chart.
There will be a Nasdaq index announcement at 9:30 and 11:00 in a little while.
I created today's strategy based on the Nasdaq pattern and Tether dominance vertical decline conditions.
*One-way long position strategy when the red finger moves
1. $109,838 long position entry point / stop loss price when the purple support line is broken
2. $111,549.7 long position 1st target -> Great 2nd target
The 1st section at the top and the 2nd section at the bottom are sideways sections.
Even if the strategy fails, if the green support line is not broken,
it is good for a long position.
Below that
Bottom -> Please note that it is open up to 107,841.4 dollars
Up to this point, I ask that you simply use my analysis for reference and use only
I hope that you operate safely with principle trading and stop loss prices.
Thank you.

July 1 Bitcoin Bybit chart analysis
Hello
This is Bitcoin Guide.
If you "follow"
You can receive real-time movement paths and comment notifications on major sections.
If my analysis was helpful,
Please click the booster button at the bottom.
Here is the Bitcoin 30-minute chart.
Shortly later at 10:30 PM and 11:00 PM, there will be a NASDAQ index announcement.
On the left, with a purple finger,
I connected the long position entry point of $106,775.9, which I entered yesterday, to today's strategy.
Since the rebound was not strong yesterday,
the 12-hour chart -> daily chart MACD dead cross is currently under pressure.
Depending on the situation, it can drop strongly to the 3rd section at the bottom,
and since there may be some people who are maintaining long positions yesterday,
I will explain in detail the operating method such as the loss cut price,
so please check it carefully.
*When the blue finger moves,
Bidirectional neutral
Short->Long switching strategy
1. 107,300.3 dollars short position entry section / stop loss price when orange resistance line is broken
2. 106,222.2 dollars long position switching / stop loss price when section 2 is touched
3. Top section long position 1st target -> Good 2nd target
It is important until 9 o'clock when the 12-hour candle is created.
After 9 o'clock, the blue finger 106,222.2 dollars at the bottom
Becomes the main support line
If it comes down from the current position, section 2
The main support line is divided.
In terms of the pattern, it is section 6+12.
If section 2 is touched right away,
There is a high possibility of a strong drop today,
So you should be careful.
- Those who are maintaining a long position
If you touch the 2nd section before 9 PM without touching the short position entry point at the top
You should operate at a loss cut price.
I think it would be good to adjust it according to leverage.
If it falls after touching the 1st section at the top
It becomes a vertical decline condition.
From the bottom, from the 3rd
Maximum Bollinger Band daily chart support line section
Please note that it can be pushed up to 100,685.5 dollars.
I have never changed my perspective suddenly or irresponsibly after leaving an analysis article.
I did my best until the end today.
Please use my analysis article so far only for reference and use
I hope you operate safely with principle trading and loss cut prices.
Thank you.

June 30 Bitcoin Bybit chart analysisHello
This is Bitcoin Guide.
If you "follow"
You can receive real-time movement paths and comment notifications on major sections.
If my analysis was helpful,
Please click the booster button at the bottom.
This is the Bitcoin 30-minute chart.
There is no separate indicator announcement today.
The weekly and daily charts are being adjusted at the same time as they are created.
The strategy was carried out based on the Nasdaq pattern and the Tether dominance pattern.
The long position entry section on the 25th, $106,746, was connected as is.
*When the blue finger moves,
It is a two-way neutral
short->long switching or long waiting strategy.
1. $108,138.1 short position entry section / stop loss price when orange resistance line is broken
2. $107,507.9 long position switching / stop loss price when green support line is broken
3. $108,507.9 long position 1st target -> Good 2nd target price
You can also use the long position re-entry indicated in the middle.
If it comes down right away without touching the short entry section at the top,
it is a long waiting strategy at the gap section of 107,102.7 dollars,
and the stop loss price is the same.
And, if it succeeds in rebounding within the purple support line today,
the reason it is safe from a long position is
because the low point of the weekly and daily candles created this week is maintained without additional deviation.
Please note that the 1st section at the bottom is a sideways market / the 2nd section is open up to the bottom.
Please use my analysis article so far only for reference and use,
and I hope you operate safely with the principle trading and stop loss price.
Thank you.

June 25 Bitcoin Bybit chart analysisHello
This is Bitcoin Guide.
If you "follow"
You can receive real-time movement paths and comment notifications on major sections.
If my analysis was helpful,
Please click the booster button at the bottom.
This is the Bitcoin 30-minute chart.
Nasdaq indicators will be announced at 11 o'clock shortly.
Nasdaq is rising vertically + renewing its all-time high.
Accordingly, I ignored the weekly MACD dead cross and
proposed the strategy for the pattern by substituting Tether dominance.
Although it is not visible on the screen,
I created today's strategy with the condition of maintaining the long position of $100,587.9 that was confirmed on the 23rd.
* One-way long position strategy when the red finger moves
1. $106,746 long position entry section / When the purple support line is broken
or when section 2 is touched, stop loss price
2. $108,66 long position 1st target -> Good 2nd -> Great 3rd target price
When section 1 at the top touches, it can be connected to an upward trend,
and section 2 is a sideways market.
At the very bottom and the very top,
I have indicated the maximum possible trend until tomorrow afternoon.
Up to this point, I ask that you simply use my analysis for reference and use only
I hope that you will operate safely with the principle of trading and stop loss.
Thank you.

June 23 Bitcoin Bybit chart analysisHello
This is Bitcoin Guide.
If you "follow"
You can receive real-time movement paths and comment notifications on major sections.
If my analysis was helpful,
Please click the booster button at the bottom.
This is the Bitcoin 30-minute chart.
The Nasdaq seems to be rising without any problems,
but Bitcoin is under pressure from the MACD dead cross on the weekly chart as it has been adjusted strongly over the weekend.
Depending on the real-time situation, it seems advantageous to operate safely
short-term trading or both-way trading this week.
I created today's strategy based on the Nasdaq movement and the Tether dominance pattern.
*One-way long position strategy when the red finger moves
1. $100,587.9 long position entry section / hand drop when the purple support line is broken
2. $103,953.8 long position target price / Good 2nd target price thereafter
From the purple support line breakout, the weekly chart
candle low point created this week is broken, so it is better to maintain it without breaking out from the long position position.
If it breaks out, it can be pushed to the bottom -> 2nd section.
The 1st section marked in the middle
If it doesn't come down to the long entry point today
It is a vertical rise section
And the pink finger in the middle indicates the short-term target price -> additional long entry section
And the Gap8 section was created at the top due to last week's movement
I think it would be good to refer to it while trading.
Up to this point, I ask that you simply use my analysis for reference and use
I hope that you operate safely with principle trading and stop loss prices.
Thank you.

June 17 Bitcoin Bybit chart analysisHello
This is Bitcoin Guide.
It's been a while.
I took a break recently because the participation rate was not good.
Since it's been a while since I did an analysis, I did it in a short form,
I hope you enjoy it.
If you "follow"
You can receive real-time movement paths and comment notifications on major sections.
If my analysis was helpful,
Please click the booster button at the bottom.
Here is the Bitcoin 30-minute chart.
I created a strategy based on the possibility of sideways movement in Nasdaq and the rebound of Tether Dominance.
* When the blue finger moves,
It is a two-way neutral short->long switching strategy.
1. $106,792.2 short position entry point / stop loss price when orange resistance line is broken
2. $105,082.8 long position switching / stop loss price when green support line is broken
3. $107,579.9 long position 1st target -> Top 2nd target price
If it goes down from the current position,
Check the bottom section -> up to $103,194.3.
Please use my analysis as a reference only
I hope you operate safely with principle trading and stop loss price.
Thank you.

May 27 Bitcoin Bybit chart analysisHello
It's a Bitcoinguide.
If you have a "follower"
You can receive comment notifications on real-time travel routes and major sections.
If my analysis is helpful,
Please would like one booster button at the bottom.
This is the NASDAQ 30-minute chart.
There will be an indicator announcement at 11 o'clock.
The daily chart MACD dead cross is in progress.
*When the red finger moves,
it is a long position strategy.
I simply proceeded with the purple finger short -> red finger long switching
or the red finger long waiting strategy.
Today, if possible, it is advantageous for long positions because the weekly chart low point will not be broken even if you just move sideways without touching the gap section.
When the gap section is deviated, I marked the bottom -> section 2 at the bottom
and applied it to Bitcoin as it is.
This is a Bitcoin 30-minute chart.
At the bottom left is the gap retracement section that was performed on the 26th
The purple finger is the entry point for the long position at $108,233.5
It is connected as is.
*When the red finger moves,
It is a long position strategy.
1. After confirming the touch of the first section of the purple finger at the top
109,519.6 long position entry section / cut-off price when the green support line is broken
2. 111,883.3 long position 1st target -> Good 2nd target
Until the additional daily chart is created at 9 am tomorrow
Because the top section of the resistance line of the Bollinger Band daily chart can be a strong adjustment section
You should be careful.
If you touch after 9 o'clock, there is a possibility of additional increase, and
If the strategy is successful, you can use the 1st section indicated at the top as a long re-entry section after the first liquidation of the Top section.
Today, we will focus on long positions,
but it is important whether the main point touches the upper part of Nasdaq first and then
comes down immediately.
If it comes down immediately without touching the 1st section,
the final long waiting strategy is at 108,652.9 dollars in the 2nd section.
If the green support line breaks away, the stop loss price is the same.
Since the mid-term pattern is broken,
if you somehow manage to hold it within the 2nd section today, it is good for the long position.
If it breaks away, check the Bottom -> 3rd section at the bottom,
Since Bitcoin's new high is updated depending on the movement of Nasdaq this week,
it seems that a decline or continuous rise after the double top may be connected.
Up to this point, I ask that you simply use my analysis for reference and use only.
I hope that you operate safely with the principle of trading and cut-off price.
Thank you.

May 23 Bitcoin Bybit chart analysisHello
It's a Bitcoinguide.
If you have a "follower"
You can receive comment notifications on real-time travel routes and major sections.
If my analysis is helpful,
Please would like one booster button at the bottom.
Here is the Bitcoin 30-minute chart.
There will be a Nasdaq indicator announcement at 11 o'clock in a little while.
Yesterday was also a sideways market with no movement,
and the participation rate was low, so I will leave it as a brief analysis.
In the case of Nasdaq, today's daily chart MACD dead cross pressure
so I judged that a vertical rise would be difficult.
I made today's strategy based on the high possibility of a sideways move.
In the upper left corner, from the analysis article on the 22nd,
I moved the 1st section / 111,426.6 dollars as it is with a purple finger.
*Red finger movement path
One-way long position strategy
1. 109,917.6 dollars long position entry section / green support line breakout stop loss price
Since the 4-hour chart MACD dead cross pressure is in progress
Based on the 1+4 pattern,
At least 2 additional 4-hour candles are created
I think there will be a long position wait after 1:30 p.m.
2. Top section 113,701.9 dollars long position 1st target -> Good 2nd target
If it breaks through the orange resistance line at the top
It can be connected to a vertical rise,
So if you were short yesterday or are going to challenge today,
Use it as a stop loss price, but be careful.
If it goes up within the purple support line after 1->2 or after touching 2 times,
It can be a vertical rise or a strong rise.
At the bottom, Bottom -> 3 times -> 106982.3 dollars
I marked the support line.
In case of a strong rise over the weekend,
Good is the Great section hidden picture search.
Up to this point, I ask that you simply use my analysis for reference and use,
and I hope that you operate safely with principle trading and stop loss prices.
Thank you for your hard work this week.
Thank you.

May 22 Bitcoin Bybit chart analysisHello
It's a Bitcoinguide.
If you have a "follower"
You can receive comment notifications on real-time travel routes and major sections.
If my analysis is helpful,
Please would like one booster button at the bottom.
This is the Nasdaq 30-minute chart.
Where the mid-term pattern is restored
Blue finger short->long switching
Long waiting strategy up to section 1.
I marked the target price section at the top / the support line price at the bottom
I will try to apply it to Bitcoin as is.
Here is the Bitcoin 30-minute chart.
Nasdaq indicators will be announced at 9:30 and 11:00 shortly.
Nasdaq movement + short-term pattern is broken,
and the Tether Dominance short position operation method is applied to Bitcoin, which moves in the opposite direction.
* One-way long position strategy when the red finger moves
1. $109,917.6 long position entry section / When the green support line is broken,
or when section 2 is touched, stop loss price
2. $113,701.9 long position 1st target -> Good 2nd target price
Section 1 at the top is the last short position operation section of the day,
and when it breaks through, it can be connected to an upward trend,
so it seems advantageous for beginners to use it as a long waiting strategy in an upward wave.
If you touch the red finger long position entry section first among 1 or 109.9K,
You can go around and rise strongly.
If you succeed in rebounding without breaking the purple support line,
Vertical rise
Movement within the 1st section at the top and 2nd section at the bottom is sideways.
Because it is open from Bottom -> 3,
Be careful of Nasdaq fluctuations,
If you succeed today, you will have 4 consecutive perfects.
Please use my analysis articles for reference and use only
I hope you operate safely with principle trading and stop loss prices.
Thank you.

May 21 Bitcoin Bybit chart analysisHello
It's a Bitcoinguide.
If you have a "follower"
You can receive comment notifications on real-time travel routes and major sections.
If my analysis is helpful,
Please would like one booster button at the bottom.
This is the Nasdaq 30-minute chart.
There is no separate indicator announcement today.
After the red finger chase purchase,
I explained the main demand section drawing and price.
I applied it to Bitcoin as is.
This is a Bitcoin 30-minute chart.
At the bottom left, the purple finger
connects the strategy to the long position entry section that was entered on the 20th.
*When the red finger moves,
it is a one-way long position strategy.
1. $105,263.7 long position entry section / stop loss price when the sky blue support line is broken
2. $108,207.6 long position 1st target -> Top 2nd target -> Good 3rd target price
The 1st section at the top is the rising wave confirmation section,
and the strategy is more likely to succeed if the purple support line is broken after the touch.
(If it goes up right away, there is a possibility of a vertical rise)
Red finger long hold
If it goes down right away without touching, it is the final long hold strategy at 2.
From the 2nd section deviation, I marked Bottom -> 3
Since the mid-term pattern was broken yesterday,
you should succeed in rebounding within the green support line if possible.
Up to this point, I ask that you simply use my analysis for reference and use,
and I hope that you operate safely with principle trading and stop loss prices.
Thank you.

May 19 Bitcoin Bybit chart analysisHello
It's a Bitcoinguide.
If you have a "follower"
You can receive comment notifications on real-time travel routes and major sections.
If my analysis is helpful,
Please would like one booster button at the bottom.
This is the Nasdaq 30-minute chart.
There is no separate indicator announcement today.
The 12-hour chart MACD dead cross is in progress.
The blue finger is short->long or if it goes down right away,
the purple finger is a long waiting strategy.
Since the morning, the blind decline has been in progress,
and the short-term pattern is broken.
The bottom section is about 6+12 sections,
and it is today's major support line.
I applied it to Bitcoin as it is.
This is the Bitcoin 30-minute chart.
It is being adjusted strongly as it is coupled with Nasdaq.
Based on Tether dominance,
If the current low is broken,
It is a position where it can be pushed strongly.
* When the red finger moves,
It is a one-way long position strategy.
1. 102,192.1 USD long position entry section / stop loss price when the green support line is broken
2. 104,866.1 USD long position 1st target -> Top 2nd target
The 1st section of the purple finger at the top
Is the best short position entry section of the day.
If it does not touch, it will fall vertically,
So if it goes down right away without touching the 1st section
It can be pushed to the bottom -> 2.
The danger signal has passed, but the problem is when it couples with Nasdaq.
The 2nd section at the very bottom is the 12+ daily support section,
and will be today's major support line.
Last week, many people pressed the booster,
so I'm leaving it as a public post today as well.
Up to this point, I ask that you use my analysis for reference and use only,
and I hope that you operate safely with principle trading and loss cuts.
Thank you.

May 16 Bitcoin Bybit chart analysisHello
It's a Bitcoinguide.
If you have a "follower"
You can receive comment notifications on real-time travel routes and major sections.
If my analysis is helpful,
Please would like one booster button at the bottom.
This is the Nasdaq 30-minute chart.
There is no separate indicator announcement.
We proceeded with trend following.
After entering the 1st long position at the top,
If it does not break away from the purple support line, it goes up vertically.
*We proceeded along the red finger movement path in the next wave.
We expected the movement to be a strong rise.
From the bottom breakaway, it is open up to the 2nd section,
and we will omit the detailed explanation.
This is the Bitcoin 30-minute chart.
At the bottom left, with a purple finger,
I connected the long position entry section of 101,785.1 dollars that I had on the 15th.
The current position is the 30 + 1 section,
but since the 4 and 6-hour central lines were also touched at the same time,
the mid-term pattern is broken,
and the daily chart MACD dead cross is in progress.
The strategy is one-way, one-way,
I am explaining it only on one page of the 30-minute chart,
so it is limited, but I organized it as simply as possible.
*When the blue finger moves
Two-way neutral
Short->Long or long waiting strategy
1. 104,791.3 dollars short position entry section / stop loss price when orange resistance line is broken
2. 103,241.8 dollars long position switching / stop loss price when green support line is broken
After that, long position target price in the order of Good -> Great
-> Refer to pink finger simulation.
If it touches the top once or comes down right away from the current position,
it is the final long waiting strategy at the bottom section 2.
From the bottom section breakout,
it is open from 3 -> 99345.9 dollars.
Please use my analysis article so far only for reference and use
I hope you operate safely with principle trading and stop loss price.
Thank you for your hard work this week.

May 14 Bitcoin Bybit chart analysisHello
It's a Bitcoinguide.
If you have a "follower"
You can receive comment notifications on real-time travel routes and major sections.
If my analysis is helpful,
Please would like one booster button at the bottom.
This is the Nasdaq 30-minute chart.
There is no separate indicator announcement today.
I conducted a brief analysis with rough movements.
The 3-hour chart MACD dead cross pressure is in progress,
and from the purple finger at the top to number 1,
it is the best short position entry section of the day,
and from the orange resistance line breakthrough, it is an upward trend.
*The 21.1K red finger at the bottom is a long-term strategy,
and if there is a rebound within the purple support line without touching the entry point,
it will rise vertically.
The short-term pattern may be broken from the 2nd section,
and it is a downward sideways movement to the bottom -> the 3rd section is the 1+4 section.
I applied it to Bitcoin as is.
This is a 30-minute chart for Bitcoin.
Since there is no Nasdaq indicator announcement, we proceeded with trend following.
In the case of Bitcoin, the 12-hour chart MACD dead cross was engraved,
and the lower Bollinger band was touched first.
On the left, with the purple finger,
101.1K long -> 104.283.2 dollar short switching
I connected the strategy as it is.
*When the blue finger moves,
It is a two-way neutral
short->long switching strategy.
1. 104.326.6 dollar short position entry section / stop loss price when orange resistance line is broken
2. 103,278.1 dollar long position switching / stop loss price when green support line is broken
If the strategy is successful,
section 1 can be used as a long position re-entry section. (Purple parallel line maintenance condition)
I proceeded tightly up and down for fear of missing the entry point.
Instead, if I explain in detail,
The movement within 1 at the top and 2 at the bottom is a sideways section,
and it is a section where a trend can emerge when breaking out or breaking out.
For those who have been holding a short position since yesterday,
I think it would be good to operate with a stop loss price when breaking out of the orange resistance line, just like today's strategy.
If it comes down right away without touching the 104.3K short entry point,
the final long position is waiting in the 2nd section.
The stop loss price is the same.
If it breaks out of the bottom section today, it can be directly connected to the 3rd section at the bottom,
so those who are operating a long position should be careful.
Up to this point, I ask that you simply refer to and use my analysis,
and operate safely with principle trading and stop loss price. Please support the 4 consecutive perfect challenges
Thank you

May 9 Bitcoin Bybit chart analysisHello
It's a Bitcoinguide.
If you have a "follower"
You can receive comment notifications on real-time travel routes and major sections.
If my analysis is helpful,
Please would like one booster button at the bottom.
This is the Nasdaq 30-minute chart.
There is no separate indicator announcement today.
With the green support line maintenance condition, I created a strategy for a sideways market with a red finger long position strategy.
The main sections are indicated by price, so
Please refer to it.
This is a Bitcoin 30-minute chart.
At the bottom left, with a purple finger,
I just connected the 99,222.6 dollar long position strategy from the 8th analysis article.
*When the red finger moves,
One-way long position strategy
1. 102,536 dollar long position entry section / cut-off price when the green support line breaks
2. Top section 105,417.6 dollar long position 1st target -> Target price in order from Good to Miracle.
From Miracle, the report is updated,
and the possibility of the report being updated has greatly increased due to yesterday's movement.
The 1st purple finger section at the top
If it doesn't break through, it's a sideways market, but if it breaks through, it can be directly connected to an upward trend,
so it seems safer to operate it as a long position waiting rather than taking a short. (Horizontal range until convergence section 1, 2)
From the green support line deviation of section 2 at the bottom
Because of the full candle on the left, it can be pushed hard,
So you must follow the stop loss price.
This week, it is open from Bottom-> 3rd -> 97086.1,
So please use it well in real time.
Up to this point, I ask that you simply refer to and use my analysis
And I hope that you operate safely with principle trading and stop loss price.
Thank you for your hard work this week.
Thank you.

May 2 Bitcoin Bybit chart analysisHello
It's a Bitcoinguide.
If you have a "follower"
You can receive comment notifications on real-time travel routes and major sections.
If my analysis is helpful,
Please would like one booster button at the bottom.
Here is the Bitcoin 30-minute chart.
There will be an indicator announcement at 9:30 in a little while.
Unlike Nasdaq, Bitcoin touched the upper Bollinger Band first and is on the verge of an upward trend.
Since there is a possibility of missing the entry point at the current position,
I set the stop loss price short and proceeded aggressively.
*One-way long position strategy when the red finger moves
1. Pursuit purchase at $96,835.6 / When the purple support line is broken,
or when the bottom section is touched, stop loss price
2. Long position target price at $98,766.4 -> Good 2nd target -> Great 3rd target
If the Great section is broken at the top,
the probability of a new high price is high.
From the bottom touch, the mid-term pattern will be broken
(currently 6+12 in progress)
When looking at the candle shape, from the green support line bottom breakout
It can break out strongly, so please refer to the bottom 2, 3 times up to 93016.7 dollars, and if 93K breaks, a downward trend can be connected again, so
You should be careful.
I left the analysis article up to May 6th
and the main points and the drawing section on one page, so it's hard
Please just refer to and use my analysis article up to here
I will see you next week after the holiday.
Thank you.

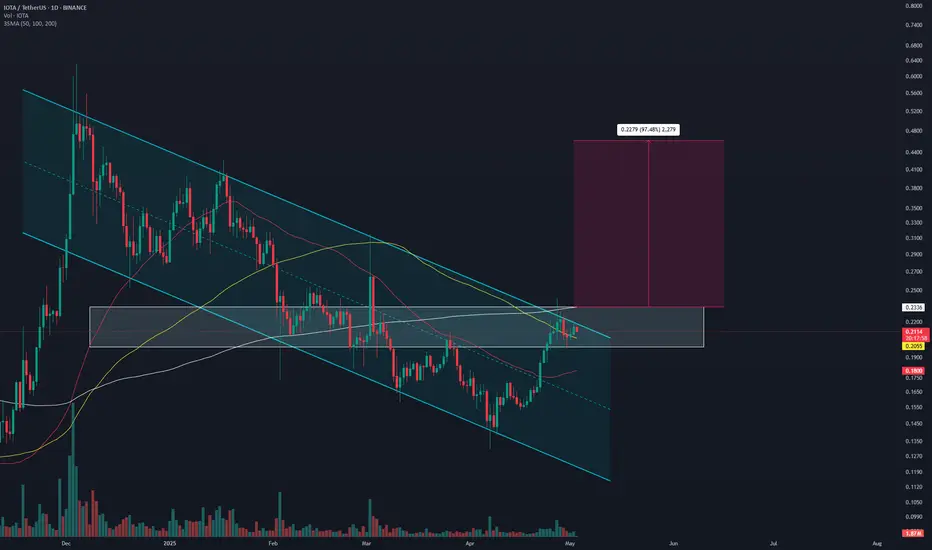
IOTAUSDT Analysis D1IOTAUSDT Seems Like Ready For Strong Bullish Rally, Breakout And Retest Has Already Confirmed, Expecting 2x In Coming Days .