USDSGD POSSIBLE SHORT ON BREAK OF TRENDLINEWe could see SHORT positions if we break the up trendline and close below 1.4000. At that point we will have confirmed M pattern or a Double Top.
Mformation

DXY double top?Looking at the overall strength of the USD we can see a potential double top forming. This is a pivotal moment in the USD to see if we can continue the strength it has shown, or whether the tables are starting to turn.

GBPJPY Bear swingI see 6 confluences that are signaling sells for next week.
1. Downtrend on higher time frame
2. Fib golden zone hit
3. Resistance from downtrend hit
4. M formation in the fib golden zone
5. Break and retest of smaller time frame uptrend
6. DXY is bullish

AUDUSD ANALYSIS I hope this should enlighten you more to know that we are now going to be printing some downtrends in currency AUDUSD, there was counter trendline analysis I made there and that should also help after completing the “M” formation we should see a little move to the upside and continue the downtrend, I’ll be glad seeing AUDUSD in $0.65-$0.60 levels
As you can see my OB a lot of buyer are placing their order at that price ranges.
Correct me if I’m wrong, Thank you!

AUDCHF RTO (return to order 61.8)GOOD DAY TRADERS
been awhile
We have eyes on our key level and we should be seeing a reaction of that zone and bearish momentum to enter the trade after the B.O.S
stops above 0.66483
entry 0.66215
TP at 0.65591
GOOD RISK MANAGEMENT
ALL THE BEST

NAS100 DAILYA look at the Daily TF. As mentioned in my previous analysis - possible M formation or Bull run to continue.

GBPUSD 1.41372 - 0.27 % SHORT IDEA * INTRADAY - EXECUTIONHELLO EVERYONE
HOPE EVERYONE IS DOING GOOD HAVING A GOOD ONE IN THE MARKET THIS WEEK, HERE'S A LOOK AT THE THE POUND / DOLLAR FROM THE HOURLY CHART.
* On higher time frames the pair is strongly bullish from the MONTHLY & WEEKLY.
> On lower time- frames the pair is currently correcting in a possible bull flag
we saw the completion of a ( M ) FORMATION possible going down for a retst of the
flag structure. the trade is currently triggered looking for continuation to the base of structure.\
IF THIS IDEA ASSISTS IN ANY OR IF YOU LIKE THIS ONE
SMASH THAT LIKE BUTTON & LEAVE A COMMENT.
ALWAYS APPRECIATED
_________________________________________________________________________________________________________________________
* Kindly follow your entry rules on entries & stops. |* Some of The idea's may be predictive yet are not financial advice or signals. | *Trading plans can change at anytime reactive to the market. | * Many stars must align with the plan before executing the trade, kindly follow your rules & RISK MANAGEMENT.
__________________________________________________________________________________________________________________________
| * ENTRY & SL -KINDLY FOLLOW YOUR RULES | * RISK-MANAGEMENT | *PERIOD - INTRA-DAY TRADE

EUR/GBP Montly!!!There is a M formation In the monthly time frame. We can expect the price to retrace to the .50 fibonacci level.

GOLD update !!Good day Traders !! On this multi-timeframe analysis we will make a full breakdown of this pair.
I will be also publishing analysis of the other timeframes as well for this pair for further references.
Now if you enjoyed this analysis smash that like button and share. If you have a different opinion please leave a comment below as I would love to get more insights and ideas. I also linked my previous idea about this asset.
Trade safe !!!

Short. 4H EUR/USD is going to complete M-formationAfter retesting an annual trend line EUR/USD was rejected and created a M-formation. Now it needs to correct to 38% on Fibonacci level to M neck line before taking a nice short

EUR/NZD UPDATE .Good day Traders !! On this multi-timeframe analysis we will make a full breakdown of this pair.
Monthly : We have just Completed an "M" formation We expect the price to hit the neckline at 1.73800 in the long term if we reject the current area of support we are currently sitting at .
Weekly : We have an ABC corrective sequence waves and we might be ready for the next impulse very soon.
Daily : We just completed a "W" formation pattern and we just rejected the price to the upside which may indicate a bullish move soon .
COT : Institution have been Increasing net positions in EUR since they added more than 4000 long positions and closed to 800 Short position during the last report.
From an NZD perspective we are still looking at a Steady NZD while EUR is gaining in strength which may explain our vision of a bullish EUR.
8H: On this timeframe we do have a bullish environment and the price is creating HH and HLs and we do expect a continuation to the upside on the long and short term.
MACD: Bullish environment
EMA's Cut for long
We do have two long setups for this pair , one in the mid-short term and one in the long term.
Now if you enjoyed this analysis smash that like button and share. If you have a different opinion please leave a comment below as I would love to get more insights and ideas. I also linked my previous idea about this asset.
Trade safe !!!

USD CAD ShortShort Trade sell at neckline break could net 25 plus pips M formation take profit at the lows

GBP/NZD ready for the fall.Good Day traders !! For this pair we are at the 5 impulsive wave to the downside. WE also have a very strong level of resistance in confluence with the 0.5 Fib level which makes it even stronger and hard to break. Also on the daylight timeframe we have a formation of an "M" formation and we would like to see the pattern completed before seeing any kind of bullish move for the British pound.
From a COT perspective we are seeing the GBP bearish since we went from a 13705 net position to about 8000 net position and this is because of the massive number of short position that has been added from last week.
We have an extremely good RR on this pair and it"s ready to start it's move. Now if you enjoyed this analysis like and share. If you have a different opinion don't hesitate to comment as I would love to have more insights.
Trade safe !!!

FULL BREAKDOWN AUD/USD !!Good Day Traders !! Here is a full breakdown on this pair, let me know if you have any questions in the comment area before, the entry will be triggered only if all the rules of the strategy are respected. I would suggest to keep this pair on your watchlist to look for opportunities. Also I will be linking my previous analysis about this pair.
Trade safe !!

How to Identify & Trade Double Tops and Double Bottoms in 2021Hello Traders,
Here is some of my Favorite and Most simple Educational Chart Patterns that you should know in 2021.
In this Lesson I will Show you how to Identify & Trade These Patterns!
These patterns are seen daily in Stocks, Forex and different markets across the Globe.
I hope you will find this information educational & informative .
Your support is appreciated with a like & Comment
Lets dive Right Into it!!
What Is Double Top and Bottom?
Double top and bottom patterns are chart patterns that occur when the underlying market moves in a similar pattern to the letter "W" (double bottom) or "M" (double top).
Double top and bottom analysis is used in technical analysis to explain movements in the Market, and can be used as part of a trading strategy to exploit recurring patterns.
KEY TAKEAWAYS
A double top has an 'M' shape and indicates a bearish reversal in trend.
A double bottom has a 'W' shape and is a signal for a bullish price movement .
Understanding Double Tops and Bottoms
Double top and bottom patterns typically evolve over a longer period of time, and do not always present an ideal visual of a pattern because the shifts in prices don't necessarily resemble a clear "M" or "W".
When reviewing the chart pattern, it is important for traders to note that the peaks and troughs do not have to reach the same points in order for the "M" or "W" pattern to appear.
Double top and bottom patterns are formed from consecutive rounding tops and bottoms. These patterns are often used in conjunction with other indicators since rounding patterns in general can easily lead to fakeouts or mistaking reversal trends.
Double Top Pattern (M Formation)
A double top pattern is formed from two consecutive rounding tops. Rounding tops can often be an indicator for a bearish reversal as they often occur after an extended bullish rally. Double tops will have similar inferences. If a double top occurs, the second rounded top will usually be slightly below the first rounded tops peak indicating resistance and exhaustion. Double tops can be rare occurrences with their formation often indicating that investors are seeking to obtain final profits from a bullish trend. Double tops often lead to a bearish reversal in which traders can profit from selling at the neckline (with confirmation) to form a downtrend.
Double Bottom Pattern
Double bottom patterns are essentially the opposite of double top patterns. Results from this pattern have the opposite inferences. A double bottom is formed following a single rounding bottom pattern which can also be the first sign of a potential reversal. Rounding bottom patterns will typically occur at the end of an extended bearish trend. The double bottom formation constructed from two consecutive rounding bottoms can also infer that traders are following the Market to capitalize on its last push lower toward a support level. A double bottom will typically indicate a bullish reversal which provides an opportunity for Traders to obtain profits from a bullish rally. After a double bottom, common trading strategies include long positions that will profit from a rising Market price.
Limitations of Double Tops and Bottoms
Double top and bottom formations are highly effective when identified correctly. However, they can be extremely detrimental when they are interpreted incorrectly. Therefore, one must be extremely careful and patient before jumping to conclusions.
For example, there is a significant difference between a double top and one that has failed. A real double top is an extremely bearish technical pattern which can lead to an extremely sharp decline in the market. However, it is essential to be patient and identify the critical support level to confirm a double top's identity. Basing a double top solely on the formation of two consecutive peaks could lead to a false reading and cause an early exit from a position.
How to Trade these Patterns Correctly using the information i have given above
1. Identify The Double Top or Double Bottom
2. Wait for the market to break the previous support or previous resistance to confirm this pattern " M or W" ( as show in my chart above)
3. Be Patient & wait for the market to come back to the "Neckline" (Previous support or Previous Resistance) (as shown in the chart above)
4. When the market will reach the "Neckline area aka support/resistance" monitor the "PRICE ACTION" (in the notes on chart)
5. Monitor the PRICE ACTION for a "Change" in the Market Environment "example" ----- (HL/HH,LH/LL).
6. It is Important to monitor the "Price Action" in the neckline area for some confirmation ( Break of structure or Candlestick confirmation)
7. Always wait for proper confirmation ( at least 2-3 different types of confirmation before Entry)
8. Always Use risk Management & Practise Safe trading.
9. Patience is always the Key to Success!
10. Enjoy The profit when you finally get to ride these Patterns :)
Thanks for Reading this article, I hope that it was informative and educational As always, If you have any questions / Comment or Concern Please feel free to leave them below.
Hope to see you in the next Educational Post!
Global Fx Education

GBP/CAD 1.73200 Good Day Traders !!
On the Monthly timeframe we have An M formation on the way, we are in the last leg and expect the price to drop. Going down to the weekly we have a "W" formation and we expect the price to drop to the neckline at least before a continuation to the upside. Going down on the daily We have completed an "M" formation pattern and we just rejected the neckline which support our bearish idea in the near future.
From an institutional perspective we can see a massive drop on Net positions on GBP and a big amount of long position added on the Cad according to the last report.
Now if you enjoyed this analysis smash that like button and share. If you have a different opinion please leave a comment below as I would love to get more insights and ideas. I also linked my previous idea about this asset.
Trade safe !!!

USD/JPY HEAD & SHOULDERS SWING TRADE SHORTIn this video we see a double top formation forming or more known as "Head & Shoulders".
Based upon previous support levels. It has broken previous lows and should start tanking.
Use caution with swing trades.

BITCOIN// M Forming or Breakout?Bitcoin is currency in a descending channel, and after the last W (Gartley) and retracement, price respected the resistance at the nose and is now in a slight uptrend towards the top of the channel.
This is a key area either for a breakout and path to 50k or a rejection to form the second leg of the M.

GBPNZD - Up then DownGBPNZD is coming off a previous W and Shark pattern. Usually after one pattern comes another of inverse proportions.
While price is moving within this range, it seems to be finding support and resistance at these key levels which form the patterns.
If the M is completed, there is possibility for an overextended M from the 4H to the daily timeframe which would then complete a bigger M formation and likely BAT harmonic pattern.

NASDAQ TO COMPLETE THE PATTERN ON THE DAILY TIMEFRAME ? ON the Daily timeframe we have an M formation and we would like to see the price to retest the neckline before the continuation to the downside. Also On the monthly timeframe we can obviously see an overextended W formation which neckline aligns perfectly with the demand zone highlighted on the Chart. We want to catch that impulse to the downside with a good R/R if the pattern is ready to be completed.
If you enjoyed this analysis smash that like button and share. In the event you have a different opinion please d'int hesitate to comment below as we would like to get more insights on this index.

Dow Jones to Crash ? US30 we have a nice clean M formation on the daily timeframe , we broke below support and the uptrend line with a bearish impulse, after a impulse we would like to see a correction before the continuation to the downside, we want to reach the neckline of the M formation, if we get the retracement to the neckline, then we will be looking for the continuation to the downside for a nice short swing setup. We can be potentially looking for a 1/4 RR if the prices rises to the neckline and provide to us one overvalid entry to get in that trade.
If you enjoyed this idea smash that like button and share. Don't hesitate to comment below if you have a different opinion as I would love to have more insights on this index.
Thanks and have an amazing trading week.

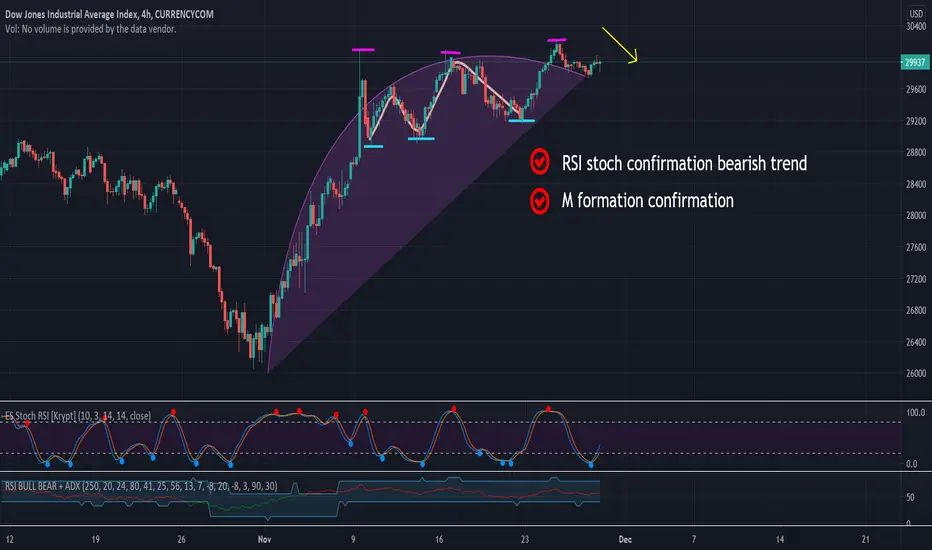
US30 industrial dow jones 4h going to be bearish dow jones is going to be bearish in 4h time frame and a possible rising wedge is going to be formed soon
M formation confirm its bearish style
there is a fake lower high in the wedge and its going to cross the wedge soon
GBPUSD-FOREX-MON NOV 16 ,2020Will reach top resistance then go back down to middle support creating a M formation.
