Who Has Bought the Most GoldSince the inflation hit a high at 9% in 2022, China, Turkey and Poland have been the top 3 buyers of Gold, including in the first two quarters of this year.
It’s not just these countries; many other central banks have been stockpiling gold since (iii) July 2022. Then gold prices were at around US$1,800.
Are central banks still buying as much gold today?
Micro Gold Futures and Options
Ticker: MGC
Minimum fluctuation:
0.10 per troy ounce = $1.00
Disclaimer:
• What presented here is not a recommendation, please consult your licensed broker.
• Our mission is to create lateral thinking skills for every investor and trader, knowing when to take a calculated risk with market uncertainty and a bolder risk when opportunity arises.
CME Real-time Market Data help identify trading set-ups in real-time and express my market views. If you have futures in your trading portfolio, you can check out on CME Group data plans available that suit your trading needs www.tradingview.com
MGC1!

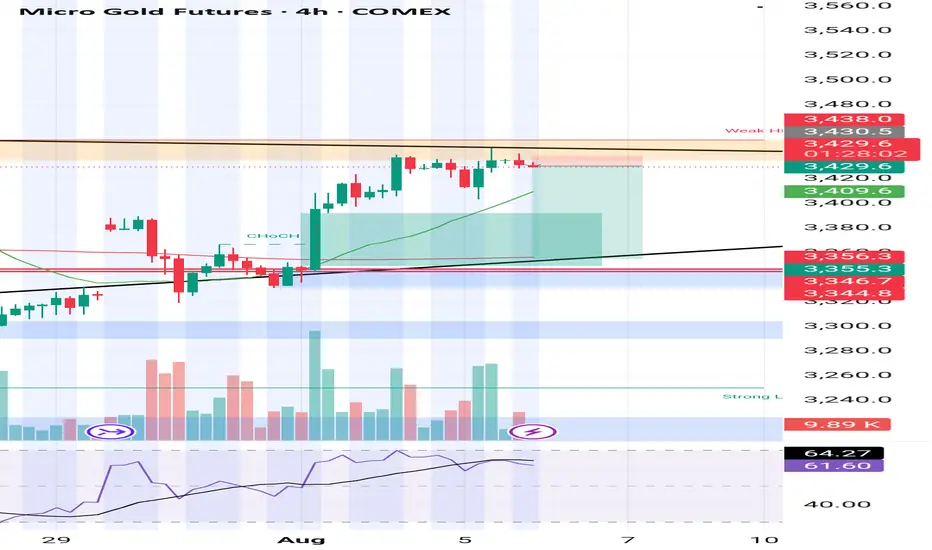
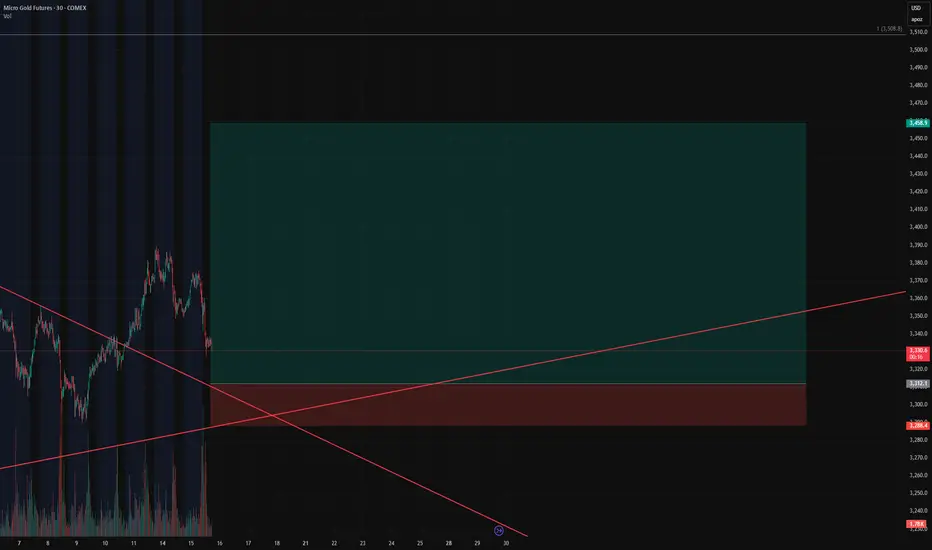
Gold Bulls Loading Up – Our Short Squeeze Trigger is Set!🚨 Gold Bulls Loading Up – Our Short Squeeze Trigger is Set!
We’re flipping the script on COMEX_MINI:MGC1! After a prolonged downtrend and textbook wedge compression, our breakout long is LIVE – but not without trapping the late shorts first.
💥 Entry: $3,312.1
🛑 Stop: $3,288.4
🎯 Target: $3,458.9
🧮 Risk/Reward: 6.19
Price just bounced at the retest of the wedge apex, and volume is confirming the move. If this holds, we’re riding momentum all the way up – and letting short pressure fuel the breakout.
📈 Trendline breached.
⏳ Time compression converging.
⚠️ If you’re still short, watch your stops!
MGC UPDATE 7/2/2025COMEX_MINI:MGC1! played out as expected weekly level was respected and it it clear because of BFI sponsorship Thanks for the people who gave some interest to my last post always happy to help another fellow trader
www.tradingview.com

Gold Miners Stocks Go 'The Rife Game' in Town. Here's WhyGold mining stocks have emerged as one of the top-performing asset classes in 2025, driven by a combination of surging gold prices, improved profitability, and shifting investor sentiment.
Here’s fundamental and technical analysis of the key factors behind this outperformance, by our @PandorraResearch Super-Duper Beloved Team :
Record-High Gold Prices Fuel Margins
Gold prices surpassed $3,000 per ounce in March 2025 for the first time in history, marking a 14% year-to-date increase. This rally stems from:
Safe-haven demand amid geopolitical tensions, economic and political uncertainty including U.S. trade policy volatility.
Central bank buying , particularly by China, India, Turkey, and Poland, to diversify away from the U.S. dollar.
Anticipated interest rate cuts , which reduce the opportunity cost of holding non-yielding assets like gold.
Higher gold prices directly boost miners’ revenues.
For example, the NYSE Arca Gold Miners Index NYSE:GDM returned nearly 30% YTD by early March, outpacing both physical gold OANDA:XAUUSD (+14.5%) and the S&P 500 SP:SPX (-3.8%). Companies like Agnico Eagle Mines NYSE:AEM and Wheaton Precious Metals NYSE:WPM reached all-time highs, while ASX-listed miners such as Evolution Mining ASX:EVN (+39.5% YTD) and West African Resources ASX:WAF (+56.6% YTD) outperformed Australia’s broader market.
Margin Expansion and Shareholder Returns
Gold miners are leveraging rising prices to improve profitability:
Stabilized costs for labor, energy, and equipment have widened profit margins.
Free cash flow growth enabled dividend hikes and share buybacks. U.S. Global Investors, for instance, offers a 3.91% annualized dividend yield.
Undervalued stocks: Many miners traded at historically low valuations relative to gold prices, creating buying opportunities. Barrick Gold NYSE:GOLD (P/E 15.6) and Newmont Corp NYSE:NEM (P/E 15.5) remained attractively priced despite gains.
Royal Gold NASDAQ:RGLD , a streaming company with a 60.3% operating margin, exemplifies how non-traditional miners capitalize on gold’s rally without direct operational risks.
Sector-Specific Catalysts
Mergers and acquisitions. Consolidation activity has increased, with larger firms acquiring high-potential projects.
Copper exposure. Miners like Evolution Mining benefit from rising copper demand, diversifying revenue streams.
Institutional upgrades. Analysts at Macquarie and Morgan Stanley endorsed Newmont and Evolution Mining, citing currency tailwinds and free cash flow potential.
Macroeconomic and Market Dynamics
Dollar weakness. A declining U.S. dollar enhances gold’s appeal as a hedge.
Equity market volatility. With the S&P 500 struggling, investors rotated into gold equities for diversification (0.3 correlation to broader markets).
Fiscal deficits. U.S. budget imbalances and inflationary pressures reinforced gold’s role as a store of value.
Outlook for 2025
Analysts project further gains, with gold potentially reaching $3,300 per ounce. Miners are expected to sustain momentum through:
Operational efficiency improvements to align with higher gold prices.
Continued capital discipline , avoiding overinvestment in new projects.
Dividend growth , as seen with U.S. Global Investors’ monthly payouts.
Technical Outlook
The main technical graph for Gold Miners ETF AMEX:GDX indicates on further Long-Term Bullish opportunity, to double the price over next several years, in a case of the epic $45 mark breakthrough.
Conclusion
In summary, gold miners’ 2025 rally reflects a confluence of macroeconomic uncertainty, disciplined capital management, and gold’s structural demand drivers. While risks like cost inflation persist, the sector’s fundamentals and valuation upside position it as a compelling component of diversified portfolios.
--
Best 'Golden Rife' wishes,
@PandorraResearch Team 😎

Gold at a Psychological Level Gold has now risen to 100 times its previously fixed price of $35 per ounce.
Is this a psychological milestone signaling a correction ahead, or is there still more upside potential?
Under the Gold Reserve Act of 1934, gold was officially priced at $35, a rate maintained until 1971, when President Nixon suspended the dollar’s convertibility into gold, effectively ending the gold standard. This historic move, known as the “Nixon Shock,” allowed gold to trade freely in the market. By December the same year, the market price had already climbed to around $43–44 per ounce.
So why has gold risen from $35 to $3,500?
Gold is widely recognized as a hedge against inflation—but in reality, it has proven to be more than that.
Let’s consider this:
If inflation had compounded at the target rate of 2% per year since 1971, gold should be priced at $102 today.
But at $3,500, the also implied that the compounded annual growth rate is around 8.9%.
So, what explains this outperformance?
One key driver is the expansion of the money supply, especially through debt, and more critically, debt financed by money printing.
Periods of high inflation are can be preceded by an unjustified increase in the money supply, not backed by corresponding income or production output.
In 2018, we saw the beginning of Trump’s Tariff 1.0. Since the anticipation of Trump’s Tariff 2.0, I’ve incorporated a framework I call the QTD Matrix—which stands for Quantitative Easing, Tariffs, and Debt—to track the trajectory of gold prices.
As long as we continue to see:
• Central banks deploying Quantitative Easing during crises,
• Ongoing or escalating Tariff wars, and
• Persistent growth in national Debt,
It is reasonable to expect gold to remain firm and potentially break into new highs.
Historical Observations:
• Let’s start with Gold vs QE. Each major wave of QE has triggered a significant rally in gold—from Japan’s QE in 2001, to US QE1, QE2, and QE3 following the 2008 crisis, and the massive Covid-era QE in 2020.
• Next Gold vs Tariffs. When Trump’s Tariff 1.0 was announced in August 2018, gold pivoted on that very day and began trending higher.
In October 2022, Biden’s export controls on advanced chips acted as a tariff-equivalent event, once again prompting gold to rise.
After Trump's re-election in November last year, markets began pricing in Tariff 2.0, and gold responded by trending upward once more.
• Finally Gold vs Debt. Gold has also moved in close tandem with the rising US debt over the years.
As of now, I believe that QE (Q), Tariffs (T), and Debt (D) will remain in play.
Hence, it's reasonable to expect:
• The cost of living to remain elevated,
• Inflationary pressures to persist, and
• Gold prices to continue their long-term uptrend.
That said, I’m also noticing technical and psychological resistance in the mid-term after it reached $3,500.
This is a quarterly chart, once I have identified its primary uptrend line, I would like to mirror it to its significant peak (going back way back the 1980s, a period of high inflation), which appears to intersect around the psychological level of $3,500.
With the trade war currently on pause, gold may temporarily take a breather. But as long as QTD remains intact, it may just be a matter of time before gold tests its recent resistance—and, if broken, continues its upward trajectory.
We should also ask:
Is there any possibility that the Q, T, or D could shift in the opposite direction?
If so, that could be a positive sign for equity markets.
Micro Gold Futures & Options
Ticker: MGC
Minimum fluctuation:
0.10 per troy ounce = $1.00
Disclaimer:
• What presented here is not a recommendation, please consult your licensed broker.
• Our mission is to create lateral thinking skills for every investor and trader, knowing when to take a calculated risk with market uncertainty and a bolder risk when opportunity arises.
CME Real-time Market Data help identify trading set-ups in real-time and express my market views. If you have futures in your trading portfolio, you can check out on CME Group data plans available that suit your trading needs www.tradingview.com
Trading the Micro: www.cmegroup.com
www.cmegroup.com

Gold at 100 Times its Price - A Psychological LevelGold has now risen to 100 times its previously fixed price of $35 per ounce.
Is this a psychological milestone signaling a correction ahead, or is there still more upside potential?
Under the Gold Reserve Act of 1934, gold was officially priced at $35, a rate maintained until 1971, when President Nixon suspended the dollar’s convertibility into gold, effectively ending the gold standard. This historic move, known as the “Nixon Shock,” allowed gold to trade freely in the market. By December the same year, the market price had already climbed to around $43–44 per ounce.
So why has gold risen from $35 to $3,500?
Micro Gold Futures & Options
Ticker: MGC
Minimum fluctuation:
0.10 per troy ounce = $1.00
Disclaimer:
• What presented here is not a recommendation, please consult your licensed broker.
• Our mission is to create lateral thinking skills for every investor and trader, knowing when to take a calculated risk with market uncertainty and a bolder risk when opportunity arises.
CME Real-time Market Data help identify trading set-ups in real-time and express my market views. If you have futures in your trading portfolio, you can check out on CME Group data plans available that suit your trading needs www.tradingview.com
Trading the Micro: www.cmegroup.com
www.cmegroup.com

Gold Options Activity Point to Continuing RallyNot a single macro portfolio manager was fired for adding gold to their portfolio over the last two years. Such has been gold’s stunning performance. Will Gold’s ascent continue?
Narratives and numbers signal unstoppable and solid bull run in gold for now.
BULL CASE REMAINS INTACT AND IS INTENFISYING
This paper will not delve much into fundamentals. We have covered it previously in Gold to Shine Bright on Fundamentals, Seasonality & Sentiments . In that we highlighted the three main forces at play: (a) Continued central bank purchases, (b) Rising consumer demand in China & India, and (c) Trump administration’s fiscal policies favouring gold.
In addition to the above, US Dollar weaponization, De-dollarisation fears, and Tariff tensions, serve as additional tailwinds. TradingView Wizard, Konhow , has comprehensively covered the historical impact of tariffs on Gold in his recent paper and video .
SENTIMENTS HAVE SURRENDERED IN FAVOR OF RISING GOLD
This research note will not dive into the weeds of technical analysis either. TradingView’s Technical Analysis dashboard summarises it all elegantly.
TradingView
Momentum is in favour. Oscillators are neutral indicating little risk of price reversal. Overall, sentiment remains bullish gold.
Gold prices as represented by CME Micro Gold Futures front month contract formed a golden cross on 10th January 2025. Since then, prices are up 8.5% as of 13th February 2025. Current prices are well above its 50-day, 100-day, and 200-day DMAs.
RSI is in overbought zone. Expect some pull back in gold prices from time to time on profit taking. But the upward trend is undeniable. The MACD shows that Gold momentum continues to be on the rise but with waning bullishness.
Readers can access the entire library of technical ideas focussing on Gold on TradingView’s Gold Ideas Page ideas page .
OPTIONS MARKETS ARE SIGNALLING A SOLID BULL RUN AHEAD
This paper aims to unpack recent activity in CME gold options market and its impact on prices. No contrary signals there either. Options market also signal bullish gold.
QuikStrike is a free-to-use tool for registered participants on the CME Group website. The tool provides a vast range of analytics to guide portfolio managers & traders to better comprehend the underlying market. Each report comes with a helpful user-guide to describe the data covered within the report.
Some key takeaways below:
Open Interest Profile page shows that as of close of markets on 11th February 2025, total call open interest (“OI” for short) stood at 634,815 lots across all expiries and strikes. Aggregate put IO totalled up to 357,305 lots resulting in a put-call ratio (p/c ratio) of 0.56.
Calls are options contract that represent a bullish view. While puts are contracts representing bearish outlook. At 0.56 p/c ratio, there are twice as many bullish positions for each bearish one.
Source: CME QuikStrike
Most Active Strikes allow portfolio managers and traders to analyse top strikes with shifts in open interest. Table below shows top 10 strikes registering the largest change in open interest between 4th February and 11th February.
Starting first with the Calls (left section of the table below), participants have been building up open interest in strikes 4000, 3200, 3250, 4500, 4032, and 3,975.
Call options have also booked reduction in open interest at strikes 3000, 3075, 3100 and 3025. On a net-basis, open interest is up 10,312 lots across these top ten strikes over various expiries this year.
Source: CME QuikStrike
Puts (right section of the table above) shows rising build up in open interest for strikes ranging from 2740 to 2880.
Collectively, this indicates that market participants are rooting for gold prices to rise through USD 3,000/oz and to even rally past USD 4,500/oz. Will that happen? Only time will tell.
Given that risk managers are establishing puts at such high levels point to strong support for gold prices at current levels.
In a nutshell, current prices are not only formidably comfortable but the potential to rise is also highly probable.
Shifting the attention to volatility, the CME Group also offers CVol which is another free-to-use tool. Portfolio managers and traders can visualise implied volatility behaviour on this tool.
Source: CME CVol
The GCVL which is the Gold CVol index shows implied volatility at 17.65 and with a positive skew of 1.08. Implied volatility easing even at an elevated prices indicates that market participants are comfortable at current price levels and do not foresee immediate large price moves.
Skew on the CVol tool is defined as Up Var minus Down Var. Up Var is the likelihood of the price rising while Down Var measures the likelihood of prices falling. A positive skew shows that the market is pricing a higher likelihood of rising prices relative to a down move.
FUND FLOWS INTO GOLD ETF IS UP 47% YOY
Among its rich set of features, TradingView also shows daily ETF fund flows . GLD is the prominent ETF commanding assets under management (AUM) of USD 80.65 billion.
This time last year, GLD ETF showed AUM of USD 54.77 billion. Fund inflows have spiked 47.25% over the past 12 months.
HYPOTHETICAL TRADE SETUP
With fundamentals, sentiment, options market, and fund flows all pointing to a price that is set to rise, this paper posits a long position using CME Micro Gold Futures expiring on 28th April 2025 (MGCJ2025) based on the following entry, exit levels and the reward-to-risk ratio:
• Entry: USD 2,900/oz
• Target: USD 3,100/oz
• Stop: USD 2,800/oz
• P&L at Target (USD per lot): +2,000 ((3,100 – 2,900) x 10)
• P&L at Stop (USD per lot): -1,000 ((2,800 – 2,900) x 10)
• Reward-to-Risk Ratio: 2x
Please note that Each Micro Gold Futures contract provides an exposure to 10 troy ounces.
Both standard-sized gold futures (GC) and the newly launched 1-ounce gold futures offer avenues to express bullish sentiment on the yellow metal. This comprehensive suite of gold futures is tailored to enhance flexibility and precision, empowering investors to capitalize on market opportunities effectively.
CME Group lists a raft of products covering a range of asset classes more accessible while also enabling granular hedging for portfolio managers.
Portfolio managers can learn more on how to access these micro products by visiting CME Micro Products page on CME portal to discover micro-sized contracts to gain macro exposures.
In collaboration with the CME Group, TradingView has launched The Leap trading competition. New and upcoming traders can hone and refine their trading skills, test their trading strategies, and feel the thrill of futures trading with a vibrant global community through this paper trading competition sponsored by CME Group using virtual money and real time prices.
The competition lasts another 15-days. Please join the 48,000+ others who are actively honing their trading skills using virtual money. Click here to learn more.
MARKET DATA
CME Real-time Market Data helps identify trading set-ups and express market views better. If you have futures in your trading portfolio, you can check out on CME Group data plans available that suit your trading needs tradingview.com/cme .
DISCLAIMER
This case study is for educational purposes only and does not constitute investment recommendations or advice. Nor are they used to promote any specific products, or services.
Trading or investment ideas cited here are for illustration only, as an integral part of a case study to demonstrate the fundamental concepts in risk management or trading under the market scenarios being discussed. Please read the FULL DISCLAIMER the link to which is provided in our profile description.

The 3rd Major Pivot in Gold’s Uptrend - Since Trade War in 2018We just witnessed the start of another pivot in gold when Trump won the U.S. presidential election in November 2024. My gold trading strategy has always focused on buying dips while keeping any short-selling opportunities short-term.
The chart above clearly illustrates three major V-shaped formations in gold. After each tariff or trade war, a V-shaped pattern formed in the same month the policy was initiated, followed by a subsequent uptrend.
Recently, I published a video analyzing other significant tariffs since the U.S.-China trade war began in 2018. We observed a consistent pattern: after each tariff or trade war, the same month of policy initiation saw the formation of a V-shaped trough, followed by an uptrend.
This time, the V-shaped trough occurred during the U.S. presidential election month. The right side of this V-shape was completed with the announcement of 25% tariffs on Canada and Mexico, signaling the expansion of the trade war beyond China.
The consequence of trade wars is inflation, and gold has historically served as a leading indicator of this trend.
If the trade war persists and intensifies, a continued uptrend in gold seems inevitable. Analyzing the long-term monthly chart using my parallel channel approach, we observed gold prices encountering resistance around $2,600 in September 2024 and beyond. However, by the close of January, the price action provided a clear confirmation of the ongoing gold uptrend. Gold firmly closed above $2,600, reaching $2,835 for COMEX Micro Gold Futures.
On the 3-hour chart, I have provided another set of parallel channels as a guide to track support and resistance levels as gold trends further.
As gold prices continue to climb, their notional value can become quite large for retail traders. COMEX Micro Gold Futures, being 1/10th the size of the regular gold contract, is a better option for me when the next buying opportunity arises. Recently, CME launched a new contract—a pocket-sized one-ounce gold contract. One key to successful trading is selecting the right contract size for oneself, which is crucial for effective risk management.
Once again, my strategy for gold remains the same: focus on buying dips while keeping any short-selling opportunities short-term.
Please see the following disclaimer and information that you may find useful:
Gold Contracts:
Gold Futures & Options
Ticker: GC
Minimum fluctuation:
0.10 per troy ounce = $10.00
Micro Gold Futures & Options
Ticker: MGC
Minimum fluctuation:
0.10 er troy ounce = $1.00
1Ounce Gold Futures
Ticker: 1OZ
Minimum fluctuation:
0.25 per troy ounce = $0.25
Disclaimer:
• What presented here is not a recommendation, please consult your licensed broker.
• My mission is to create lateral thinking skills for every investor and trader, knowing when to take a calculated risk with market uncertainty and a bolder risk when opportunity arises.
CME Real-time Market Data help identify trading set-ups in real-time and express my market views. If you have futures in your trading portfolio, you can check out on CME Group data plans available that suit your trading needs www.tradingview.com

XAUUSD - Push it to the Limit?!Happy (Asia session) Wednesday Y'all!
I am back with my first video of the new year & I'm really excited to start publishing videos again for y'all...
Let's dive in!
On the daily we are in a HUGE correction/ascending channel. So what am I looking for?
Bullish: I explained it in the video lol but a quick recap - push down to the 15m LQZ then push up to the 3rd touch of my trendline OR the 4H LQZ - we'll see how price shapes up
Bearish:
I want to see price come down to that same LQZ - push through AGGRESIVELY - followed by some consolidation in the form of a flag. It is on the flag that I am interested in looking for an entry
EZ-PZ y'all textbook trade! Just gotta be patient and actually WAIT FOR YOUR SETUP!! I will most likely post an update/recap so be on the lookout for that!
I hope this was informative and helped even just 1 of you traders out!! Thanks for watching!!
Happy Trading - Peace!

How to Manage Gold RisesGold is likely to continue its upward trend.
And how I have been managing it both as an investor and a trader for the Gold. I hope this tutorial will be helpful for two groups of people:
1. Those who already have some positions and would like to know how to accumulate more, and
2. Those who do not yet have a position but are considering getting in and trading it, though you may be worried about entering at a peak, as gold continues to reach new highs.
Micro Gold Futures & Options
Ticker: MGC
Minimum fluctuation:
0.10 per troy ounce = $1.00
Disclaimer:
• What presented here is not a recommendation, please consult your licensed broker.
• Our mission is to create lateral thinking skills for every investor and trader, knowing when to take a calculated risk with market uncertainty and a bolder risk when opportunity arises.
CME Real-time Market Data help identify trading set-ups in real-time and express my market views. If you have futures in your trading portfolio, you can check out on CME Group data plans available that suit your trading needs www.tradingview.com

How to Position if you Missed the Gold RallyGold prices have reached another all-time high, supported by strong bullish momentum. However, the composition of buyers has shifted. While central banks fuelled the previous phase of the rally, institutional investors and retail buyers are now leading. Over the past six months, ETF inflows have totalled nearly $5 billion, and asset managers continue to build net long positions, nearing the peak levels seen during the pandemic.
Despite the bullish outlook, higher prices are tempering demand and reducing the potential for future returns. As an alternative, investors can opt for a tactical position using CME Micro Gold futures and the Van Eck Gold Miners ETF (GDX).
RATE CUTS ARE A GOLD DRIVER
Over the past four easing cycles, gold prices have appreciated by 10% following the start of Fed rate cuts. This time around, prices are up 5% since the first rate cut in September. That leaves room for further gains as the Fed cuts further.
Still, it is crucial to consider that gold prices are already trading at an all-time-high. Higher prices are pressuring further gains and consumer demand.
According to Prithviraj Kothari, president of the India Bullion and Jewellers Association (IBJA), gold demand during this year’s festival season in India is likely to be 20% lower YoY in terms of quantity of gold purchased.
CENTRAL BANK BUYING NO LONGER THE DRIVING FACTOR
Since April, the People's Bank of China (PBoC) has halted gold purchases, while Poland and India acquired 24.3 tons and 17.7 tons of gold, respectively, between June and August, exceeding their purchases from March to May. However, the pace of buying from these central banks may be slowing. The latest data from the Reserve Bank of India (RBI) shows a decline in gold reserves by $98 million to $65.6 billion, indicating a slowdown in gold accumulation despite still substantial holdings.
One of the largest buyers of gold this year, Turkey, also slowed its pace of purchases as it acquired just 7.9 tons of gold between June and August compared to 27.6 tons between March and May.
Source: World Gold Council
Additionally, the urgency for central banks to buy gold has lessened. Earlier, rising yields and a strong U.S. dollar prompted increased gold buying. As U.S. interest rates decrease, a weakening dollar is expected.
ASSET MANAGERS NET LONG POSITIONING IS NEAR ALL-TIME-HIGH
Asset Manager net long positioning has increased consistently over the last six months. It is near the highest level since the pandemic and 2016. Crucially, the increase in long positioning has been driven by both increasing longs and declining shorts indicating bullish consensus among asset managers.
SUBSTANTIAL ETF INFLOWS OVER THE PAST 6 MONTHS
Gold ETFs listed in the US have accumulated USD 4.9 billion in inflows over the past 6 months. Inflows have grown by more than USD 1.7 billion since the Fed cut rates in September. While substantial outflows were observed on 8/Aug as global markets fell sharply, the decline was reversed in just 2 weeks.
Gold ETF inflows tend to follow cyclical patterns, and their current levels are relatively modest compared to previous inflow cycles, which have been significantly larger.
Substantial flows to gold ETFs and rallies in gold prices also tend to trigger flows into gold miner ETFs. Though these flows tend to lag flows into gold ETFs by several months.
GOLD MINERS HAVE STARTED TO CATCH UP
The outlook for gold remains mixed. While bullish momentum is supported by the anticipation of a Federal Reserve easing cycle, gold is already near all-time highs, which is discouraging further investment, particularly from retail investors.
A strategic way to capitalize on the later stages of a gold rally is through gold mining stocks. Gold miners typically lag behind gold during rallies, as returns from equities take longer to materialize and involve greater risk compared to direct gold investments. However, the impact of higher gold prices on miners' profitability is clear. In Q2 2024, Barrick, the world's largest gold miner, saw net income rise by 24% quarter-over-quarter, driven by a 13% increase in realized gold prices. Similarly, Newmont's net income increased by 32%, alongside a 12.3% rise in gold prices.
Gold miners are also benefiting from easing cost pressures. While costs remain high compared to last year due to inflation and energy-related increases, they improved in Q2, and further reductions are expected based on company guidance.
The gold to gold miner ratio is a cyclical quantity that has been trending higher for decades but also tends to mean-revert when the ratio edges to far in either direction.
As the ratio is due to cross the 200-week moving average, it may be due for an extended period of decline favouring gold miners.
HYPOTHETICAL TRADE SETUP
Gold remains bullish through the Fed easing cycle and strong investment demand provide momentum. However, higher prices are dampening consumer demand and central bank buying is slowing. Further increase in gold is likely, however, further gains may be limited. Gold prices have already realized half of their average increase following a rate cut.
Alternatively, a position that is long on gold miners also benefits from rising gold prices.
Gold prices, as tracked through gold futures, are highly correlated with gold miners, measured by ETFs like GDX and SGDM, with a correlation coefficient typically near 0.9, though there are occasional period breaks. Since December 2023, gold prices have outperformed SGDM by nearly 20% and GDX by 5%.
As the current gold rally progresses, increased flows into gold miner ETFs are expected to support their prices. Additionally, improving cost structures for miners and higher realized gold prices create positive momentum.
Investors can hedge a long position in GDX by taking a short position in CME Micro Gold futures. This hedge protects the ETF position against potential declines in gold prices. The smaller contract size of CME Micro Gold futures makes them ideal for precise hedging, particularly given the smaller unit size of ETFs like SGDM.
637 units of GDX (at a price of 43.15 as of 18/Oct) are balanced by a hedge of 1 CME Micro Gold futures contract expiring in December. CME Micro Gold Futures require margin of just USD 1,100 while the GDX leg requires notional of USD 27,470.
The position offers multiple income-generating advantages. The GDX ETF provides a net dividend yield of 0.65% (after accounting for the management fee), and the short position in CME Micro Gold futures benefits from contango, which adds approximately 1% per quarter.
The payoff scenarios for this position are provided below:
MARKET DATA
CME Real-time Market Data helps identify trading set-ups and express market views better. If you have futures in your trading portfolio, you can check out on CME Group data plans available that suit your trading needs tradingview.com/cme .
DISCLAIMER
This case study is for educational purposes only and does not constitute investment recommendations or advice. Nor are they used to promote any specific products, or services.
Trading or investment ideas cited here are for illustration only, as an integral part of a case study to demonstrate the fundamental concepts in risk management or trading under the market scenarios being discussed. Please read the FULL DISCLAIMER the link to which is provided in our profile description.

The ART of sitting ON YOUR HANDSI was not always a bear... but my arms are tired of holding these Silver Bags for over a decade. I am still bullish! In the long long term ( ;
I am still holding a longterm SILJ short position ( see previous post ) but the immediate future is not clear. Will we get an explosive rally leading up to... during... or after the FOMC? I would not bet on it. The truth is however that nobody knows. As Ray Dalio says, "He who lives by the crystal ball will eat shattered glass"
The next few weeks will provide a challenge for market timers and speculators. I expect plenty of whipsaw and broken hearts before a trend is established (bullish or bearish).
I am waiting for a break of 29.83 to become a Bull and enter Long
I am waiting for a break of 26.67 to become a Bear (a big one) and enter Short
I strongly recommend waiting for a daily close over these levels before getting to comfortable unless you are prepared to keep a tight stop and run for the hills if either of these breaks turn out to be a trap.
Until then this range (in between the two levels will provide plenty of juicy scalping opportunities for cowboys like myself. I am using the .382 Fib level 28.10 (derived from the Oct 23 Low to the High in May 24) as my guiding light and BABB (Bullish above Bearish below) in the interim with TPs at my key break levels. They will be formidable resistance/support zones until broken and proven otherwise. Happy trading!

Gold Challenges New High - Expecting More Upside Inflation was only keenly felt, especially after the pandemic in April 2021, when the CPI broke above 2% to 4.15%, and then quickly soared to a high of 9% in June 2022.
However, gold has been signaling impending inflation since the year 2000, which was 24 years ago. Currently, gold is also indicating further upside potential over the long term. What will be the implications for inflation and ultimately interest rates down the road?
Micro Gold Futures & Options
Ticker: MGC
Minimum fluctuation:
0.10 per troy ounce = $1.00
Disclaimer:
• What presented here is not a recommendation, please consult your licensed broker.
• Our mission is to create lateral thinking skills for every investor and trader, knowing when to take a calculated risk with market uncertainty and a bolder risk when opportunity arises.
CME Real-time Market Data help identify trading set-ups in real-time and express my market views. If you have futures in your trading portfolio, you can check out on CME Group data plans available that suit your trading needs www.tradingview.com

Double bottom on gold?Gold looks to have formed a double bottom potentially. The bullish butterfly harmonic, significant volume spike, and momentum indicators climbing create a potentially appealing setup.
There is of course one major caveat--a blow out employment roll print tomorrow could spike nominal yields (dragging real yields higher with them) which would put pressure on gold price again.
If going long here, keep a tight stop.

Solid set up for a U-turn on GoldGold is currently sitting @ support levels on two different trend lines on the daily chart, as well as a down fib extension with a high % of trend reversal to the upside. If it bounces here I'll be looking for an entry on the re-test and confirmation.


Gold in a bullflag - completion nearbyResistance held twice and gold has resumed its uptrend. It is in a clear bull flag since August of 2020. The next move will likely be faster than people expect.
I lean bullish.
Target: 1850
Timeframe: Mid April - Mid May
This is not financial advice.


Point of Control Supports Gold Futures$GC_F: the Point of Control since 3/23 (which was the bottom for $ES_F) has been a key pivot for five weeks. As long as it holds, the bulls are in charge. Swing lows as $1,680 provide secondary support. Fundamentals remain massively bullish.
