OSCR - This could be MASSIVE!NYSE:OSCR
Still doing my DD on this name but here are my thoughts on the technical side of the house.
Monthly Chart Analysis:
CupnHandle Breakout = $45 🎯
Bullish:
- CupnHandle forming
- At the first Volume Shelf with a GAP above
- In a bullish up trend
- Michael Burry bought at current prices
Bearish:
- S/R zone range is $10-$13.50
- Volume GAP down to $10ish
- Bottom of Bullish channel is $10ish
- Wr% is down-trending
My Opinion:
- I believe we will more than likely form a deeper handle due to the fact that the Wr% is down-trending. I've found that when we break above -20 and then start a bearish channel descent we get to -80 or to the green support beam before we bottom out and then bounce to the opposite end of the spectrum.
- This would bring us into the $10-12 range before we see a bounce.
- I believe this to be the case as we now have a red H5 Indicator that is almost making a bearish cross as well.
As I said I'm still doing my Fundamental DD on this name but if it does turn out to be fundamentally undervalued with a bright future then I would welcome this to fall further in order to buy more.
Not financial advice
Michaelburry

JD, Longing 6/7 months. CHINA COMEBACK IS REAL...Is China going for it?
Our best Shot is JD.COM, let´s take that shot!
Also the high volume during August 20th, seems Buying.

Where is the SPX most likely headed in the coming yearsAlthough it's hard to predict what the stock market will do in the future, there is already a clear consensus on what is likely to happen.
In this chart, I have plotted most predictions from big investment banks like Goldman Sachs and Morgan Stanley to other investors like Michael Burry. I have also calculated the average of all the predictions and plotted it on the chart.
I think the most likely scenario is that we retest the lows of the Corona Virus Crisis, and then we trade sideways from there (illustrated with the red arrows). There is also the probability that we bounce off the 3000 SPX as the consensus estimates and then trade sideways from there (illustrated with blue arrows).
The main reason we might trade sideways for the coming years is because of a dilemma the Federal Reserve is currently facing. Having to fight a battle between high inflation caused by quantitative easing done during the Coronavirus Crisis, and fighting said inflation by raising interest rates which will make it harder to maintain its 30 Trillion dollars of debt obligations. Likely changing back and forth till there is a deleveraging of the whole system that will last at least 3 years. And since the markets are strongly correlated to what the fed does, this will be the most likely outcome.
Let me know your predictions and see if you agree more with the blue arrows or red arrows.

Michael Burry is Wrong on This One!!! SELL ORCL!I love Michael Burry. He has some amazing calls and I'm always curious to see what he is up to, but obviously we're all human and make mistakes. His company Scion Asset Management started buying in the last quarter of last year as we're going into a 5th wave breakout. We have met three different objectives for a 5th wave target including divergence on the monthly chart. It's possible for an extended 5th wave, but more than likely not. My target is at least $82-$59, which is the .382 fib level of the entire move or bottom of wave 4. However, we will need to save a wave A unfold to determine a further target.

Why Burry Bet Against the US MarketBurry has frequently expressed his views on Twitter (X), asserting that the market has not made a genuine recovery and is headed for a recession. He believes it's just a matter of time before we witness the ultimate impact.
Many individuals consider Burry to be an extreme pessimist, contending that he consistently focuses on the negative aspects. However, in the lead-up to the 2008 market crash, people also criticized him for being overly pessimistic and opposed his ideas.
The purpose of this post is to delve into his perspectives and examine some recent information I've been investigating in order to determine whether the market situation is indeed in line with his claims
Who is Michael Burry?
Michael Burry is a renowned American investor and former hedge fund manager. He gained widespread recognition for accurately predicting the 2008 financial crisis and profiting from it through his hedge fund, Scion Capital. Burry is also known for his contrarian investment style and is a proponent of value investing. His story is prominently featured in Michael Lewis's book, "The Big Short.”
Today, we will examine data that reveals the current state of the American market. Through this data, we will learn to understand the reasons behind why the market may be weaker than it appears, despite all the hype and the notion that the American market has "recovered.”
What’s Burry Concerns
Economic Concerns: Despite positive stock market performance and GDP projections, Burry, along with other notable investors like Warren Buffett, sees potential issues in the global economy.
Federal Reserve Actions: Burry and others believe this situation is unsustainable and may lead to economic stagnation next year, characterized by weak growth, rising inflation, and labor shortages.
1. Michael Burry said is
Velocity is nominal GDP/Money Supply (M2 here). QT + higher rates starting to use M2 down. Yet we are seeing a tick up in velocity, emerging from narrative obscurity, In 1978-79, rising velocity trumped failing money supply to drive inflation higher and higher redux would shock
Full Explanation:
"Velocity" is like the speed at which money moves in the economy.
Imagine money as a car. The car's speed (velocity) is how fast it's moving.
"Nominal GDP" is the total value of goods and services produced in the economy.
"M2" is a measure of the money supply, including things like cash, checking accounts, and savings accounts.
Now, let's break it down:
If the economy's car (money) is moving faster (velocity), it can boost economic growth (Nominal GDP).
"QT" means Quantitative Tightening, which is when the central bank reduces the amount of money in the economy. "Higher rates" means they raise interest rates.
When you reduce the amount of money (QT) and raise interest rates, the car (money) slows down (Velocity decreases).
When you reduce the amount of money (QT) and raise interest rates, the car (money) slows down (Velocity decreases).
Recently, we've seen the car (Velocity) speeding up, even though the central bank has been reducing money (QT) and increasing interest rates.
In the late 1970s (1978-79), a similar thing happened. The car's speed (Velocity) became more important than the amount of money (Money Supply) in driving up prices (inflation).
"Redux" means a repeat of something. So, the statement suggests that if we see a repeat of the 1978-79 situation, it would be surprising and could lead to higher inflation.
In simple terms, it's like saying that even though the central bank is trying to slow down the economy by reducing money and raising interest rates, we're still seeing fast economic growth. This reminds us of a situation in the late 1970s when fast economic growth led to higher prices. If this happens again, it would be surprising and could cause inflation.
2.The second thing Burry believes is that there is a bubble in the housing market, similar to the one in 2008.
Instructions chat above
green (rising market)
yellow (small drop market)
Red (absolute bear market)
He believes that housing prices are over inflated and that many homeowners are still carrying significant levels of debt he is warned that a housing market downturn could trigger a wave of default that would Ripple through the banking system and The Wider economy finally bury has expressed concern about the vulnerability of the banking system which he believes is over leveraged and under-capitalized he has warned that a wave of bank failures could trigger a major crisis similar to the 2008 financial crisis overall buries prediction that another major financial crisis is on the horizon.
Explanation for chart above
As you can see from the chart , we are not yet showing strong signs of a collapse like in 2008. However, there is a chain of signs that it is beginning to slow down and approach a potential downturn.
When a higher time frame displays characteristics in yellow between red, there is a chance of an impending collapse.
For now, we must treat this information as neutral and avoid letting our biases guide us.
3.The Third thing is Burry concern about the current state of the stock market.
Instructions chat above
green (rising market)
yellow (small drop market)
Red (absolute bear market)
Bury has expressed concern about the current state of the stock market, the housing market, and the banking system, all of which he believes are overvalued and vulnerable to a major downturn. Burry has also expressed concern about the high levels of debt in the U.S. economy, which he believes are unsustainable and could trigger a major crisis. He has pointed to the rising levels of corporate and government debt, as well as the growing number of (companies that can only service their debt but not pay it down), as evidence of this. Burry has also expressed concern about the current state of the stock market, which he believes is again overvalued and driven by speculation rather than fundamentals.
Explanation for chart above
As you can see in the chart, the market has not yet fully recovered despite the recent increases in the S&P 500 and NASDAQ. It's evident that the rally is weak compared to previous years. This analysis indicates a temporary market weakening, with no strong signs of a full recovery at the moment
Let's now take a deeper dive into less visible yet crucial information. We'll focus on areas that require understanding their unusual aspects and the reasons behind them. What do I mean?
To uncover something unusual, patience and extensive economic research are required. Through this process, we can discover intriguing insights that provide valuable context to the economic situation in the USA.
For example, let's examine:
a. M2 - MONEY SUPPLY
In the graph, you'll notice something that hasn't occurred since 1963. With the help of a tool, we can observe periods of increase (green) and slight decrease (yellow), but no instances of absolute decrease (red).
What does this signify?
What's the context behind it? After conducting research, I found an explanation. I'm referring to:
Financial Stress and Banking Issues: A sharp decline in M2 may indicate underlying financial stress or problems within the banking and financial sector. This is a significant reason as it highlights potential vulnerabilities in the financial system, which could have broader implications for the economy. It might prompt regulators and policymakers to address these issues to prevent a more severe crisis.
Do you still find this unremarkable? Remember, this is just one perspective on the situation.
b. Unemployment Rate
It is crucial to examine the Unemployment Rate, and I've specifically focused on the Unemployment Rate in California. This is because, in the end, the fundamental Unemployment Rate tends to converge to a similar outcome.
Currently, in the graph, we observe the color white, which indicates the start of an uptick in unemployment, representing slow growth.
White denotes a slow growth momentum or a potentially deceptive rally.
Therefore, it's important to note that we have not yet reached the green phase, which signifies a definite increase in the Unemployment Rate. Historically, every time the Unemployment Rate has turned green, it has been followed by an economic downturn.
it is essential to remain vigilant. If the Unemployment Rate continues to rise steadily, it may lead to economic stress. On the other hand, if M2 money supply is shrinking or experiencing volatility while the Unemployment Rate is increasing, it points to economic stress and potential issues. A declining money supply reflects reduced liquidity, making it harder for businesses to access capital for growth and causing financial stress. Simultaneously, a rising Unemployment Rate indicates that more people are struggling to secure jobs, further straining the economy. This situation can result in reduced consumer spending, decreased investment, and heightened economic uncertainty, potentially contributing to a market downturn or recession.
c. Gold Investors
Currently, there's something intriguing happening among certain investors worldwide. Over the past few months, some investors have been stockpiling gold.
Since March 2023, gold has displayed a (green) signal, indicating a bullish trend. This suggests that people have been accumulating gold from March until now, similar to the trend seen in 2003.
It's possible that some investors perceive the market as risky and view gold as a safety net. However, it's important to note that there can be instances of deception, as seen in 2016 and 2017 when gold turned green but didn't perform significantly and even dropped by 10 percent on three occasions.
Such situations occur periodically and not consistently. For instance, investors also purchased gold from 2019 until the end of 2021 (despite the significant impact of COVID-19 starting in 2020), indicating that some investors can spot signs ahead of time.
There are more examples from the past. Hence, it's fascinating to closely monitor recent developments in the gold market to see if it can break records or experiences setbacks like in 2016-2017.
There are many more examples, but I will stop here. The purpose of this post is to emphasize that thinking outside the box is often more fruitful. Instead of sticking to a linear approach, gather as much information as possible, seek connections between two factors, then three, and continue to cross-reference vast datasets.
By effectively cross-referencing, we enhance our ability to assess probabilities and reduce uncertainty. This reflects my personal viewpoint.
I observe that the market has reached a plateau in the SP500, NASDAQ, and most markets. There is a possibility that this is a temporary phase, or it may indicate an impending decline. My focus is on monitoring real-time data and responding accordingly, rather than attempting to predict the future.
Whenever I perceive the market as (red), I take action. Likewise, when I see it as (green), I take action. Ultimately, my goal is to remain adaptable and respond to prevailing market conditions.
In the future, I will continue to provide updates in the event of shifts in market conditions, inflation, new data, and additional information. This will contribute to assembling a comprehensive puzzle that offers clarity on the overall situation.

QRTEA is in a bottleneckIt appears QRTEA is facing a bottleneck once we draw the bollinger band on a weekly basis, meaning low volatility, this situation usually do not take too long before it starts to widen up. We have a positive EMA Cross which can be considered as a bullish signal. If we take both indicators together, it may be possible to expect a maeaningful ride on price during these days or weeks.
Finally we know Michael Burry invested over $1.5M on this company during 2Q 2023 at $0.99, so he was (or is) optimistic about the future of this company at that price, thus considering the current price (which is 14% lower vs Burry's), is a great opportunity to capitalize on this. Stay alert.
Support: 0.80
Resistance: 1.2

Michael Burry Bets $1.6B On Market Crash - Dow Jones Down 500+Michael Burry has placed a substantial $1.6 billion bet on an imminent stock market crash, representing 90% of his firm's assets.
Known for his accurate prediction of the 2008 US housing market crash which netted him $100 million, Burry's recent move follows a 500-point drop in the Dow Jones in just two days.
Despite this downturn, the Dow Jones has shown a positive trend in 2023, rising over 1,500 points. It's vital for investors to discern between short-lived market shifts and long-term trends.
An in-depth analysis of the Dow Jones reveals a robust support level from December 2022 at $34,712, further reinforced by the daily 50 SMA just beneath.
This strong support could be pivotal in pushing the index upwards, potentially eclipsing its January 2022 record high of $36,952.

Unlocking Nasdaq 100 Insights: Michael Burry's Vision & IchimokuAnalyzing the monthly Ichimoku chart of the Nasdaq 100 index reveals potential insights that align with Michael Burry's expectations. Upon closer examination, the lagging indicator is situated within the price movement itself, hinting at possible future price action. A careful observation indicates the likelihood of a pullback until the kijun-san level, considering that the tenkan-san is positioned below the kijun-san. Moreover, the price's current positioning above the kijun-san is notable.
The cloud formation, characterized by its flat nature, holds significance. It suggests that the price might eventually breach the cloud, marking a pivotal point. This breach could trigger a series of events, potentially leading to panic selling. This chain of events might culminate in a retreat to a previously established strong support level, near the 5000 mark.
Taking a broader perspective, it seems plausible that Mr. Burry envisions the Nasdaq 100 index descending towards this level. This anticipation could be fueled by the absence of significant price corrections since the initiation of the bullish rally post-March 2009. Notably, the current price trend exhibits characteristics of potential change; despite the price resting above the cloud, both the cloud and the individual tenkan-san and kijun-san lines remain flat. Additionally, a red candle formation following a sequence of five consecutive green candles on the monthly chart suggests a shift in momentum.
In essence, considering these Ichimoku signals, there seems to be alignment with the notion that the Nasdaq 100 index might undergo a substantial correction, possibly drawing it closer to the support level at around 5000. This analysis underscores the complexity of the current market dynamics and the potential for shifts in sentiment and price direction.

I bought this Burry play that has a nice setupAs they say, "When you don't know what to do, just copy Burry."
He bought at a much higher price than where we are at now and it's at this long term support line, so it seems like a good spot to buy.
I got in at $55.40 and I have two targets, a 10% gain that is around where Burry's average is from last quarter and my ideal target between $65-68.
Stop is a 4.87% loss at $52.69, which gives a nice risk/reward of 2 if the first target is reached.

QRTEA, another cyclical peak?Since 2015 this stock has reached a peak every 3 years approximately, as it happened in 2018 and 2021, this time it could happen again around mid 2024 as the price has plumbed drastically, reaching an all-time low.
If this is true, then price could be around 7 to 10 dollars during 2024. If "Project Athens" is succcesfful and the company is able to regain profitability, generate cash, keep good levels of revenues and make a sound transition to streaming and ecommerce, then this stock could recover and gain a strong terrain as before.
How long do you think this downtrend will continue?

GEO GROUP Is Michael Burry right to bet big on this stock?Dr Michael Burry, famous for predicting the 2008 Housing Crisis and shorting the market, is the majority holder on the Geor Group Inc (GEO). The price broke a week ago above the 1W MA200 (orange trend-line) for the first time in more than 3 years (since June 2019) and that alone constitutes major news.
A quick application of Dr Jean-Paul Rodrigue "Phases of a Bubble" model, strengthens even more buying GEO at this stage as it appears that the price has gone through the (final) Despair Phase and is now well above the Mean to start a new Bull Cycle.
Is he right yet again?
-------------------------------------------------------------------------------
** Please LIKE 👍, SUBSCRIBE ✅, SHARE 🙌 and COMMENT ✍ if you enjoy this idea! Also share your ideas and charts in the comments section below! This is best way to keep it relevant, support me, keep the content here free and allow the idea to reach as many people as possible. **
-------------------------------------------------------------------------------
You may also TELL ME 🙋♀️🙋♂️ in the comments section which symbol you want me to analyze next and on which time-frame. The one with the most posts will be published tomorrow! 👏🎁
-------------------------------------------------------------------------------
💸💸💸💸💸💸
👇 👇 👇 👇 👇 👇

GEO: Michael Burry bought more GEO
Michael Burry has bought more shares of this REIT so I thought I'd give a look at the chart for those who want to follow him.
What the chart is saying:
Big downtrend since May 2017. In May 2021, the stock has started a consolidation/base in form of a range between 5.5 and 9.54.
This range could be a bottom formation.
Note that bottoming pattern takes time and this one could continue for a few more weeks/months. However a break out of the range (9.54) could confirm a change of trend and a long trade/investment.
Keep monitoring this stock in the next few days/weeks, set an alert at the top of the range. If it breaks out of the range, the first potential targets are 11, 13.90 and 17.
I remain neutral for now. On watch.

Michael Burry buying GEO - Chart reviewToday you can review the technical analysis idea on a 1D linear scale chart for Geo Group Inc (GEO).
Michael Burry's investment in Geo Group Inc seems to be paying off. Price may be headed towards $11. Keeping a close eye on this one. Falling channel breakout and above the 200 SMA. Resistance around $11.
fortune.com
If you enjoy my ideas, feel free to like it and drop in a comment. I love reading your comments below.
Disclosure: This is just my opinion and not any type of financial advice. I enjoy charting and discussing technical analysis. Don't trade based on my advice. Do your own research! #millionaireeconomics

Sustainable Breakout?Break out from resistance, not sure if Michael burry still holding on to this company.

SPY Monthly Testing Parabolic CurveSpy Monthly curve... testing levels of support... once break, Fibs can be measured for retracements. ie .236 or .618 etc. see how next week plays out.

Apple (AAPL) - Taking a bite out of its Market CapGood Day. We've seen recently in the markets, an over-exuberant reaction to the possibility of the Fed inexplicably changing course, in the face of generationally-high levels of inflation, that threatens to become endemic, and create longer-term problems for the US (and other global) economy.
Mr Market may have realised they could have got their bets 'slightly wrong'.
And these past few weeks, we've been tracking Apple - taking profits, and exiting completely in anticipation of THIS move.
Forget cognitive bias and your emotions - sometimes you can be bearish on the broader market, and yet still bullish on the stock. If that's the case, depending on the weakness of the broader market, it may be time to sell, take profits and wait for the next opportunity to scale in.
Let me know what you see in the charts above.
Order Flow, Liquidity, Market Structure = all the confluences we use and need to know, when trading.
Check our profile if you're interested - we look to post regularly here, and we're also posting frequently on our other platforms. Cheers.
Best,
Figuring Out Finance

Nasdaq TopNotable figures such as Michael Burry and Puru Saxena have taken opposing sides on what this rally means. I enjoy how Burry made a very hedged statement... noting that at 23% it was within average but did not imply the Nasdaq's rise itself predicted the future. Puru took a more affirmative view that this was more than a bear market rally.
Today's intraday price action on CME_MINI:NQ1! was a morning sell off down to support:
Price counteryeeted at an Overnight low Inflection Point into a sharp rally which has been all too common in the last many trading days.
But that price action showed the signs of a false breakout here after a long, extended rally. The Spike fits my rules and must be taken. With a stop above today's high the risk is fixed and a proper 3 to 1 down to a 50% Retracement of the recent move up from August 9th. CME_MINI:NQ1! .

GEOThe crash from ATH's looks about finished, HTF ABC bullish correction. I would think we now impulse 5 up. If that turns into an A wave then there is much more pain. If we do 3 up here and only hit $10 then this would be an X wave and the price action did a fib extension 1 to 1 and would expect much more downside.

TAN Invesco Solar ETF They have at their disposal the trend since 2008 as well as a key support zone and resistance.
Thank you for your support, greetings.
L.E.D in Spain as of 06/21/2022

ProShares Short Dow30 Is The US market crash coming ?Is The US market crash coming ?
We have 3 types of “crashes”
Correction <15% downward movement in a major indicy
Bear Market <20% downward movement in a major indicy
Black Swan event, something very unexpected that tanks the market, think 1987, 1929, challenger disaster, 911 and so on.
The fourth type is the 1919, 1929, 1999 and 2008 scenario that people generally refer to as a “crash” 2022 a new one ?
Sincereley L.E.D
In Spain 14/05/2022

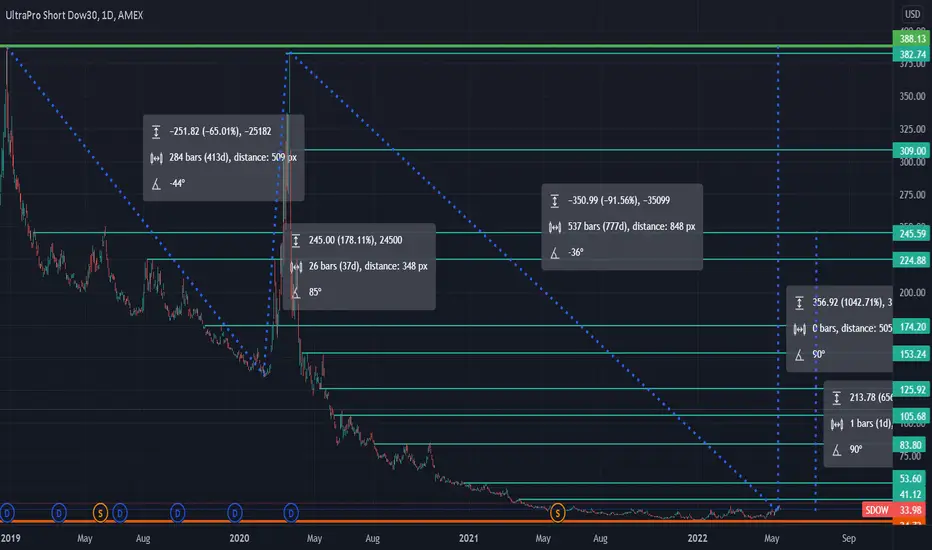
ProShares UltraPro Short Dow 30 ETF Is The US market crash ?Is The US market crash coming ?
We have 3 types of “crashes”
Correction <15% downward movement in a major indicy
Bear Market <20% downward movement in a major indicy
Black Swan event, something very unexpected that tanks the market, think 1987, 1929, challenger disaster, 911 and so on.
The fourth type is the 1919, 1929, 1999 and 2008 scenario that people generally refer to as a “crash” 2022 a new one ?
Sincereley L.E.D
In Spain 14/05/2022
ProShares UltraShort QQQ. Is The US market crash coming ? Is The US market crash coming ?
We have 3 types of “crashes”
Correction <15% downward movement in a major indicy
Bear Market <20% downward movement in a major indicy
Black Swan event, something very unexpected that tanks the market, think 1987, 1929, challenger disaster, 911 and so on.
The fourth type is the 1919, 1929, 1999 and 2008 scenario that people generally refer to as a “crash” 2022 a new one ?
Sincereley L.E.D In Spain 14/05/2022

Direxion Daily Small Cap Bear 3X Short. Is The US market crash?Is The US market crash coming ?
We have 3 types of “crashes”
Correction <15% downward movement in a major indicy
Bear Market <20% downward movement in a major indicy
Black Swan event, something very unexpected that tanks the market, think 1987, 1929, challenger disaster, 911 and so on.
The fourth type is the 1919, 1929, 1999 and 2008 scenario that people generally refer to as a “crash” 2022 a new one ?
Sincereley L.E.D In Spain 14/05/2022
