How to Identify Head and Shoulders?How to identify head and shoulders patterns?
We’ll use the current example from the Nasdaq or the US markets. We can quite clearly observe that a potential head and shoulders formation is developing. This means that if the price breaks below the neckline, we may see a deeper correction from the April low.
I will go through the rules on how to identify a head and shoulders formation.
We will also cover how to recognize when the pattern is invalid — meaning the market may continue pushing above its all-time high.
Finally, we’ll discuss how we can position ourselves early, before waiting for a break below the neckline for confirmation.
Micro Nikkei Futures
Ticker: MNQ
Minimum fluctuation:
0.25 index points = $0.50
Disclaimer:
• What presented here is not a recommendation, please consult your licensed broker.
• Our mission is to create lateral thinking skills for every investor and trader, knowing when to take a calculated risk with market uncertainty and a bolder risk when opportunity arises.
CME Real-time Market Data help identify trading set-ups in real-time and express my market views. If you have futures in your trading portfolio, you can check out on CME Group data plans available that suit your trading needs www.tradingview.com
Trading the Micro: www.cmegroup.com
www.cmegroup.com
Microfutures

Russell Leads Equities HigherEquity markets saw a positive day today with the Russell leading the way higher being up over 1.5% on the session. For the S&P and Nasdaq, this was the third session in a row with a higher high, and the 200-day moving average has acted as a floor in these markets since the breakout higher on May 12th. CPI numbers came out for Europe and came in worse than expected, and then the JOLTs data released later in the day was a better than expected figure and equites saw prices rise throughout the day.
Outside markets also saw movement today with Crude Oil strength continuing up over 1% on the session and closing out above the 50-day moving average for the July contract. The Crude Oil market has not seen the recovery that equities did from the breakdown in early April, and are still trading below the breakdown point. Along with Crude Oil, crypto futures had a strong day today, with XRP trading up over 4% and Solana and Ether both rising over 2.5% on the session. Tomorrow traders will get a look at ADP Nonfarm Employment Change along with manufacturing data before the critical jobs data at the end of the week.
If you have futures in your trading portfolio, you can check out on CME Group data plans available that suit your trading needs tradingview.com/cme/
*CME Group futures are not suitable for all investors and involve the risk of loss. Copyright © 2023 CME Group Inc.
**All examples in this report are hypothetical interpretations of situations and are used for explanation purposes only. The views in this report reflect solely those of the author and not necessarily those of CME Group or its affiliated institutions. This report and the information herein should not be considered investment advice or the results of actual market experience.

Precious Metals Leading Charge HigherStarting off the week today, traders are seeing many markets moving higher with the precious metals and energy markets leading the way. Gold futures over 2.5% on the session while Silver led the charge higher being up nearly 5%, and the Crude Oil market saw gains north of 3% while Natural Gas was up over 7% on the session. Equity markets traded slightly higher on the session but did not see the volatility seen in the precious metals or energy markets.
Looking at the economic data today, there was a big slate of data coming out of the U.S. looking at ISM manufacturing and S&P Global manufacturing that came in worse than expected. Tomorrow, traders will get a look at CPI coming out of Europe and JOLTs data here in the U.S. that could add additional volatility to the precious metals for the rest of the week. Along with that, the CVOL for Silver still remains very wide as seen below, and looking back over the past year shows that the volatility is relatively low compared to the current underlying price even with the spike traders saw today.
If you have futures in your trading portfolio, you can check out on CME Group data plans available that suit your trading needs tradingview.com/cme/
*CME Group futures are not suitable for all investors and involve the risk of loss. Copyright © 2023 CME Group Inc.
**All examples in this report are hypothetical interpretations of situations and are used for explanation purposes only. The views in this report reflect solely those of the author and not necessarily those of CME Group or its affiliated institutions. This report and the information herein should not be considered investment advice or the results of actual market experience.

Weather and Corn: A Deep Dive into Temperature Impact1. Introduction: Corn and Climate – An Inseparable Relationship
For traders navigating the corn futures market, weather isn't just a background noise—it's a market mover. Few agricultural commodities are as sensitive to environmental variables as corn, especially temperature. Corn is grown across vast regions, and its development is directly tied to how hot or cold the season plays out. This makes weather not just a topic of interest but a core input in any corn trader’s playbook.
In this article, we go beyond conventional wisdom. Instead of simply assuming “hotter equals bullish,” we bring data into the equation—weather data normalized by percentile, matched with price returns on CME Group's corn futures. The results? Useful for anyone trading ZC or MZC contracts.
2. How Temperature Affects Corn Physiology and Yields
At the biological level, corn thrives best in temperatures between 77°F (25°C) and 91°F (33°C) during its growth stages. During pollination—a critical yield-defining window—extreme heat (especially above 95°F / 35°C) can cause irreversible damage. When hot weather coincides with drought, the impact on yields can be catastrophic.
Historical drought years like 2012 and 1988 serve as powerful examples. In 2012, persistent heat and dryness across the US Midwest led to a national yield drop of over 25%, sending futures skyrocketing. But heat doesn't always spell disaster. Timing matters. A heat wave in early June may have little impact. That same wave during tasseling in July? Major consequences.
3. The Market Mechanism: How Traders Respond to Temperature Surprises
Markets are forward-looking. Futures prices don’t just reflect today’s weather—they reflect expectations. A dry June may already be priced in by the time USDA issues its report. This dynamic creates an interesting challenge for traders: separating noise from signal.
During July and August—the critical reproductive phase—temperature updates from NOAA and private forecasters often trigger major moves. Rumors of an incoming heat dome? Corn futures might gap up overnight. But if it fizzles out, retracements can be just as dramatic. Traders who rely on headlines without considering what’s already priced in are often late to the move.
4. Our Analysis: What the Data Reveals About Corn and Temperature
To cut through the fog, we performed a percentile-based analysis using decades of weather and price data. Rather than looking at raw temperatures, we classified each week into temperature “categories”:
Low Temperature Weeks: Bottom 25% of the historical distribution
Normal Temperature Weeks: Middle 50%
High Temperature Weeks: Top 25%
We then analyzed weekly percentage returns for the corn futures contract (ZC) in each category. The outcome? On average, high-temperature weeks showed higher volatility—but not always higher returns. In fact, the data revealed that some extreme heat periods were already fully priced in, limiting upside.
5. Statistically Significant or Not? T-Tests and Interpretation
To test whether the temperature categories had statistically significant impacts on weekly returns, we ran a t-test comparing the “Low” vs. “High” temperature groups. The result: highly significant. Corn returns during high-temperature weeks were, on average, notably different than those during cooler weeks, with a p-value far below 0.01 (4.10854357245787E-13).
This tells us that traders can't ignore temperature anomalies. Extreme heat does more than influence the narrative—it materially shifts price behavior. That said, the direction of this shift isn't always bullish. Sometimes, high heat correlates with selling, especially if it’s viewed as destructive beyond repair.
6. Strategic Takeaways for Corn Traders
Traders can use this information in several ways:
Anticipatory Positioning: Use temperature forecasts to adjust exposure ahead of key USDA reports.
Risk Management: Understand that volatility spikes in extreme temperature conditions and plan stops accordingly.
Calendar Sensitivity: Prioritize weather signals more heavily in July than in May, when crops are less vulnerable.
Combining weather percentile models with weekly return expectations can elevate a trader’s edge beyond gut feel.
7. CME Group Corn Futures and Micro Corn Contracts
Corn traders have options when it comes to accessing this market. The flagship ZC futures contract from CME Group represents 5,000 bushels of corn and is widely used by commercial hedgers and speculators alike. For those seeking more precision or lower capital requirements, the recently launched Micro Corn Futures (MZC) represent just 1/10th the size.
This fractional sizing makes temperature-driven strategies more accessible to retail traders, allowing them to deploy seasonal or event-based trades without excessive risk exposure.
Here are some quick key points to remember:
Tick size for ZC is ¼ cent (0.0025) per bushel, equating to $12.50 per tick.
For MZC, each tick is 0.0050 equating to $2.50 per tick.
Standard ZC initial margin is approximately $1,000 and MZC margins are around $100 per contract, though this can vary by broker.
8. Wrapping Up: Temperature's Role in a Complex Equation
While temperature is a key driver in corn futures, it doesn't act in isolation. Precipitation, global demand, currency fluctuations, and government policies also play crucial roles. However, by quantifying the impact of extreme temperatures, traders gain a potential edge in anticipating market behavior.
Future articles will expand this framework to include precipitation, international weather events, and multi-variable models.
This article is part of a broader series exploring how weather impacts the corn, wheat, and soybean futures markets. Stay tuned for the next release, which builds directly on these insights.
When charting futures, the data provided could be delayed. Traders working with the ticker symbols discussed in this idea may prefer to use CME Group real-time data plan on TradingView: www.tradingview.com - This consideration is particularly important for shorter-term traders, whereas it may be less critical for those focused on longer-term trading strategies.
General Disclaimer:
The trade ideas presented herein are solely for illustrative purposes forming a part of a case study intended to demonstrate key principles in risk management within the context of the specific market scenarios discussed. These ideas are not to be interpreted as investment recommendations or financial advice. They do not endorse or promote any specific trading strategies, financial products, or services. The information provided is based on data believed to be reliable; however, its accuracy or completeness cannot be guaranteed. Trading in financial markets involves risks, including the potential loss of principal. Each individual should conduct their own research and consult with professional financial advisors before making any investment decisions. The author or publisher of this content bears no responsibility for any actions taken based on the information provided or for any resultant financial or other losses.

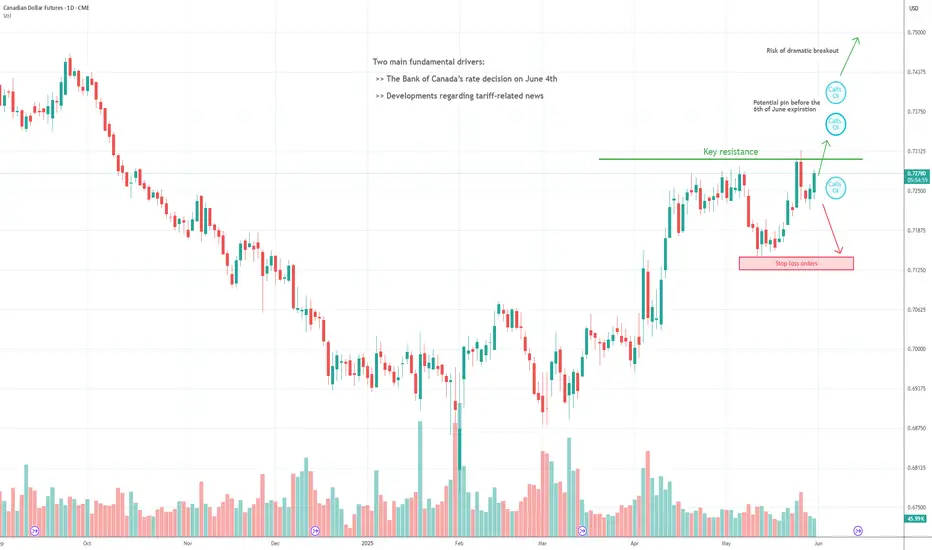
Action Plan for the Next Big MoveThe Canadian Dollar (CAD) is trading around 0.725, caught in a rare balance where clear conviction is elusive and volatility appears to be compressing, beneath the surface, the stage is set for a potentially explosive move. With the Bank of Canada set to announce its policy decision next week and trade issues with the US still simmering, the market feels poised for a major breakout, even as the immediate backdrop remains subdued.
Fundamental Analysis: Waiting Game with Trade Tension
All eyes are on the Bank of Canada’s upcoming decision. The policy rate, having dropped to 2.75% after a string of seven cuts, now stands at its lowest level in nearly three years. The latest inflation print (1.7%) supports a cautious stance, and the market is pricing in a 70% chance of no change. Yet, this calm could be deceptive: should inflation slip further or job data disappoint, talk of renewed easing will return quickly.
Canada’s deep trade relationship with the United States means any change in tariff policy is especially consequential. Although a US court recently ruled in favor of Canada, experts warn that the broader tariff debate is far from over. Any fresh escalation or, conversely, an easing of trade tensions could move the CAD sharply in either direction. Meanwhile, a mild rebound in oil prices adds some support, but the real driver remains policy and politics.
For now, fundamentals argue for patience, with no strong directional bias until the next catalyst emerges.
Technical Analysis: Tight Range, But Pressure Is Building
Price action has settled into a well-defined range after the sharp volatility of late May. The contract retreated to the point of control at 0.7220, absorbing liquidity and confirming this zone as reliable short-term support. On the upside, repeated failures above 0.73, including rejection wicks earlier this week, highlight strong resistance and a market not yet ready to commit to a sustained trend.
Despite the lack of a decisive move, this compression phase often precedes an outsized breakout, especially with macro catalysts on the horizon.
Sentiment Analysis: Crosswinds, Not Clarity
Institutional flows show a recent uptick in short positions on the CAD, while retail sentiment appears balanced to slightly bullish CAD (short USD/CAD), reflecting indecision. The VIX, now close to its annual average, signals that risk appetite is neutral, there’s little evidence of panic or euphoria. This cocktail leaves the CAD without a clear consensus but suggests that when conviction returns, the move could be sharp.
Listed Options Analysis: Pin Risk, Gamma Potential, and the Calm Before Volatility
The monthly options board reveals significant open interest in calls clustered between 0.7350 and 0.74 for the next expiration, the 6th of June, while downside protection is less pronounced. Implied volatility, though lower than recent extremes, remains elevated compared to historical averages, and there’s a mild bias toward downside hedges. If spot moves above 0.73, options dynamics could quickly flip, fueling an upside acceleration toward 0.7350 or even higher, as dealers are forced to chase delta hedges. A pin at these strikes is possible if the move is not explosive, but a genuine breakout could be dramatic.
Trade Idea: Flexibility Over Forecasting
With so many crosscurrents and volatility compressing, the market appears primed for a breakout. Rather than forcing a directional bet, the most rational approach is to prepare for both outcomes with clear levels.
Bullish Breakout Scenario
Entry: Buy above 0.7320 (daily close or strong breakout confirmation)
Stop: 0.7245 (below recent support)
Target 1: 0.7395 (OI cluster)
Target 2: 0.7500 (psychological level)
Bearish Breakdown Scenario
Entry: Sell below 0.7220 (daily close or strong breakout confirmation)
Stop: 0.7310 (above the prior resistance)
Target: 0.7145 (recent lows/retail stops)
Rather than predict, this approach lets price action dictate. Volatility may be low for now, but context argues that a range breakout, especially to the upside, could be sudden and violent given options positioning and macro uncertainty.
With policy on pause, trade headlines pending, and options open interest suggesting magnetic levels higher, the CAD sits on the edge of potential. As volatility compresses, the market’s indecision is itself the clearest signal: the next major move, when it comes, is likely to be fast and fueled by positioning. Flexibility, not bias, is the trader’s greatest edge in this environment. Be ready for it.
When charting futures, the data provided could be delayed. Traders working with the ticker symbols discussed in this idea may prefer to use CME Group real-time data plan on TradingView: tradingview.com/cme/.
This consideration is particularly important for shorter-term traders, whereas it may be less critical for those focused on longer-term trading strategies.
General Disclaimer:
The trade ideas presented herein are solely for illustrative purposes forming a part of a case study intended to demonstrate key principles in risk management within the context of the specific market scenarios discussed. These ideas are not to be interpreted as investment recommendations or financial advice. They do not endorse or promote any specific trading strategies, financial products, or services. The information provided is based on data believed to be reliable; however, its accuracy or completeness cannot be guaranteed. Trading in financial markets involves risks, including the potential loss of principal. Each individual should conduct their own research and consult with professional financial advisors before making any investment decisions. The author or publisher of this content bears no responsibility for any actions taken based on the information provided or for any resultant financial or other losses.
Japanese Markets: Still a Buy?Are Japanese markets still a buy after rising 170% since the pandemic, surpassing their roaring 1980s levels?
The reason why Japanese stocks have become some of the best-performing equities in Asia is largely due to the falling yen — a depreciation of around 60%. A weaker yen boosts Japan’s major exporters, as their overseas earnings convert into higher yen profits.
But what’s the downside? Inflation. (expand)
Yes, they wanted inflation, below 2% yoy will be ideal, but not at this rate of growth at 3.5%.
Micro Nikkei Futures
Ticker: MNI
Minimum fluctuation:
5.00 index points = ¥250
Disclaimer:
• What presented here is not a recommendation, please consult your licensed broker.
• Our mission is to create lateral thinking skills for every investor and trader, knowing when to take a calculated risk with market uncertainty and a bolder risk when opportunity arises.
CME Real-time Market Data help identify trading set-ups in real-time and express my market views. If you have futures in your trading portfolio, you can check out on CME Group data plans available that suit your trading needs www.tradingview.com
Trading the Micro: www.cmegroup.com
www.cmegroup.com

NQ Breakdown Plan: 3 Targets, 1 Setup, No Chasing🧠 NQ Short Plan – NY Open Game Plan
Price has pulled back into a key structure zone, and I’m watching closely for a sell setup during the first two hours of the New York session tomorrow.
📌 My trade plan is simple:
I want a solid pullback first — not chasing here.
If I get a clean sell trigger (candle confirmation or momentum flush), I’m in.
Break-even gets locked in once we break the 21,349 area.
From there, I’ll take profits in three stages and trail the stop behind price if we get momentum.
🔐 Break-Even Lock: 21,349
✅ TP #1 – 21,200
✅ TP #2 – 21,050
✅ TP #3 – 20,800 (final leg if sellers step in hard)
The rising trendline break could be the domino. If it cracks, we roll.
But if bulls defend again, no trade — discipline first.
📅 Session Focus: Only trading this setup if it unfolds in the first 2 hours of NY open. After that, I’m out.
No chasing. No revenge. Just execution.
💬 Let me know if you’re watching this level too — or if you see something different. Always open to alternate perspectives.

Markets Lower Ahead of Nvidia Earnings Equity Indices traded loEquity Indices traded lower on the session today after seeing strong gains yesterday to start the week with the Russell leading the downside pressure being down near 1%. The FOMC minutes were released this afternoon and showed that the Fed was comfortable with rates remaining unchanged for the time being, and equity markets fell while traders saw Bond Yields trade higher. Gold, Silver and Copper also saw losses on the session with Copper leading the selling pressure being down near 1.5%.
The big news today came after the bell with Nvidia reporting earnings, where they saw a beat on both EPS and Revenue, and the S&P and Nasdaq are seeing some after hours gains. There was news this afternoon as well where President Trump ordered US chip designers to stop selling software to China, which could have longer term effects on the global supply and demand. Looking ahead for the rest of the week, traders will see key economic data looking at jobs and GDP that can add volatility to the equity indices and outside markets like the precious metals or crypto markets.
If you have futures in your trading portfolio, you can check out on CME Group data plans available that suit your trading needs tradingview.com/cme/
*CME Group futures are not suitable for all investors and involve the risk of loss. Copyright © 2023 CME Group Inc.
**All examples in this report are hypothetical interpretations of situations and are used for explanation purposes only. The views in this report reflect solely those of the author and not necessarily those of CME Group or its affiliated institutions. This report and the information herein should not be considered investment advice or the results of actual market experience.

OPEC Countdown: Inverted H&S Signals Potential Oil Price Rise🧭 Market Context – OPEC in Focus
As Crude Oil Futures (CL) grind in tight consolidation, the calendar reminds traders that the next OPEC meeting takes place on May 28, 2025. This is no ordinary headline event — OPEC decisions directly influence global oil supply. From quota adjustments to production cuts, their moves can rapidly shift price dynamics across energy markets. Every tick in crude oil reflects not just current flows but also positioning ahead of such announcements.
OPEC — the Organization of the Petroleum Exporting Countries — coordinates oil policy among major producers. Its impact reverberates through futures markets like CL and MCL (Micro Crude), where both institutional and retail traders align positions weeks in advance. This time, technicals are speaking loud and clear.
A compelling bottoming structure is taking shape. The Daily timeframe reveals an Inverted Head and Shoulders pattern coinciding with a bullish flag, compressing into a potential breakout zone. If momentum confirms, CL could burst into a trend move — just as OPEC makes its call.
📊 Technical Focus – Inverted H&S + Flag Pattern
Price action on the CL daily chart outlines a classic Inverted Head and Shoulders — a reversal structure that traders often monitor for high-conviction setups. The neckline sits at 64.19, and price is currently coiled just below it, forming a bullish flag that overlaps with the pattern’s right shoulder.
What makes this setup powerful is its precision. Not only does the flag compress volatility, but the symmetry of the shoulders, the clean neckline, and the breakout potential align with high-quality chart pattern criteria.
The confirmation of the breakout typically requires trading activity above 64.19, which would trigger the measured move projection. That target? Around 70.59, which is near a relevant UFO-based resistance level — a region where sellers historically stepped in with force (UnFilled Orders to Sell).
Importantly, this bullish thesis will fail if price drops below 60.02, the base of the flag. That invalidation would potentially flip sentiment and set up a bearish scenario with a target near the next UFO support at 53.58.
To properly visualize the dual scenario forming in Crude Oil, a multi-timeframe approach is often very useful as each timeframe adds clarity to structure, breakout logic, and entry/exit positioning:
Weekly Chart: Reveals two consecutive indecision candles, reflecting hesitation as the market awaits the OPEC outcome.
Daily chart: Presents a MACD bullish divergence, potentially adding strength to the reversal case.
Zoomed-in 4H chart: Further clarifies the boundaries of the bullish flag.
🎯 Trade Plan – CL and MCL Long/Short Scenarios
⏫ Bullish Trade Plan:
o Product: CL or MCL
o Entry: Break above 64.19
o Target: 70.59 (UFO resistance)
o Stop Options:
Option A: 60.02 (tight, under flag)
Option B: ATR-based trailing stop
o Ideal for momentum traders taking advantage of chart pattern combined with fundamental data coming out of an OPEC meeting
⏬ Bearish Trade Plan:
o Trigger: Break below 60.02
o Target: 53.58 (UFO support)
o Stop Options:
Option A: 64.19 (tight, above flag)
Option B: ATR-based trailing stop
o Ideal for momentum traders fading pattern failures
⚙️ Contract Specs – CL vs MCL
Crude Oil can be traded through two futures contracts on CME Group: the standard CL (WTI Crude Oil Futures) and the smaller-sized MCL (Micro WTI Crude Oil Futures). Both offer identical tick structures, making MCL a powerful instrument for traders needing more flexibility in position sizing.
CL represents 1,000 barrels of crude per contract. Each tick (0.01 move) is worth $10, and one full point of movement equals $1,000. The current estimated initial margin required to trade one CL contract is approximately $6,000 per contract, although this may vary based on market volatility and brokerage terms.
MCL, the micro version, represents 100 barrels per contract — exactly 1/10th the size of CL. Each 0.01 tick move is worth $1, with one point equaling $100. The estimated initial margin for MCL is around $600, offering traders access to the same technical setups at significantly reduced capital exposure.
These two contracts mirror each other tick-for-tick. MCL is ideal for:
Testing breakout trades with lower risk
Scaling in/out around events like OPEC
Implementing precise risk management strategies
Meanwhile, CL provides larger exposure and higher dollar returns but requires tighter control of risk and account drawdowns. Traders can choose either—or both—based on their strategy and account size.
🛡️ Risk Management – The Foundation of Survival
Technical setups don’t make traders profitable — risk management does.
Before the OPEC meeting, traders must be aware that volatility can spike, spreads may widen, and whipsaws can invalidate even the cleanest chart pattern.
That’s why stop losses aren’t optional — they’re mandatory. Whether you choose a near level, a deeper stop below the head, or an ATR-based trailing method, the key is clear: define risk before entry.
MCL helps mitigate capital exposure for those testing breakout confirmation. CL demands higher margin and greater drawdown flexibility — but offers bigger tick rewards.
Precision also applies to exits. Targets must be defined before entry to maintain reward-to-risk discipline. Avoid adding to losers or chasing breakouts post-event.
And most importantly — never hold a losing position into an event like OPEC, hoping for recovery. Risk is not a gamble. It’s a calculated variable. Treat it with respect.
When charting futures, the data provided could be delayed. Traders working with the ticker symbols discussed in this idea may prefer to use CME Group real-time data plan on TradingView: www.tradingview.com - This consideration is particularly important for shorter-term traders, whereas it may be less critical for those focused on longer-term trading strategies.
General Disclaimer:
The trade ideas presented herein are solely for illustrative purposes forming a part of a case study intended to demonstrate key principles in risk management within the context of the specific market scenarios discussed. These ideas are not to be interpreted as investment recommendations or financial advice. They do not endorse or promote any specific trading strategies, financial products, or services. The information provided is based on data believed to be reliable; however, its accuracy or completeness cannot be guaranteed. Trading in financial markets involves risks, including the potential loss of principal. Each individual should conduct their own research and consult with professional financial advisors before making any investment decisions. The author or publisher of this content bears no responsibility for any actions taken based on the information provided or for any resultant financial or other losses.

Stuck in a Squeeze, Fade the TopAs the Australian Dollar, a currency traditionally correlated with risk, has been trading in a range since mid-April, fading rallies near the top of that range appears to offer the best odds in the current environment. Here’s the breakdown.
Fundamental Analysis
The Australian Dollar continues to move without clear direction as the Reserve Bank of Australia (RBA) pursues a clearly dovish path. The RBA’s most recent 25bp rate cut, bringing the official cash rate down to 3.85%, was justified by the central bank’s confidence that inflation is returning to target, coupled with lingering global uncertainties. According to the RBA Rate Tracker, markets are now assigning a 70% probability to yet another 25bp rate cut at the next meeting, an outlook that continues to weigh heavily on AUD yields and the currency’s appeal.
On the other side of the Pacific, the CME FedWatch Tool shows that traders do not expect any policy easing from the Federal Reserve before late summer at the earliest. This means the US-Australia interest rate differential is likely to increase, making it even more expensive to hold AUD against the greenback.
Compounding the challenges for the Aussie is the ongoing economic slowdown in China, Australia’s largest trading partner. With Chinese demand for commodities muted, there is little external support for the AUD.
Technical Analysis
Technically, after a sharp rebound in early April, the Aussie has remained stuck in a frustratingly tight range, unable to regain any significant upward momentum. Since its highs at the end of September, the currency is still down almost 7%. Price action has been confined to a broad consolidation zone between 0.6350 and 0.65 USD for over a month, with sellers consistently capping rallies at the upper end.
The volume profile analysis reveals a heavy concentration of traded volume in the 0.6440–0.6465 band, reinforcing this area as a significant battle zone where sellers are likely to defend their ground. For the bulls to regain control, a sustained break above 0.6520 would be needed, something that appears unlikely in the current macro context.
Sentiment Analysis
From a positioning perspective, the CFTC’s Commitment of Traders (COT) report shows that large speculators continue to hold net short positions in the Aussie, signaling ongoing professional bearish bias.
Retail sentiment paints a similarly contrarian picture: broker data from FX/CFD platforms indicates a slim majority of retail traders remain long AUD/USD, with some brokers showing more than 70% long positions. This crowded long condition means there is still fuel for further downside, especially if key support levels give way. Notably, retail stop losses are clustered between 0.6400 and 0.6350, and these could act as accelerants if triggered by a downside break.
In addition, risk sentiment remains fragile. While the VIX has eased somewhat, it struggles to remain sustainably below 20, a sign that investor nerves are still on edge and defensive flows are likely to persist.
Listed Options Analysis
The options market continues to reinforce the idea that rallies will struggle to gain traction. Open interest on call options remains heavily concentrated above spot, particularly at the 0.6500, 0.6525, 0.6550, and 0.6600 strikes, creating a robust technical ceiling. This makes it difficult for the Aussie to stage any sharp or lasting rallies.
In contrast, open interest on put options is moderate and scattered, with the largest concentrations around 0.6400 and 0.6450, but there is no significant put wall below spot. The put/call open interest ratio is close to parity, indicating a relatively balanced positioning between calls and puts, with no strong directional bias from the options market.
Implied volatility for the front month remains elevated around 9.8–10.1%, and the risk reversal remains slightly negative, suggesting a modest preference for downside protection, but markets are not in panic mode. The heavy concentration of call OI above spot still introduces some gamma risk: if the market rallies into the 0.6500–0.6550 zone, a short squeeze could briefly occur, but such moves are likely to encounter renewed selling pressure and fade quickly.
Trade Idea
With the RBA set to remain dovish, China’s demand subdued, and global risk aversion remaining elevated, the Aussie remains a tactical short on rallies. The macro, technical, and sentiment picture all favor a bearish stance.
Entry: Short Australian Dollar (6AM5) on rallies to 0.6440–0.6465
Stop: 0.6520 (just above high-volume node and call OI cluster)
Target: 0.6350 (support, stop loss cluster below 0.64)
The trade provides a risk/reward ratio close to 2:1, thanks to a tight stop above resistance and a realistic profit target near support.
However, the outlook could change if the Fed pivots more dovishly than expected after the recent Moody’s downgrade of US debt. The FX landscape could shift rapidly and trigger a covering rally in AUD/USD.
For now, though, the odds favor playing from the short side. We’ll monitor stops closely and be ready to adapt if the macro winds start to shift.
When charting futures, the data provided could be delayed. Traders working with the ticker symbols discussed in this idea may prefer to use CME Group real-time data plan on TradingView: tradingview.com/cme/.
This consideration is particularly important for shorter-term traders, whereas it may be less critical for those focused on longer-term trading strategies.
General Disclaimer:
The trade ideas presented herein are solely for illustrative purposes forming a part of a case study intended to demonstrate key principles in risk management within the context of the specific market scenarios discussed. These ideas are not to be interpreted as investment recommendations or financial advice. They do not endorse or promote any specific trading strategies, financial products, or services. The information provided is based on data believed to be reliable; however, its accuracy or completeness cannot be guaranteed. Trading in financial markets involves risks, including the potential loss of principal. Each individual should conduct their own research and consult with professional financial advisors before making any investment decisions. The author or publisher of this content bears no responsibility for any actions taken based on the information provided or for any resultant financial or other losses.

Gold at 100 Times its Price - A Psychological LevelGold has now risen to 100 times its previously fixed price of $35 per ounce.
Is this a psychological milestone signaling a correction ahead, or is there still more upside potential?
Under the Gold Reserve Act of 1934, gold was officially priced at $35, a rate maintained until 1971, when President Nixon suspended the dollar’s convertibility into gold, effectively ending the gold standard. This historic move, known as the “Nixon Shock,” allowed gold to trade freely in the market. By December the same year, the market price had already climbed to around $43–44 per ounce.
So why has gold risen from $35 to $3,500?
Micro Gold Futures & Options
Ticker: MGC
Minimum fluctuation:
0.10 per troy ounce = $1.00
Disclaimer:
• What presented here is not a recommendation, please consult your licensed broker.
• Our mission is to create lateral thinking skills for every investor and trader, knowing when to take a calculated risk with market uncertainty and a bolder risk when opportunity arises.
CME Real-time Market Data help identify trading set-ups in real-time and express my market views. If you have futures in your trading portfolio, you can check out on CME Group data plans available that suit your trading needs www.tradingview.com
Trading the Micro: www.cmegroup.com
www.cmegroup.com

Swiss Shield: Buy the DipThe tariff agreement that seemingly fell from the Geneva sky earlier this month convinced investors to pivot toward risk-linked assets, allowing the Swiss currency to retreat temporarily. However, the Franc’s safe-haven status, combined with the fragile balance currently settling over the markets, leads us to view this pullback as a tactical opportunity to buy at attractive levels.
Fundamental Analysis
While there are indeed factors that could support a continued weakening of the Franc, such as the interest rate differential between the U.S. and Switzerland, which might spark carry trade flows in favor of the dollar, experienced investors know better than to rely solely on interest rates to navigate the complexities of currency markets. Beneath the surface lies a dense web of competing incentives and mechanisms.
True, the Swiss National Bank (SNB) has repeatedly warned of a possible return to negative rates since the beginning of the year, and is due to announce its next policy decision on June 19. The market currently expects a 25-basis-point rate cut, from 0.25% to 0%, prompted by persistently weak inflation data.
And yet, the Swiss Franc has gained nearly 8% in 2025, proof that the erratic trade stance of the White House and the unpredictable temperament of its new occupant are outweighing rate differentials and continuing to boost safe-haven demand, with the Franc at the top of the list.
Despite this week’s much-publicized announcements, which so far apply only for 90 days, the medium-term outlook remains highly unstable. Trying to guess the next provocation from the U.S. president is anyone’s game. Of course, interpreting market price action is never straightforward, but that task becomes even murkier when populism takes root at the highest levels of decision-making.
It’s also worth remembering that U.S. tariffs remain historically high despite the recent agreement with China. According to Yale’s research lab, and based on some fairly sophisticated modeling, the effective U.S. tariff rate is still at its highest level since 1934.
In this environment, the Swiss Franc seems well-positioned to retain favor among currency traders as part of a classic fly-to-quality move in times of uncertainty.
The main risk here lies in the SNB's willingness, or lack thereof, to actively weigh on the Franc in an attempt to revive sluggish inflation. But for now, it's far from clear that the central bank is prepared to return to such controversial tactics, especially given its past accusations of exchange rate manipulation.
Technical Analysis
From a technical standpoint, the Franc’s recent retreat has opened up a compelling buying opportunity. Earlier this week, prices dropped to around 1.1850, precisely filling a low-volume area that hadn’t been revisited since April 10.
Upon hitting this support, algorithmic strategies that specialize in gap-filling stepped in aggressively, with rising volume confirming the reaction. The rebound could continue, especially with reported corporate interest accumulating in the 1.1950–1.1980 zone, according to various trading chat channels.
The next significant resistance stands around 1.2250, a level that has repeatedly capped upward moves since April 23.
Sentiment Analysis
Starting with the CFTC Commitment of Traders (COT) report, asset managers have remained net short on the Franc for several years. However, this positioning is typically driven by hedging needs, such as covering equity portfolios, rather than directional conviction. As historical data shows, these short exposures rarely prevent the Swiss currency from rallying.
On the retail side, aggregated data from various FX/CFD brokers shows that individual traders, whose positioning is often used as a contrarian indicator, remain heavily long USD/CHF, and therefore short the Franc. In some cases, this proportion exceeds 90%. Such crowding could provide fuel for a short squeeze if the market turns.
Finally, the VIX has drifted back below the psychological 20 mark following recent developments, after previously surging above 50 last month, levels not seen since the pandemic. This presents a paradox: on one hand, volatility appears to be easing, but on the other, the broader situation remains unstable, with markets hanging on every word from Donald Trump.
Trade Idea
In summary, the fundamental, technical, and sentiment-based analyses all suggest that the recent dip to 1.1850 was more likely an emotional overreaction to headlines than the beginning of a structural downtrend. Despite some headwinds, notably the SNB’s close attention to the exchange rate, the Franc’s safe-haven appeal continues to outweigh other catalysts in a market where volatility remains fragile and unstable.
Entry: Long Swiss Franc futures (6SM5) at current levels
Stop: Daily close below 1.1850, which would invalidate the key support based on volume profile structure
Target: 1.2250, a resistance level that has already been tested multiple times since late April, offering a solid risk/reward setup.
When charting futures, the data provided could be delayed. Traders working with the ticker symbols discussed in this idea may prefer to use CME Group real-time data plan on TradingView: tradingview.com/cme/.
This consideration is particularly important for shorter-term traders, whereas it may be less critical for those focused on longer-term trading strategies.
General Disclaimer:
The trade ideas presented herein are solely for illustrative purposes forming a part of a case study intended to demonstrate key principles in risk management within the context of the specific market scenarios discussed. These ideas are not to be interpreted as investment recommendations or financial advice. They do not endorse or promote any specific trading strategies, financial products, or services. The information provided is based on data believed to be reliable; however, its accuracy or completeness cannot be guaranteed. Trading in financial markets involves risks, including the potential loss of principal. Each individual should conduct their own research and consult with professional financial advisors before making any investment decisions. The author or publisher of this content bears no responsibility for any actions taken based on the information provided or for any resultant financial or other losses.

Soybeans: The Global Protein Powerhouse🟡 1. Introduction
Soybeans might not look like much at first glance — small, round, unassuming. But behind every bean lies a global story of protein demand, export flows, and economic policy.
They feed livestock, fuel vehicles, nourish entire populations, and move markets. In fact, soybeans sit at the intersection of agriculture, industry, and geopolitics — making them one of the most actively traded and strategically watched commodities in the world.
If you’re looking to understand how soybeans move markets — and how you can trade them effectively — this article is your starting point.
🌍 2. Why the World Cares About Soybeans
Few agricultural commodities carry the weight soybeans do. Their importance spans both the food and energy sectors — and their global footprint is enormous.
Here’s why they matter:
Protein Meal: After processing, about 80% of the soybean becomes high-protein meal used to feed poultry, pigs, and cattle.
Soybean Oil: Roughly 20% is extracted as oil — a key ingredient in cooking, industrial products, and increasingly, biodiesel.
Biofuels: As the push for renewable energy grows, soybean oil plays a major role in sustainable fuel strategies.
Top producers:
United States — historically the world’s largest producer.
Brazil — now rivals or exceeds U.S. production in some years.
Argentina — a dominant player in soybean meal and oil exports.
Top importers:
China — imports over 60% of globally traded soybeans.
EU, Mexico, Japan — also large buyers.
Soybeans are a bridge commodity — connecting livestock feed, food manufacturing, and renewable energy. That’s why traders from Chicago to Shanghai watch every yield forecast and export announcement closely.
💹 3. CME Group Soybean Contracts
Soybeans trade on the CME Group’s CBOT platform, with two main futures products:
o Standard Soybeans
Ticker: ZS
Size = 5,000 bushels
Tick = 0.0025 = $12.50
Margin = ~$2,150
o Micro Soybeans
Ticker: MZS
Size = 500 bushels
Tick = 0.0050 = $2.50
Margin = ~$215
Soybean futures are among the most actively traded agricultural contracts, offering deep liquidity, tight spreads, and excellent volatility for strategic traders. Keep in mind that margins are subject to change — always confirm with your broker. Micro contracts are ideal for scaling in/out of trades or learning market structure without large capital risk.
📅 4. The Soybean Calendar
Soybeans follow a seasonal cycle that creates rhythm in the market — and a potential edge for informed traders.
In the United States:
🌱 Planting: Late April to early June
☀️ Pod development / blooming: July and early August (weather-sensitive)
🌾 Harvest: September through November
In Brazil:
🌱 Planting: October to December
🌾 Harvest: February through April
This staggered calendar means that soybean markets have multiple weather risk windows each year. It also means the export flows and global pricing dynamics shift between the Northern and Southern Hemispheres throughout the calendar year.
That’s why soybeans tend to have two major volatility windows — mid-summer (U.S. crop concerns) and early Q1 (South American weather). Traders often build seasonal strategies around these patterns — buying weakness before key USDA reports, fading rallies during overbought harvests, or trading futures spreads between U.S. and Brazilian supply flows.
🔄 5. How Soybeans Are Traded Globally
Soybeans move through a complex international web of growers, crushers, exporters, and consumers. As a trader, understanding this flow is essential — because each node introduces price risk, opportunity, and reaction points.
Key players:
o Hedgers:
U.S. and Brazilian farmers hedge production risk using futures or options on futures.
Exporters hedge shipping schedules against fluctuating basis and FX risk.
o Crushers:
Companies like Cargill or Bunge buy soybeans to crush into meal and oil.
Crush margin (aka “board crush”) affects demand and influences futures spreads.
o Speculators:
Institutional funds trade soybeans as a macro or relative value play.
Retail traders use micro contracts (MZS) to capture directional or seasonal moves.
o China:
Its purchasing pace (or sudden cancellations) can move markets dramatically.
Announcements of bulk U.S. purchases could trigger short-covering rallies.
Additionally, soybeans are sometimes traded indirectly via their by-products:
Soybean Meal (ZM)
Soybean Oil (ZL)
These contracts often lead or lag ZS based on demand shifts in feed or fuel.
📈 6. What Makes Soybeans Unique to Trade
Compared to wheat and corn, soybeans are:
More weather-sensitive during July and August (especially to drought and heat).
More globally integrated, thanks to China’s dominant import role.
More complex, due to crush dynamics and multiple end-use markets.
This multifaceted nature is why many professional traders monitor soybeans, even if they aren’t actively trading them every week.
📌 7. Summary / Takeaway
Soybeans are one of the most important — and most tradable — commodities in the world. They feed livestock, fuel industry, and anchor the agricultural markets across two hemispheres.
Their unique role in food, fuel, and feed makes them more than just another contract — they’re a barometer for global health, demand, and policy.
Whether you’re trading the standard ZS contract or getting started with MZS, mastering soybeans means understanding weather, trade flows, product demand, and seasonality.
🧭 This article is part of our agricultural futures trading series.
📅 Watch for the next release: “Weather and Corn: A Deep Dive into Temperature Impact”
When charting futures, the data provided could be delayed. Traders working with the ticker symbols discussed in this idea may prefer to use CME Group real-time data plan on TradingView: www.tradingview.com - This consideration is particularly important for shorter-term traders, whereas it may be less critical for those focused on longer-term trading strategies.
General Disclaimer:
The trade ideas presented herein are solely for illustrative purposes forming a part of a case study intended to demonstrate key principles in risk management within the context of the specific market scenarios discussed. These ideas are not to be interpreted as investment recommendations or financial advice. They do not endorse or promote any specific trading strategies, financial products, or services. The information provided is based on data believed to be reliable; however, its accuracy or completeness cannot be guaranteed. Trading in financial markets involves risks, including the potential loss of principal. Each individual should conduct their own research and consult with professional financial advisors before making any investment decisions. The author or publisher of this content bears no responsibility for any actions taken based on the information provided or for any resultant financial or other losses.

Food Prices Since Liberation Day - Is Up with Tariffs or PausedWhat is happening to the food prices since liberation day.
Soybeans are a benchmark for food prices — not only because China and many of us consume large quantities, but also because the U.S. exports a significant amount to China.
After the Liberation Day announcement on 2nd April, soybean prices initially dropped but quickly rebounded and surged higher.
Even after a successful trade agreement between the U.S. and China — which reduced reciprocal tariffs for 90 days — soybean prices continued to climb.
So why do food prices seem to trend higher, whether tariffs are in place or paused?
Micro Soybean Futures
Ticker: MZS
Minimum fluctuation:
0.0050 per bushel = $2.50
Disclaimer:
• What presented here is not a recommendation, please consult your licensed broker.
• Our mission is to create lateral thinking skills for every investor and trader, knowing when to take a calculated risk with market uncertainty and a bolder risk when opportunity arises.
CME Real-time Market Data help identify trading set-ups in real-time and express my market views. If you have futures in your trading portfolio, you can check out on CME Group data plans available that suit your trading needs www.tradingview.com
Trading the Micro: www.cmegroup.com

Divergence Since 2020 - What Happens When Bonds Continue?When Stocks & Bond Move Opposite Direction what does it mean?
We have observed a divergence between the stock and bond markets since 2020. While U.S. Treasury bonds entered a bear zone, the stock markets continued their upward climb. What are the implications of this decoupling?
Will the stock market resume its uptrend and hit new highs? Or is this merely a retracement before further downward pressure?
A healthy, three-way interdependent relationship occurs when the economy, bonds, and stocks move in the same direction. When investors have confidence in the U.S. economy, they tend to invest in long-term bonds, which it usually will benefits the stock market.
This alignment was evident between 2000 and 2020, during which bonds and stocks moved largely in tandem.
However, from 2020 onward, bonds began declining—signaling a loss of investor confidence in the economy. Technically, this should exert downward pressure on stocks as well.
Yet, we are witnessing a divergence: Where U.S. Treasury bonds have fallen while stocks have continued to rise.
When such a divergence surfaces, it signals the need for caution in our approach in the stock markets.
What could be the other reasons why US T-bond has peaked in 2020 and depreciated by 44% since then?
Micro E-mini Nasdaq Futures and Options
Ticker: MNQ
Minimum fluctuation:
0.25 index points = $0.50
Disclaimer:
• What presented here is not a recommendation, please consult your licensed broker.
• Our mission is to create lateral thinking skills for every investor and trader, knowing when to take a calculated risk with market uncertainty and a bolder risk when opportunity arises.
CME Real-time Market Data help identify trading set-ups in real-time and express my market views. If you have futures in your trading portfolio, you can check out on CME Group data plans available that suit your trading needs www.tradingview.com
Trading the Micro: www.cmegroup.com

The Yen’s Comeback Starts Here—and it Seems the COT Knew First1. Introduction: A Market Everyone Gave Up On
For a while, the Japanese Yen looked like a lost cause. After topping out in early 2021, Yen futures (6J1!) began an unrelenting slide, shedding value week after week like an old coat in spring. Traders stopped asking, “Where’s support?” and started asking, “How low can it go?”
The macro backdrop didn’t help. The Bank of Japan clung to ultra-loose monetary policy, even as the Fed hiked aggressively. Speculators piled on shorts. The Yen was a one-way ticket down, and no one seemed interested in punching the brakes.
But beneath that apathy, a quieter shift was underway. While price kept bleeding, trader positioning began to hint at something different—something the chart didn’t show yet. And if you were watching the Commitments of Traders (COT) report closely enough, you might’ve seen it.
2. The COT Trend That No One Was Watching
The COT report isn’t glamorous. It’s slow, lagging by a few days, and rarely makes headlines. But for those who track what the big players are doing—those large enough to be required to report their positions—it’s a treasure trove of subtle clues.
One of those clues is Total Reportable Positions. This metric tells us how active large market participants really are—regardless of whether they’re long or short. When that number is dropping, it suggests the “big dogs” are losing interest. When it starts climbing again? Someone’s gearing up to play.
From 2021 through most of 2024, Total Reportable Positions in 6J were in a steady decline—mirroring the slow death of the Yen's bullish case. But in late 2024, something changed. Using a simple linear regression channel on this COT data, a clear breakout emerged. Positioning was picking up again—for the first time in nearly three years.
And it wasn’t just a bounce. It was a structural shift.
3. Did Price Listen?
Yes—and no. Price didn't immediately explode higher. But the structure began to change. The market stopped making new lows. Weekly closes began to cluster above support. And importantly, a Zig Zag analysis started marking a pattern of higher lows—the first signs of accumulation.
Here’s where the chart really gets interesting: the timing of the COT breakout coincided almost perfectly with a key UFO support at 0.0065425—a price level that also marked the bottom in COT Traders Total Reportable Longs. This adds a powerful layer of confirmation: institutional orders weren’t just showing up in the data—they were leaving footprints on the chart.
And above? There’s a UFO resistance level at 0.0075395. If the Yen continues to climb, that could be a significant price level where early longs may choose to lighten up.
4. The Contract Behind the Story
Before we go deeper, let’s talk about what you’re actually trading when you pull the trigger on Yen Futures.
The CME Japanese Yen futures (6J) contract represents 12.5 million Japanese Yen, and each tick move—just 0.0000005 per JPY—is worth $6.25. It’s precise, it’s liquid, and for traders who like to build macro positions or take advantage of carry flows, it’s a staple.
As of May 2025, margin requirements hover around ~$3,800 (Always double-check with your broker or clearing firm—these numbers shift from time to time.)
But maybe you’re not managing seven-figure accounts. Maybe you just want to test this setup with more flexibility. That’s where the Micro JPY/USD Futures (MJY) come in.
Contract size: 1/10th the size of 6J
Tick move: 0.000001 per JPY increment = $1.25
Same market structure, tighter margin requirement around ~$380 per contract
Important note: The COT report aggregates positioning across the whole futures market—it doesn’t separate out micro traders from full-size. So yes, the data still applies. And yes, it still matters.
5. Lessons from the Shift
This isn’t about hindsight bias. The value in this setup isn’t that the Yen happened to bounce—it’s how Total Reportable Positions broke trend before price did.
Here are the real takeaways:
COT data may or may not be predictive—but it is insightful. When positioning starts expanding after a long contraction, it often signals renewed interest or risk-taking. That’s tradable information.
Technical support and resistance as well as highs and lows give context. Without them, COT breakouts can feel theoretical. With them, you have real, observable UFO levels where institutions may act—and where you can plan.
6. Watchlist Insights: Where This Might Work Again
You don’t have to wait for another yen setup to apply this framework. The same structure can help you scout for early positioning shifts across the CME product universe.
Here’s a simple filter to start building your own COT watchlist:
✅ Look for markets where:
Price has been in a long, clean downtrend (or uptrend)
Total Reportable Positions are falling—but starting to reverse
A breakout occurs in positioning trend (draw a regression channel and watch for a clean violation)
A key support or resistance lines up with recent extremes in COT positioning
Whether it's crude oil, corn, or euro FX, this template gives you a framework for exploration.
🎯 Want to See More Setups Like This?
We’re just getting started. If this breakdown opened your eyes to new ways of using COT reports, UFO levels, and multi-dimensional trade setups, keep watching this space.
When charting futures, the data provided could be delayed. Traders working with the ticker symbols discussed in this idea may prefer to use CME Group real-time data plan on TradingView: www.tradingview.com - This consideration is particularly important for shorter-term traders, whereas it may be less critical for those focused on longer-term trading strategies.
General Disclaimer:
The trade ideas presented herein are solely for illustrative purposes forming a part of a case study intended to demonstrate key principles in risk management within the context of the specific market scenarios discussed. These ideas are not to be interpreted as investment recommendations or financial advice. They do not endorse or promote any specific trading strategies, financial products, or services. The information provided is based on data believed to be reliable; however, its accuracy or completeness cannot be guaranteed. Trading in financial markets involves risks, including the potential loss of principal. Each individual should conduct their own research and consult with professional financial advisors before making any investment decisions. The author or publisher of this content bears no responsibility for any actions taken based on the information provided or for any resultant financial or other losses.

When Stocks & Bond Move Opposite Direction - Its implicationWhen Stocks & Bond Move Opposite Direction what does it mean?
We have observed a divergence between the stock and bond markets since 2020. While U.S. Treasury bonds entered a bear zone, the stock markets continued their upward climb. What are the implications of this decoupling?
Will the stock market resume its uptrend and hit new highs? Or is this merely a retracement before further downward pressure?
Micro E-mini Nasdaq Futures and Options
Ticker: MNQ
Minimum fluctuation:
0.25 index points = $0.50
Disclaimer:
• What presented here is not a recommendation, please consult your licensed broker.
• Our mission is to create lateral thinking skills for every investor and trader, knowing when to take a calculated risk with market uncertainty and a bolder risk when opportunity arises.
CME Real-time Market Data help identify trading set-ups in real-time and express my market views. If you have futures in your trading portfolio, you can check out on CME Group data plans available that suit your trading needs www.tradingview.com
Trading the Micro: www.cmegroup.com

Breadbasket Basics: Trading Wheat Futures🟡 1. Introduction
Wheat may be a breakfast-table staple, but for traders, it’s a globally sensitive asset — a commodity that reacts to geopolitics, climate patterns, and shifting demand from dozens of countries.
Despite its critical role in food security and its status as one of the most traded agricultural commodities, wheat is often overlooked by traders who focus on corn or soybeans. Yet wheat offers a unique combination of liquidity, volatility, and macro sensitivity that makes it highly attractive for both hedgers and speculators.
If you’re new to trading wheat, this guide gives you a solid foundation: how the wheat market works, who the key players are, and what makes wheat such a dynamic futures product.
🌍 2. Types of Wheat and Where It Grows
One of the first things traders need to understand is that wheat is not a single, uniform product. It’s a diverse group of grain types, each with its own characteristics, end uses, and pricing dynamics.
The major classes of wheat include:
Hard Red Winter (HRW): High-protein wheat grown in the central U.S. — used in bread and baking.
Soft Red Winter (SRW): Lower protein, used for pastries and crackers.
Hard Red Spring (HRS): Grown in the Northern Plains; prized for high gluten content.
Durum Wheat: Used for pasta, grown mainly in North Dakota and Canada.
White Wheat: Grown in the Pacific Northwest; used for noodles and cereals.
Each class responds differently to weather, demand, and regional risks — giving traders multiple ways to diversify or hedge.
Major global producers include:
United States
Russia
Canada
Ukraine
European Union
Australia
India
These regions experience different planting and harvesting calendars — and their weather cycles are often out of sync. This creates trading opportunities year-round.
🛠️ 3. CME Group Wheat Contracts
Wheat futures are traded on the Chicago Board of Trade (CBOT), part of the CME Group.
Here are the two key contracts:
o Standard Wheat
Ticker: ZW
Size = 5,000 bushels
Tick = 0.0025 = $12.50
Margin = ~$1,750
o Micro Wheat
Ticker: MZW
Size = 500 bushels
Tick = 0.0050 = $2.50
Margin = ~$175
Keep in mind that margins are subject to change — always confirm with your broker. Micro contracts are ideal for scaling in/out of trades or learning market structure without large capital risk.
📅 4. Wheat’s Seasonality and Supply Chain
Unlike corn or soybeans, wheat is planted and harvested across multiple seasons depending on the variety and geography.
In the U.S., winter wheat (HRW and SRW) is planted in the fall (September–November) and harvested in early summer (May–July). Spring wheat (HRS) is planted in spring (April–May) and harvested late summer.
Globally, things get even more staggered:
Australia’s wheat is harvested in November–December
Ukraine and Russia harvest in June–August
Argentina’s crop comes off the fields in December–January
This scattered global schedule means news headlines about one country’s weather or war (think Ukraine in 2022) can quickly shift sentiment across the entire futures curve.
📈 5. Who Trades Wheat and Why
Wheat is traded by a wide range of participants — each with their own objectives and strategies. Understanding their behavior can give you an edge in anticipating market moves.
Commercial hedgers:
Farmers lock in prices to protect against adverse weather or market crashes.
Grain elevators and exporters use futures to manage inventory risk.
Flour mills hedge their input costs to protect profit margins.
Speculators:
Hedge funds and CTAs trade wheat based on global macro trends, weather anomalies, or technical setups.
Retail traders increasingly use micro contracts to gain exposure to agricultural markets with lower capital risk.
Spread traders bet on pricing differences between wheat classes or harvest years.
🔍 For retail traders especially, micro contracts like XW open the door to professional markets without oversized exposure.
🧠 6. What Makes Wheat Unique in Futures Markets
Wheat is often considered the most geopolitically sensitive of the major grains. Here’s why:
Price can spike fast — even on rumor alone (e.g., export bans or missile strikes near ports).
Production risks are global — the market reacts not just to the U.S. crop, but to conditions in Russia, Ukraine, and Australia.
Storage and quality matter — protein levels and moisture content affect milling demand.
Unlike corn, wheat doesn’t have a single dominant industrial use (like ethanol). This means food demand is king, and food security often drives policy decisions that affect futures pricing.
📌 7. Summary / Takeaway
Wheat may not get as much media attention as corn or soybeans, but it’s a deeply important — and deeply tradable — market. Its global footprint, class differences, and sensitivity to weather and politics make it a must-know for serious agricultural futures traders.
Whether you're just starting out or looking to diversify your trading playbook, understanding wheat is an essential step. Learn its rhythms, follow its news, and respect the fact that every crop cycle brings a new story to the market.
🧭 This article is part of an ongoing educational series exploring futures trading in agricultural commodities.
📅 Watch for the next release: “Soybeans: The Global Protein Powerhouse.”
When charting futures, the data provided could be delayed. Traders working with the ticker symbols discussed in this idea may prefer to use CME Group real-time data plan on TradingView: www.tradingview.com - This consideration is particularly important for shorter-term traders, whereas it may be less critical for those focused on longer-term trading strategies.
General Disclaimer:
The trade ideas presented herein are solely for illustrative purposes forming a part of a case study intended to demonstrate key principles in risk management within the context of the specific market scenarios discussed. These ideas are not to be interpreted as investment recommendations or financial advice. They do not endorse or promote any specific trading strategies, financial products, or services. The information provided is based on data believed to be reliable; however, its accuracy or completeness cannot be guaranteed. Trading in financial markets involves risks, including the potential loss of principal. Each individual should conduct their own research and consult with professional financial advisors before making any investment decisions. The author or publisher of this content bears no responsibility for any actions taken based on the information provided or for any resultant financial or other losses.

The Golden Grain: Trading Corn in Global Markets🟡 1. Introduction
Corn isn’t just something you eat off the cob at a summer barbecue — it’s one of the most widely traded agricultural commodities in the world. Behind every kernel lies a powerful story of food security, global trade, biofuels, and speculative capital.
Whether you’re a farmer managing risk, a trader chasing macro trends, or simply curious about how weather affects global prices, corn futures sit at the crossroads of agriculture and finance. In this article, we’ll explore what makes corn a global economic driver, how it behaves as a futures product, and what traders need to know to approach the corn market intelligently.
🌎 2. Where Corn Grows: Global Powerhouses
Corn is cultivated on every continent except Antarctica, but a handful of countries dominate production and exports.
United States – By far the largest producer and exporter. The “Corn Belt” — spanning Iowa, Illinois, Indiana, Nebraska, and parts of Ohio and Missouri — produces the majority of U.S. corn. U.S. exports also set global benchmarks for pricing.
Brazil & Argentina – These two South American powerhouses are crucial to the global corn supply, especially during the Northern Hemisphere’s off-season.
China – Though a top producer, China consumes most of its own supply and has become a key importer during deficit years.
Corn is typically planted in the U.S. between late April and early June and harvested from September through November. In Brazil, two crops per year are common — including the important safrinha (second crop), harvested mid-year.
Understanding where and when corn is grown is vital. Weather disruptions in any of these regions can ripple through the futures market within hours — or even minutes.
💹 3. Corn as a Futures Market Power Player
Corn is one of the most liquid agricultural futures markets in the world, traded primarily on the CME Group’s CBOT (Chicago Board of Trade). It attracts a diverse set of participants:
Producers and Commercials: Farmers, ethanol refiners, and food manufacturers use corn futures to hedge price risk.
Speculators and Funds: Hedge funds and retail traders speculate on corn price direction, volatility, and seasonal patterns.
Arbitrageurs and Spreads: Traders bet on relative price differences between contracts (e.g., old crop vs. new crop spreads).
The deep liquidity and relatively low tick size make corn accessible, but its price is highly sensitive to weather, government reports (like WASDE), and international trade policies.
🏗️ 4. CME Group Corn Futures: What You Can Trade
The CME Group offers both standard and micro-sized contracts for corn. Here’s a quick overview:
o Standard Corn
Ticker: ZC
Size = 5,000 bushels
Tick = 0.0025 = $12.50
Margin = ~$1,050
o Micro Corn
Ticker: XC
Size = 1,000 bushels
Tick = 0.0050 = $2.50
Margin = ~$105
⚠️ Always confirm margin requirements with your broker. They change with market volatility and exchange updates.
The availability of micro corn contracts has opened the door for smaller traders to manage risk or test strategies without over-leveraging.
📊 5. Historical Price Behavior & Seasonality
Corn is deeply seasonal — and so is its price action.
During planting season (April–May), traders watch weekly USDA crop progress reports and early weather forecasts like hawks. A wet spring can delay planting, leading to tighter supply expectations and early price spikes.
Then comes pollination (July) — the most critical stage. This is when heatwaves or drought can do serious damage to yield potential. If temperatures are unusually high or rainfall is scarce during this window, markets often react with urgency, bidding up futures prices in anticipation of reduced output.
By harvest (September–November), prices often stabilize — especially if production matches expectations. But early frost, wind storms, or excessive rain during harvest can still trigger sharp volatility.
Many experienced traders overlay weather models, soil moisture maps, and historical USDA data to anticipate season-driven price shifts.
Even international factors play a role. For example, when Brazil’s safrinha crop suffers a drought, global corn supply tightens — impacting CME prices even though the crop is thousands of miles away.
🧠 6. What Every New Trader Should Know
If you’re new to corn trading, here are some key principles:
Watch the Weather: It’s not optional. Daily forecasts, drought monitors, and precipitation anomalies can move markets. NOAA, Open-Meteo, and private ag weather services are your friends.
Know the Reports: The WASDE report (World Agricultural Supply and Demand Estimates), USDA Crop Progress, and Prospective Plantings reports can shake up pricing more than you might expect — even if changes seem small.
Mind the Time of Year: Seasonality affects liquidity, volatility, and trader behavior. March–August tends to be the most active period.
Understand Global Demand: The U.S. exports a huge portion of its crop — with China, Mexico, and Japan as major buyers. A tariff tweak or surprise Chinese cancellation can cause wild price swings.
🛠️ Good corn trading is 50% strategy, 50% meteorology.
🧭 This article is part of a broader educational series exploring the relationship between agricultural commodities and weather patterns. In the upcoming pieces, we’ll dive deeper into how temperature and precipitation affect corn, wheat, and soybeans — with real data, charts, and trading insights.
📅 Watch for the next release: “Breadbasket Basics: Trading Wheat Futures.”
When charting futures, the data provided could be delayed. Traders working with the ticker symbols discussed in this idea may prefer to use CME Group real-time data plan on TradingView: www.tradingview.com - This consideration is particularly important for shorter-term traders, whereas it may be less critical for those focused on longer-term trading strategies.
General Disclaimer:
The trade ideas presented herein are solely for illustrative purposes forming a part of a case study intended to demonstrate key principles in risk management within the context of the specific market scenarios discussed. These ideas are not to be interpreted as investment recommendations or financial advice. They do not endorse or promote any specific trading strategies, financial products, or services. The information provided is based on data believed to be reliable; however, its accuracy or completeness cannot be guaranteed. Trading in financial markets involves risks, including the potential loss of principal. Each individual should conduct their own research and consult with professional financial advisors before making any investment decisions. The author or publisher of this content bears no responsibility for any actions taken based on the information provided or for any resultant financial or other losses.

Behind the Curtain: Bitcoin’s Surprising Macro Triggers1. Introduction
Bitcoin Futures (BTC), once viewed as a niche or speculative product, have now entered the macroeconomic spotlight. Traded on the CME and embraced by institutions through ETF exposure, BTC Futures reflect not only digital asset sentiment—but also evolving reactions to traditional economic forces.
While many traders still associate Bitcoin with crypto-native catalysts, machine learning reveals a different story. Today, BTC responds dynamically to macro indicators like Treasury yields, labor data, and liquidity trends.
In this article, we apply a Random Forest Regressor to historical data to uncover the top economic signals impacting Bitcoin Futures returns across daily, weekly, and monthly timeframes—some of which may surprise even seasoned macro traders.
2. Understanding Bitcoin Futures Contracts
Bitcoin Futures provide institutional-grade access to BTC price movements—with efficient clearing and capital flexibility.
o Standard BTC Futures (BTC):
Tick Size: $5 per tick = $25 per tick per contract
Initial Margin: ≈ $102,000 (subject to volatility)
o Micro Bitcoin Futures (MBT):
Contract Size: 1/50th the BTC size
Tick Size: $5 = $0.50 per tick per contract
Initial Margin: ≈ $2,000
BTC and MBT trade nearly 24 hours per day, five days a week, offering deep liquidity and expanding participation across hedge funds, asset managers, and active retail traders.
3. Daily Timeframe: Short-Term Macro Sensitivity
Bitcoin’s volatility makes it highly reactive to daily data surprises, especially those affecting liquidity and rates.
Velocity of Money (M2): This lesser-watched indicator captures how quickly money circulates. Rising velocity can signal renewed risk-taking, often leading to short-term BTC movements. A declining M2 velocity implies tightening conditions, potentially pressuring BTC as risk appetite contracts.
10-Year Treasury Yield: One of the most sensitive intraday indicators for BTC. Yield spikes make holding non-yielding assets like Bitcoin potentially less attractive. Declining yields could signal easing financial conditions, inviting capital back into crypto.
Labor Force Participation Rate: While not a headline number, sudden shifts in labor force data can affect consumer confidence and policy tone—especially if they suggest a weakening economy. Bitcoin could react positively when data implies future easing.
4. Weekly Timeframe: Labor-Driven Market Reactions
As BTC increasingly correlates with traditional markets, weekly economic data—especially related to labor—has become a mid-term directional driver.
Initial Jobless Claims: Spikes in this metric can indicate rising economic stress. BTC could react defensively to rising claims, but may rally on drops, especially when seen as signs of stability returning.
ISM Manufacturing Employment: This metric reflects hiring strength in the manufacturing sector. Slowing employment growth here could correlate with broader economic softening—something BTC traders can track as part of their risk sentiment gauge.
Continuing Jobless Claims: Tracks the persistence of unemployment. Sustained increases can shake risk markets and pull BTC lower, while ongoing declines suggest an improving outlook, which could help BTC resume upward movement.
5. Monthly Timeframe: Macro Structural Themes
Institutional positioning in Bitcoin increasingly aligns with high-impact monthly data. These indicators help shape longer-term views on liquidity, rate policy, and capital allocation:
Unemployment Rate: A rising unemployment rate could shift market expectations toward a more accommodative monetary policy. Bitcoin, often viewed as a hedge against fiat debasement and monetary easing, can benefit from this shift. In contrast, a low and steady unemployment rate may pressure BTC as it reinforces the case for higher interest rates.
10-Year Treasury Yield (again): On a monthly basis, this repeats and become a cornerstone macro theme.
Initial Jobless Claims (again): Rather than individual weekly prints, the broader trend reveals structural shifts in the labor market.
6. Style-Based Strategy Insights
Bitcoin traders often span a wide range of styles—from short-term volatility hunters to long-duration macro allocators. Aligning indicator focus by style is essential:
o Day Traders
Zero in on M2 velocity and 10-Year Yield to time intraday reversals or continuation setups.
Quick pivots in bond yields or liquidity metrics could coincide with BTC spikes.
o Swing Traders
Use Initial Jobless Claims and ISM Employment trends to track momentum for 3–10 day moves.
Weekly data may help catch directional shifts before they appear in price charts.
o Position Traders
Monitor macro structure via Unemployment Rate, 10Y Yield, and Initial Claims.
These traders align portfolios based on broader economic trends, often holding exposure through cycles.
7. Risk Management Commentary
Bitcoin Futures demand tactical risk management:
Use Micro BTC Contracts (MBT) to scale in or out of trades precisely.
Expect volatility around macro data releases—set wider stops with volatility-adjusted sizing.
Avoid over-positioning near major Fed meetings, CPI prints, or labor reports.
Unlike legacy markets, BTC can make multi-percent intraday moves. A robust risk plan isn’t optional—it’s survival.
8. Conclusion
Bitcoin has matured into a macro-responsive asset. What once moved on hype now responds to the pulse of the global economy. From M2 liquidity flows and interest rate expectations, to labor market stability, BTC Futures reflect institutional sentiment shaped by data.
BTC’s role in the modern portfolio is still evolving. But one thing is clear: macro matters. And those who understand which indicators truly move Bitcoin can trade with more confidence and precision.
Stay tuned for the next edition of the "Behind the Curtain" series as we decode the economic machinery behind another CME futures product.
When charting futures, the data provided could be delayed. Traders working with the ticker symbols discussed in this idea may prefer to use CME Group real-time data plan on TradingView: www.tradingview.com - This consideration is particularly important for shorter-term traders, whereas it may be less critical for those focused on longer-term trading strategies.
General Disclaimer:
The trade ideas presented herein are solely for illustrative purposes forming a part of a case study intended to demonstrate key principles in risk management within the context of the specific market scenarios discussed. These ideas are not to be interpreted as investment recommendations or financial advice. They do not endorse or promote any specific trading strategies, financial products, or services. The information provided is based on data believed to be reliable; however, its accuracy or completeness cannot be guaranteed. Trading in financial markets involves risks, including the potential loss of principal. Each individual should conduct their own research and consult with professional financial advisors before making any investment decisions. The author or publisher of this content bears no responsibility for any actions taken based on the information provided or for any resultant financial or other losses.

A Fundamental Shift Signals a Long-Term Technical Bear MarketE-mini Dow Jones Index Futures & Options
Ticker: YM
Minimum fluctuation:
1.00 index point = $5.00
Micro E-mini Dow Jones Index Futures
Ticker: MYM
Minimum fluctuation:
1.0 index points = $0.50
Disclaimer:
• What presented here is not a recommendation, please consult your licensed broker.
• Our mission is to create lateral thinking skills for every investor and trader, knowing when to take a calculated risk with market uncertainty and a bolder risk when opportunity arises.
CME Real-time Market Data help identify trading set-ups in real-time and express my market views. If you have futures in your trading portfolio, you can check out on CME Group data plans available that suit your trading needs tradingview.com/cme/
Trading the Micro: cmegroup.com/markets/microsuite.html
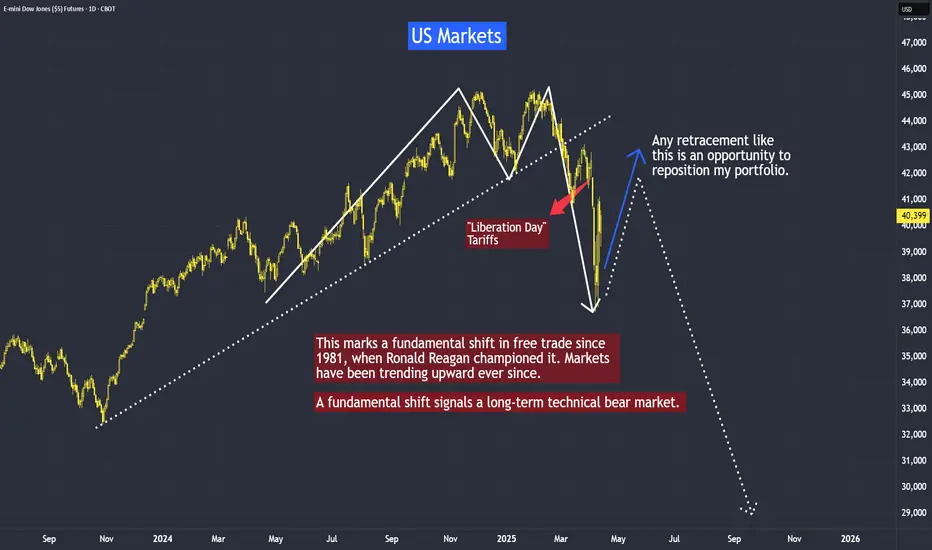
Q1 Recap and What’s AheadThe first quarter of 2025 saw significant price movements in many different asset classes. Traders saw equity indices broadly selling off with the ES contract falling near 10% from the highs while Gold continued to push higher to all time high levels. There are many factors contributing to the price movement, including a shift in the administration in the U.S., geopolitical tensions globally, and critical tariff announcements looming. There are also questions about the Fed environment and the strategy that will be implemented this year to begin cutting interest rates. Looking at the CME Fed Watch Tool today, it seems the market is pricing another rate pause for the May meeting and a near 60% chance of rate cuts coming in June.
There is a large slate of economic date coming out for the rest of the week that could add great volatility to this uncertain market, including:
Tariff Announcement
Initial Jobless Claims
Nonfarm Payroll
Unemployment Rate
Average Hourly Earnings
This morning, traders saw the ADP Nonfarm Employment Change come in higher than expected and the markets are having a mixed reaction. President Trump will be speaking at 3:00 P.M. Central Time to introduce the tariff plan and how it will be rolled out, adding a level of clarity for the market moving forward into Q2.
If you have futures in your trading portfolio, you can check out on CME Group data plans available that suit your trading needs tradingview.com/cme/
*CME Group futures are not suitable for all investors and involve the risk of loss. Copyright © 2023 CME Group Inc.
**All examples in this report are hypothetical interpretations of situations and are used for explanation purposes only. The views in this report reflect solely those of the author and not necessarily those of CME Group or its affiliated institutions. This report and the information herein should not be considered investment advice or the results of actual market experience.

Behind the Curtain: Macro Indicators That Move the Yen1. Introduction
Japanese Yen Futures (6J), traded on the CME, offer traders a window into one of the world’s most strategically important currencies. The yen is not just Japan’s currency—it’s also a barometer for global risk appetite, a funding vehicle for the carry trade, and a defensive asset when markets turn volatile.
But what truly moves Yen Futures?
While many traders fixate on central bank statements and geopolitical news, machine learning tells us that economic indicators quietly—but consistently—steer price action. In this article, we apply a Random Forest Regressor to reveal the top macroeconomic indicators driving 6J Futures across daily, weekly, and monthly timeframes, helping traders of all styles align their strategies with the deeper economic current.
2. Understanding Yen Futures Contracts
Whether you’re trading institutional size or operating with a retail account, CME Group offers flexible exposure to the Japanese yen through two contracts:
o Standard Japanese Yen Futures (6J):
Contract Size: ¥12,500,000
Tick Size: 0.0000005 = $6.25 per tick
Use Case: Institutional hedging, macro speculation, rate differential trading
o Micro JPY/USD Futures (MJY):
Contract Size: ¥1,250,000
Tick Size: 0.000001 = $1.25 per tick
Use Case: Retail-sized access, position scaling, strategy testing
o Margin Requirements:
6J: Approx. $3,300 per contract
MJY: Approx. $330 per contract
Both products offer deep liquidity and near 24-hour access. Traders use them to express views on interest rate divergence, U.S.-Japan trade dynamics, and global macro shifts—all while adjusting risk through contract size.
3. Daily Timeframe: Top Macro Catalysts
Short-term movements in Yen Futures are heavily influenced by U.S. economic data and its impact on yield spreads and capital flow. Machine learning analysis ranks the following three as the most influential for daily returns:
10-Year Treasury Yield: The most sensitive indicator for the yen. Rising U.S. yields widen the U.S.-Japan rate gap, strengthening the dollar and weakening the yen. Drops in yields could create sharp yen rallies.
U.S. Trade Balance: A narrowing trade deficit can support the USD via improved capital flow outlook, pressuring the yen. A wider deficit may signal weakening demand for USD, providing potential support for yen futures.
Durable Goods Orders: A proxy for economic confidence and future investment. Strong orders suggest economic resilience, which tends to benefit the dollar. Weak numbers may point to a slowdown, prompting defensive yen buying.
4. Weekly Timeframe: Intermediate-Term Indicators
Swing traders and macro tacticians often ride trends formed by mid-cycle economic shifts. On a weekly basis, these indicators matter most:
Fed Funds Rate: As the foundation of U.S. interest rates, this policy tool steers the entire FX complex. Hawkish surprises can pressure yen futures; dovish turns could strengthen the yen as yield differentials narrow.
10-Year Treasury Yield (again): While impactful daily, the weekly trend gives traders a clearer view of long-term investor positioning and bond market sentiment. Sustained moves signal deeper macro shifts.
ISM Manufacturing Employment: This labor-market-linked metric reflects production demand. A drop often precedes softening economic growth, which may boost the yen as traders reduce exposure to riskier assets.
5. Monthly Timeframe: Structural Macro Forces
For position traders and macro investors, longer-term flows into the Japanese yen are shaped by broader inflationary trends, liquidity shifts, and housing demand. Machine learning surfaced the following as top monthly influences on Yen Futures:
PPI: Processed Foods and Feeds: A unique upstream inflation gauge. Rising producer prices—especially in essentials like food—can increase expectations for tightening, influencing global yield differentials. For the yen, which thrives when inflation is low, surging PPI may drive USD demand and weaken the yen.
M2 Money Supply: Reflects monetary liquidity. A sharp increase in M2 may spark inflation fears, sending interest rates—and the dollar—higher, pressuring the yen. Conversely, slower M2 growth can support the yen as global liquidity tightens.
Housing Starts: Serves as a growth thermometer. Robust housing data suggests strong domestic demand in the U.S., favoring the dollar over the yen. Weakness in this sector may support yen strength as traders rotate defensively.
6. Trade Style Alignment with Macro Data
Each indicator resonates differently depending on the trading style and timeframe:
Day Traders: React to real-time changes in 10-Year Yields, Durable Goods Orders, and Trade Balance. These traders seek to capitalize on intraday volatility around economic releases that impact yield spreads and risk appetite.
Swing Traders: Position around Fed Funds Rate changes, weekly shifts in Treasury yields, or deteriorating labor signals such as ISM Employment. Weekly data can establish trends that last multiple sessions, making it ideal for this style.
Position Traders: Monitor PPI, M2, and Housing Starts for broader macro shifts. These traders align their exposure with long-term shifts in capital flow and inflation expectations, often holding positions for weeks or more.
Whatever the style, syncing your trading plan with the data release calendar and macro backdrop can improve timing and conviction.
7. Risk Management
The Japanese yen is a globally respected safe-haven currency, and its volatility often spikes during geopolitical stress or liquidity events. Risk must be managed proactively, especially in leveraged futures products.
8. Conclusion
Japanese Yen Futures are a favorite among global macro traders because they reflect interest rate divergence, risk sentiment, and global liquidity flows. While headlines grab attention, data tells the real story.
Stay tuned for the next installment of the "Behind the Curtain" series, where we continue uncovering what really moves the futures markets.
When charting futures, the data provided could be delayed. Traders working with the ticker symbols discussed in this idea may prefer to use CME Group real-time data plan on TradingView: www.tradingview.com - This consideration is particularly important for shorter-term traders, whereas it may be less critical for those focused on longer-term trading strategies.
General Disclaimer:
The trade ideas presented herein are solely for illustrative purposes forming a part of a case study intended to demonstrate key principles in risk management within the context of the specific market scenarios discussed. These ideas are not to be interpreted as investment recommendations or financial advice. They do not endorse or promote any specific trading strategies, financial products, or services. The information provided is based on data believed to be reliable; however, its accuracy or completeness cannot be guaranteed. Trading in financial markets involves risks, including the potential loss of principal. Each individual should conduct their own research and consult with professional financial advisors before making any investment decisions. The author or publisher of this content bears no responsibility for any actions taken based on the information provided or for any resultant financial or other losses.
