Agressively buying Microsoft.Microsoft - Intraday - We look to Buy a break of 251.11 (stop at 241.98)
We are trading at oversold extremes.
A break of yesterdays high would confirm bullish momentum.
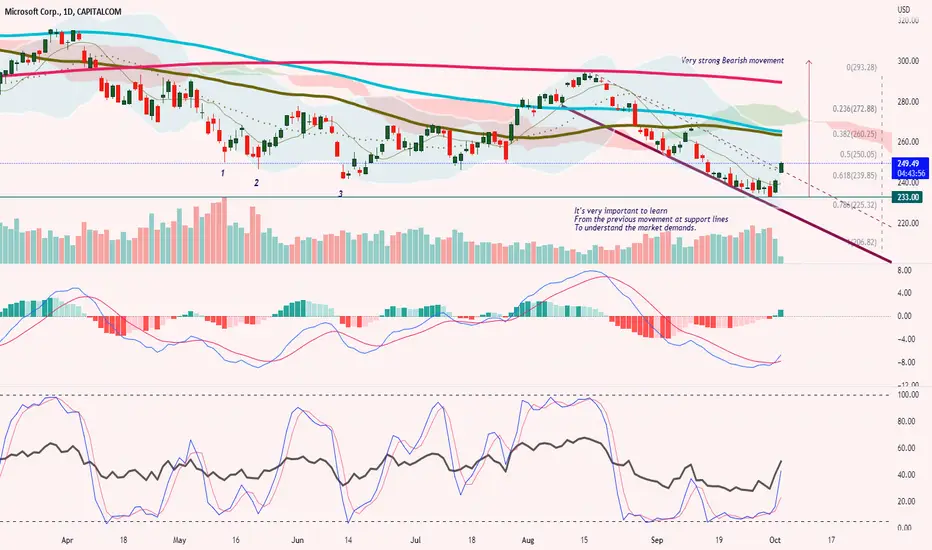
Bullish divergence can be seen on the daily (the chart makes a lower low while the oscillator makes a higher low), often a signal of exhausted bearish momentum, or at least a correction higher.
Bullish divergence is expected to support prices.
Although we remain bullish overall, a correction is possible with plenty of room to move lower without impacting the trend higher.
Our profit targets will be 274.98 and 279.98
Resistance: 250.00 / 260.00 / 267.00
Support: 235.00 / 220.00 / 210.00
Disclaimer – Saxo Bank Group.
Please be reminded – you alone are responsible for your trading – both gains and losses. There is a very high degree of risk involved in trading. The technical analysis , like any and all indicators, strategies, columns, articles and other features accessible on/though this site (including those from Signal Centre) are for informational purposes only and should not be construed as investment advice by you. Such technical analysis are believed to be obtained from sources believed to be reliable, but not warrant their respective completeness or accuracy, or warrant any results from the use of the information. Your use of the technical analysis , as would also your use of any and all mentioned indicators, strategies, columns, articles and all other features, is entirely at your own risk and it is your sole responsibility to evaluate the accuracy, completeness and usefulness (including suitability) of the information. You should assess the risk of any trade with your financial adviser and make your own independent decision(s) regarding any tradable products which may be the subject matter of the technical analysis or any of the said indicators, strategies, columns, articles and all other features.
Please also be reminded that if despite the above, any of the said technical analysis (or any of the said indicators, strategies, columns, articles and other features accessible on/through this site) is found to be advisory or a recommendation; and not merely informational in nature, the same is in any event provided with the intention of being for general circulation and availability only. As such it is not intended to and does not form part of any offer or recommendation directed at you specifically, or have any regard to the investment objectives, financial situation or needs of yourself or any other specific person. Before committing to a trade or investment therefore, please seek advice from a financial or other professional adviser regarding the suitability of the product for you and (where available) read the relevant product offer/description documents, including the risk disclosures. If you do not wish to seek such financial advice, please still exercise your mind and consider carefully whether the product is suitable for you because you alone remain responsible for your trading – both gains and losses.
Microsoft

🟢 MSFT - 3D (07.10.2022)🟢 MSFT
TF: 3D
Side: Long
SL: $232.73
TP 1: $260.33
TP 2: $277.40
TP 3: $291.20
Spotted some bullish divergence on the Microsoft 3D chart.
I am expecting a relief bounce here that could last several weeks.
1W RSI and MACD also look ready to support the movement.

MICROSOFTTuesday, 4 October 2022
22:15 PM (WIB)
Facts About Microsoft
Microsoft enables digital transformation in the era of an intelligent cloud and an intelligent edge.
Its mission is to empower every person and every organization on the planet to achieve more.
For more details about Microsoft, please come visit the website .
Longing Microsoft. MSFTIn conjunction with the uptrend on the major indices (locally), we are seeing a recovery in this major stock. It remains to be seen what exactly we are to paint out - a zigzag, triangle and its many varieties. Momentum is upgoing on SPX, which gives us confidence to see more growth in the tech sector.
We are not in the business of getting every prediction right, no one ever does and that is not the aim of the game. The Fibonacci targets are highlighted in purple with invalidation in red. Confirmation level, where relevant, is a pink dotted, finite line. Fibonacci goals, it is prudent to suggest, are nothing more than mere fractally evident and therefore statistically likely levels that the market will go to. Having said that, the market will always do what it wants and always has a mind of its own. Therefore, none of this is financial advice, so do your own research and rely only on your own analysis. Trading is a true one man sport. Good luck out there and stay safe.

MSFT Microsoft Corporation Technical ReboundIf you haven`t sold MSFT after they Issued the Warning to Investors:
Then you should know that the chart reached our price target perfectly and is now ready for a technical rebound.
A technical rebound refers to a recovery from a prior period of losses when technical signals indicate that the move was oversold.
In this case, the Relative Strength Index momentum indicator of MSFT Microsoft Corporation is at 24.30.
Even though i am overall bearish on the economy, buying a strong financial instrument when the RSI is below 30, would make a case for a potential short term reversal.
Looking forward to read your opinion about it.

Microsoft Stock Analysis. Biggest sell-off in history happeningMicrosoft Stock Analysis. The biggest sell-off in history has been happening since the end of 2021. Long-term shorts are playing out on Microsoft stock.
New supply levels are being created on the weekly timeframe; the last one is located at $256 per share. Microsoft's stock price today is still bearish. The stock might take some time to pull back to the supply imbalance shown in the Microsoft stock video analysis and prediction.
The expectations for the IT giant are very negative, regardless of any positive news, earnings, or new products and acquisitions. MSFT stock price could drop as far down as $65 in the following months. You can use bearish stock option strategies to take advantage of the sell-off in Microsoft stock.

MSFT - Stair-Stepping DownMSFT appears to be reversing years of advance. Stair-Stepping Down. Watch key support.

MSFT possible pullbackHere is a possible pullback considering possible prices of resistance including the lowest price of an old candle, the 50% of the fibonacci retracement (where retracements are more likely to happen). The price already hit the zone but it is common for the price to come back up before the day end. Furthermore, the 50% fibonacci retracement also happens with the weekly timeframe. The risk/reward ratio do not consider the current trend, therefore it is better to maybe take out the TP to see how far the price might go down.

MSFT Potential for Bearish Momentum | 26th September 2022On H4, with the price moving within the descending channel and below ichimoku cloud , we have a bearish bias that the price may drop from the sell entry at 236.25, which is in line with the 78.6% fibonacci projection to the take profit at 208.8, where the 78.6% fibonacci projection is. Alternatively, the price may rise to the stop loss at 252.14, which is in line with the 23.6% fibonacci retracement .
Any opinions, news, research, analyses, prices, other information, or links to third-party sites contained on this website are provided on an "as-is" basis, as general market commentary, and do not constitute investment advice. The market commentary has not been prepared in accordance with legal requirements designed to promote the independence of investment research, and it is therefore not subject to any prohibition on dealing ahead of dissemination. Although this commentary is not produced by an independent source, FXCM takes all sufficient steps to eliminate or prevent any conflicts of interest arising out of the production and dissemination of this communication. The employees of FXCM commit to acting in the clients' best interests and represent their views without misleading, deceiving, or otherwise impairing the clients' ability to make informed investment decisions. For more information about the FXCM's internal organizational and administrative arrangements for the prevention of conflicts, please refer to the Firms' Managing Conflicts Policy. Please ensure that you read and understand our Full Disclaimer and Liability provision concerning the foregoing Information, which can be accessed on the website.

MSFT: Head, shoulders, knees and toesMicrosoft has painted a head & shoulders formation, and is on track to confirm a neckline break on the daily and weekly timeframes. Expect a continuation of the downtrend on this neckline break, as well as further index weakness given MSFT's tremendous weight in the indices.
Notes:
Confirmation still required on neckline break, a wick below is insufficient.
Weekly closure above the neckline will invalidate the pattern.

MSFTHELLO GUYS THIS MY IDEA 💡ABOUT MSFT is nice to see strong volume area....
Where is lot of contract accumulated..
I thing that the buyers from this area will be defend this long position..
and when the price come back to this area, strong buyers will be push up the market again..
UPTREND + Support from the past + Strong volume area is my mainly reason for this long trade..
IF you like my work please like share and follow thanks
TURTLE TRADER 🐢

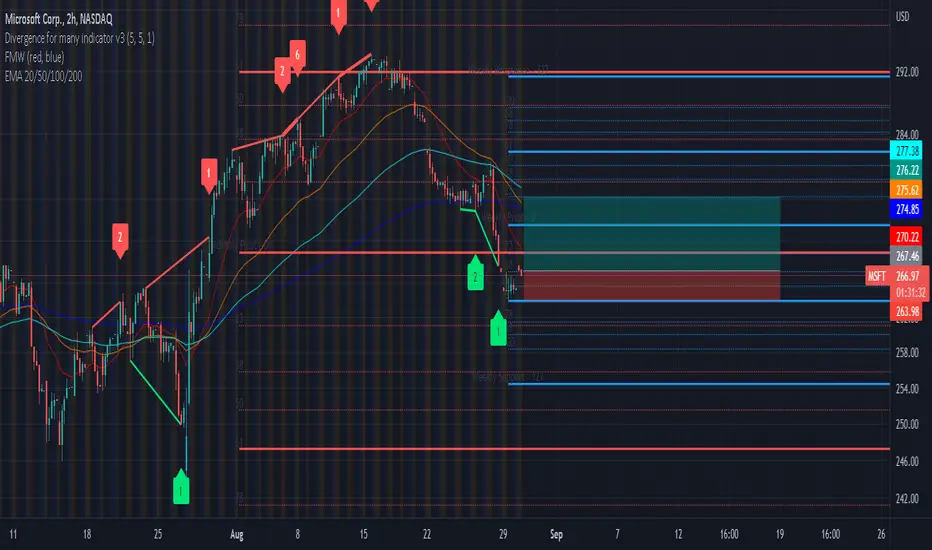
MSFT - Short position When looking at MSFT current underlying value and most recent price behaviour when using a 2-hour range, investors can see that on the 02/09/22 a three-bar pattern formed making up a shooting star. In this instance, this was a bareish indication, a failed attempt to correct the underlying stock value´s bearish momentum with bullish momentum.
When observing 50 and 100 day ranged EMA averages investors can see that on the 26/08/22 shorter 50-day EMA moving average crossed beneath the longer 100-day EMA moving average. This dead cross was followed by a strong down trend, underlying prices falling 7%. This was after bullish rallies that were witnessed since mid-July. On 27/07/22 shorter 50-day EMA moving average crossed above longer 100-day EMA moving average. This fresh bullish crossover was followed by a rally that saw the underlying share value continue to increase over 10%. Currently EMA moving average lines are not moving back towards one another, instead they are moving parallel in a different trajectory. Therefore, the down trend is more likely to strengthen before corrections occur.
When observing MACD and signal lines, investors can see that 06/09/22 the MACD line crossed beneath the signal line. This further supports our bearish sentiment.
Based on EMA moving averages, candlestick patterns and behaviour as well as MACD and signal lines, we are bareish in sentiment. We anticipate that the stock will fall further and have taken a short position as a result.

MSFTNot financial advice. The essence of investing & trading is the intelligent and patient preying on the greed, fear, impatience, addiction and ignorance of the majority. It's definitionally Darwinian.

ATVI Spike (Merger Arbitrage Continued)This morning I received a Spike Alert for price volatility at the open on Activision Blizzard NASDAQ:ATVI . Perhaps people are excited about Wrath of the Lich King classic being released? :D
This swing trade occurs within the context of the Merger Arbitrage trade which has been going on for many months since Microsoft announced an offer of $95/share to purchase ATVI. There has been much rumor and speculation as always on if this deal would go through which manifests itself in a present 20.6% risk premium from the current trading price of ATVI to the buyout price. Nothing has fundamentally changed since the board approved the deal. Warren Buffett is also in the merger arbitrage trade with a 9.5% stake in ATVI.
I am already long the merger arbitrage trade from earlier in the year. Note: Getting into it now would be less than 12 months til the expected buyout which would mean a successful trade would incurr short term capital gains rather than long term. GLHF!

MICROSOFT CORP.Ascending to the strongest bounced peak from which descending peaks were formed to the end of the strong demand area and upon arrival wool is determined the target precisely

MSFT - Long PositionDivergence indication signals suggest bullish change in momentum.
Candlestick momentum shows a potential bullish hammer. The underlying stock price presented in the form of candlesticks seems to be reversing in line with its moderate 0.38 weekly support level. A bullish hammer can be identified within the down trend, a bullish hammer suggests that there will be a change in momentum.
When applying a weekly and monthly ranged Fibonacci, investors can see that this potential bullish hammer is occurring in line with its moderate 0.38 support level. However, when looking at the 1-month ranged Fibonacci investors are wary given that the stock is trading close to its central 0.00 pivot level.
EMA indicators suggest the stock is undervalued given that the underlying stock value is currently trading below all 20-, 50-, 100- and 200-day EMA averages. Furthermore, the crossover of 20- and 50-day EMA lines is a buy signal.
Based on these undervalued signals, we anticipate the stock to correct towards a stronger resistance.
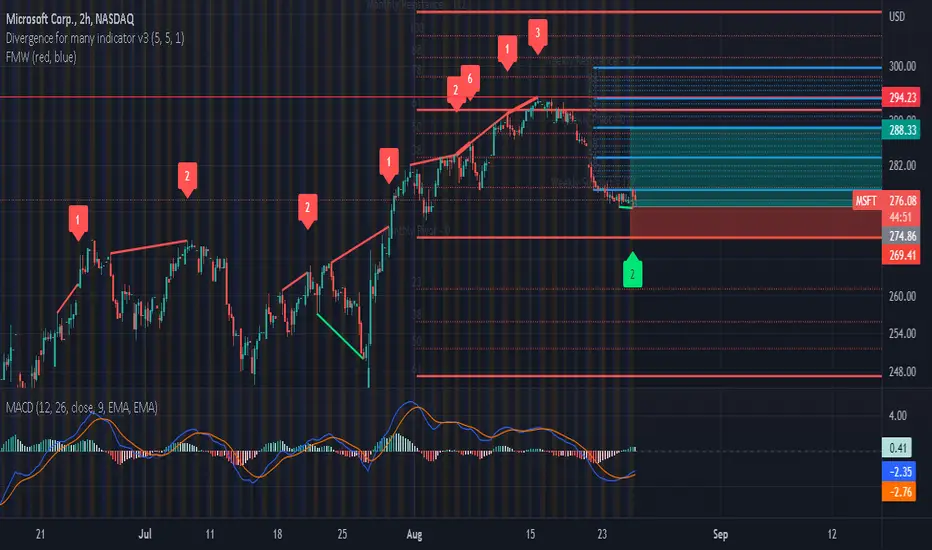
MSFT Potential for Bullish Rise| 26th August 2022 Microsoft CorpOn H4, with the price moving within the ascending channel and above ichimoku cloud , we have a bullish bias that the price may rise form the buy entry at 278.84, where the overlap resistance and 23.6% fibonacci retracement are to the take profit at 294.02, where the swing high is. Alternatively, the price may drop to the stop loss at 268.06, where the pullback support and 50% fibonacci retracement are.
Any opinions, news, research, analyses, prices, other information, or links to third-party sites contained on this website are provided on an "as-is" basis, as general market commentary, and do not constitute investment advice. The market commentary has not been prepared in accordance with legal requirements designed to promote the independence of investment research, and it is therefore not subject to any prohibition on dealing ahead of dissemination. Although this commentary is not produced by an independent source, FXCM takes all sufficient steps to eliminate or prevent any conflicts of interest arising out of the production and dissemination of this communication. The employees of FXCM commit to acting in the clients' best interests and represent their views without misleading, deceiving, or otherwise impairing the clients' ability to make informed investment decisions. For more information about the FXCM's internal organizational and administrative arrangements for the prevention of conflicts, please refer to the Firms' Managing Conflicts Policy. Please ensure that you read and understand our Full Disclaimer and Liability provision concerning the foregoing Information, which can be accessed on the website.

MSFT - Long PositionDivergence indication signals suggest bullish change in momentum.
Candlestick momentum shows an inverted hammer signal. The underlying stock price presented in the form of candlesticks seems to be stabilizing in line with its strong weekly support level. This suggests that the bareish sentiment is changing and loosing momentum. Inverted hammer, whist not as reliable as a Hammers, still certainly suggest that bullish momentum is likely.
When applying a weekly and monthly ranged Fibonacci, investors can see that this inverted hammer is occurring in line with its strong 1.00 support level. However, when looking at the 1-month ranged Fibonacci investors are wary given that the stock is trading in line with it’s weaker 0.22 resistance level.
It´s important to consider that the end of July and August has seen bullish rallies. The underlying stock value of MSFT has risen above 10%. This was after bearish momentum that began on 16/08/22. Before this underlying stock prices had risen as much as 20% between 26/07/22 and 15/08/22.
All things considered, we are bullish in sentiment. We anticipate the price of MSFT to reach it´s weekly central 0.00 Fibonacci pivot.
Microsoft pulling back?Microsoft
Short Term
We look to Buy at 273.34 (stop at 266.24)
Previous resistance at 275.00 now becomes support. Choppy price action seen. We can see no technical reason for a change of trend. We therefore, prefer to fade into the dip with a tight stop in anticipation of a move back higher.
Our profit targets will be 292.57 and 303.00
Resistance: 293.00 / 315.00 / 320.00
Support: 275.00 / 250.00 / 200.00
Disclaimer – Saxo Bank Group. Please be reminded – you alone are responsible for your trading – both gains and losses. There is a very high degree of risk involved in trading. The technical analysis, like any and all indicators, strategies, columns, articles and other features accessible on/though this site (including those from Signal Centre) are for informational purposes only and should not be construed as investment advice by you. Such technical analysis are believed to be obtained from sources believed to be reliable, but not warrant their respective completeness or accuracy, or warrant any results from the use of the information. Your use of the technical analysis, as would also your use of any and all mentioned indicators, strategies, columns, articles and all other features, is entirely at your own risk and it is your sole responsibility to evaluate the accuracy, completeness and usefulness (including suitability) of the information. You should assess the risk of any trade with your financial adviser and make your own independent decision(s) regarding any tradable products which may be the subject matter of the technical analysis or any of the said indicators, strategies, columns, articles and all other features.
Please also be reminded that if despite the above, any of the said technical analysis (or any of the said indicators, strategies, columns, articles and other features accessible on/through this site) is found to be advisory or a recommendation; and not merely informational in nature, the same is in any event provided with the intention of being for general circulation and availability only. As such it is not intended to and does not form part of any offer or recommendation directed at you specifically, or have any regard to the investment objectives, financial situation or needs of yourself or any other specific person. Before committing to a trade or investment therefore, please seek advice from a financial or other professional adviser regarding the suitability of the product for you and (where available) read the relevant product offer/description documents, including the risk disclosures. If you do not wish to seek such financial advice, please still exercise your mind and consider carefully whether the product is suitable for you because you alone remain responsible for your trading – both gains and losses.

MSFT stock final up move before near reversalMicrosoft stock from a technical view has some space for some up movement
•MSFT Stock has broken above inverted H&SH pattern still not hit the pattern target at $302.
• Down channel is broken in the last up move with a successful retest.
We expect the up move to continue towards $300-$302 levels to hit the H&SH pattern target, before reversing back towards $270.
$300-$302 playing as an important resistance:
• 61.8% Fibonacci from the last down move from 22 Nov -21.
• Down trendline from Nov 21.

MSFT: Investment in stock marketI decide to make an investment in Microsoft stock because it's look bullish from this monthly timeframe. But when we invest in stock, it's very important to read ever fundamental analysis to know what affect the price of a stock. I will trade when market open at Monday, August, 8, 2022. Bought in the market price and my SL will be around $228 USD, and we could to have 2 targets.
One of the best strategy to accumulate money and investing in stock market it's find up 100% of the investent to double x2 yearly. But one of the best it's using asset like Bitcoin, Ethereum, Cardano to accumulate to use one of them using a good crypto-broker like Simple FX, Also, 200% yearly it's a good way, but combining to trade financial market and find up the yearly goal.
I hope that this analysis support you!!!

BullishBullish
In at 278 stop below 272
Microsoft looks like it just bounced off the support and looking for long term gains here

MSFT Potential for bullish rise | 2nd August 2022On the H4, with prices moving along the ascending trendline and above the ichimoku indicator, we have a bullish bias that price will rise from the buy entry at 275.24 where the overlap support and 23.6% fibonacci retracement are to the take profit at 290.73 where the swing high resistance, 127.2% fibonacci extension and 61.8% fibonacci retracement are. Alternatively, price could break entry structure and drop to stop loss at 269.22 where the overlap support and 38.2% fibonacci retracement are.
Any opinions, news, research, analyses, prices, other information, or links to third-party sites contained on this website are provided on an "as-is" basis, as general market commentary, and do not constitute investment advice. The market commentary has not been prepared in accordance with legal requirements designed to promote the independence of investment research, and it is therefore not subject to any prohibition on dealing ahead of dissemination. Although this commentary is not produced by an independent source, FXCM takes all sufficient steps to eliminate or prevent any conflicts of interest arising out of the production and dissemination of this communication. The employees of FXCM commit to acting in the clients' best interests and represent their views without misleading, deceiving, or otherwise impairing the clients' ability to make informed investment decisions. For more information about the FXCM's internal organizational and administrative arrangements for the prevention of conflicts, please refer to the Firms' Managing Conflicts Policy. Please ensure that you read and understand our Full Disclaimer and Liability provision concerning the foregoing Information, which can be accessed on the website.
