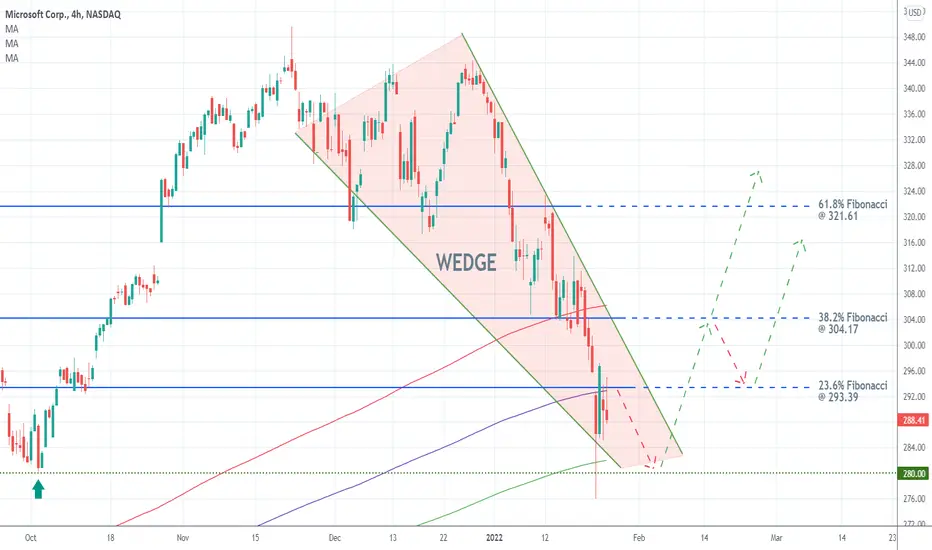
Microsoft's Descending Wedge Yesterday, Microsoft posted better-than-expected earnings for Q4, which is likely to help the reeling stock rebound. The correction is likely to be terminated around the previous swing low at 280.00 where a descending wedge is expected to be completed.
The first obstacle for the eventual rebound would be the 23.6 per cent Fibonacci retracement level at 293.39, which is currently converging with the 400-day MA (in purple). The next target would be the 38.2 per cent Fibonacci at 304.17.
In addition to the fact that it was recently crossed by the 300-day MA (in red), the resistance is positioned just above the psychologically significant threshold at 300.00. All of this implies the probable accumulation of strong selling pressure just above the 38.2 per cent Fibonacci.
Microsoft
MSFT Tech Bubble BurstBubble burst mode engaged.
It'll be back to reality for most equities. Speculative garbage and big tech has the most air to be let out of the balloon.
MSFT is a great large growth company but a price/revenue ratio of 12+ is insane, it has to fall quite a bit to be a good buy.

MSFT Microsoft TrendlineMicrosoft’s buyout of Activision Blizzard for $69 billion would be the largest tech deal of all time.
And Microsoft needs Activision to be a major gaming developer and metaverse competitor.
Microsoft is still in the bullish trendline before the earnings this week.
My price target is $331.
looking forward to read your opinion about it.

Will the 200 day EMA save Microsoft? Microsoft looks technically interesting. On one hand a double or even triple top argument could be made that flushed the stock down lower after it rallied to break a multi-year resistance TL but failed to hold it, and on the other hand it has not made any multi-month lower lows since September 2020. Stock holders are hoping that 294 will find buyers at the 200 day EMA ahead of earnings but it does not appear that there are any buyers in-sight just yet. 289/290 if reached next week will coincide with March 2021 TL support followed by much bigger support around 280/282 if we get there, where major bounces are expected. The intriguing question will be if buyers are willing show up aggressively under the 200 day to act on these supports because if not, 260 will not be far from reach. Upcoming earnings will determine the longer-term picture.
Is Microsoft in a bubble? Is it overvalued? Judge for yourself.
Microsoft PE Ratio as of January 21: 33.11
PE Ratio Range in the Past 5 Years:
Minimum: 22.35, JUL 03 2017
Maximum: 62.43, MAR 12 2018
Average: 34.68
Median: 32.84

Microsoft | Fundamental Analysis | SHORTOn Tuesday, Microsoft announced its intention to acquire video game giant Activision Blizzard in a deal worth $75 billion, or $68.7 billion based on Activision's net cash position. That corresponds to a price of $95 a share, up from Activision's share price of $65 last Friday, but still below Activision's 52-week high of $104.53.
If the deal passes antitrust scrutiny, it could be a clever move. In fact, the deal is reminiscent of Warren Buffett's approach to value investing at his Berkshire Hathaway conglomerate. Given Buffett's close friendship with former Microsoft chairman Bill Gates, it is not surprising that Microsoft is making reasonable acquisitions at reasonable prices during its mature growth phase.
Activision Blizzard has a leading portfolio of video game franchises, including Call of Duty, Candy Crush, Overwatch, and many others. With such a high market capitalization, it is one of the world's largest pure-play video game developers, ranking fifth in total game revenue worldwide.
Recently, however, the company found itself "on the operating table," so to speak. Last summer, California regulators filed a lawsuit against Activision, accusing it of widespread sexual harassment and gender pay inequality. In November, about a fifth of Activision's employees signed a petition urging CEO Bobby Kotick, who has led the company for more than 30 years, to leave. Although the company has taken various steps to correct apparent misconduct, including firing or disciplining more than 80 employees and altering some internal rules, Activision stock has not recovered and is down more than 35 percent from its February 2021 highs.
Although Microsoft is paying a substantial premium to last week's market price, the valuation is about 25 times this year's average earnings estimate of $3.80. If you pay attention to Activision's net cash position, the valuation drops to about 23. That's a pretty reasonable price for Activision's "drama-free," given the strength of its franchises and the way it has traded in the past.
Even if Microsoft gets a reasonable price for a separate Activision, Activision could be even more profitable in Microsoft's hands than as an independent company.
Given the turmoil in Activision's management, The Wall Street Journal reported that Kotick is likely to leave his post after the deal closes. Thus, new leadership and a culture change at Activision itself could help bring key talent and reinvigorate the business after the current employee crisis.
And just as streaming video platforms are spending heavily on their own content, video games, too, are moving to a subscription-based streaming package model. CEO Satya Nadella has doubled down on spending on native content for Microsoft's Game Pass, which Microsoft said in a press release reached more than 25 million subscribers, up from 18 million in early 2021. Activision itself has 400 million monthly active players, so it's reasonable to assume that some of those users will switch to Game Pass, which Microsoft promotes as "Netflix for gaming."
Finally, in an interview with CNBC on Tuesday, Kotick said that as games increasingly move into the metaverse, gaming companies will need technology expertise that Activision may not have, and it will probably be difficult to attract from the big tech companies -- especially given recent employee problems. Therefore, it does make sense to sell the company to a large tech giant with a variety of technology expertise. Microsoft, of course, has such expertise in abundance, thanks to its Azure cloud platform, Xbox gaming platform, and Hololens AR/VR headset.
While the ZeniMax acquisition went off without a hitch, Microsoft may be pushing the limits of its acquisition capabilities with this deal, given Activision's sheer size. At the time of writing, Activision's stock was only trading to the $82 mark, which leaves a lot of room below the $95 acquisition price. This seems to indicate a certain amount of skepticism about completing the deal.
Microsoft has been very good at avoiding antitrust regulators in Washington, who are instead mostly going after other FAANG stocks, particularly those related to social media. However, Microsoft is also not done with two other noteworthy acquisitions in the process in medical AI and advertising technology. Given the speed and size of the new deals, Microsoft could face a lot of resistance to buying Activision.
Nevertheless, if the deal goes through, it's a huge win and terrific use of the enormous $130 billion cash pile on Microsoft's balance sheet. Microsoft is doing great in the cloud computing and enterprise software markets, and that business alone would be enough for management to rest on its laurels. But to see management working hard to grow its consumer-oriented businesses -- search advertising and video games -- is refreshing. First-rate capital allocation and relentless pursuit of growth is another reason Microsoft deserves its high praise.

MSFT flat correctionElliott wave analysis view for MSFT suggests the decline from November 22, 2021 high is unfolding as a flat correction.
It turned out to be quite an interesting structure. Down from November 22 ATH wave (w) ended at 328.2 as simple ZZ, and rally in wave (x) is expanded flat ended at 343.86 (as we know each reactionary wave, labeled X, can take the shape of any corrective pattern). Wave (y) is ZZ and ended at 317.2. So we have complete WXY combination as a part of wave of flat. Rally in wave ended at 344.3 with internal subdivision as a ZZ. Final leg wave ended at 300.63 as ending diagonal and it has extension 1.272 from wave .
In terms of technical analysis, we have a price stop near the strong level of 305 and a good demand zone from 300.. There is also convergence of price and RSI indicator.
I can assume that wave 4 has probably ended and the formation of sub-waves of the 5th wave will soon begin.

Activision (ATVI) Take profitActivision (ATVI) Take Profit
Time to take profit
After the news of the acquisition by Microsoft for nearly 70 billion dollars, Activision (ATVI) jumps to + 32% from the close on January 14.
If you followed me you will know that my average price was $ 70.71 and at the opening on 1/18, I sold the entire position, taking home the profit, with a gain of 22.64%.
Another good trade to start 2022, which saw me in drawdown for most of the trade.
Obviously, I'm not saying that I expected this, because my trading has always been transparent and visible to everyone, I am one of the very few who says things before doing them and if the reasons why I invested in Activision are well explained in previous posts, but clearly, I was expecting a reversal, even a violent one, but not a 32% gap up. This acquisition, which among other things adds yet another arrow to Microsoft's bow, was not expected and, as far as I'm concerned, I didn't even have any rumors.
A huge trade, therefore, it would have been even more profitable if the price had touched $ 55, where I would have mediated the price further.
Happy trading,
Lazy Bull
DISCLAIMER: I am not a financial advisor nor a CPA. These posts, videos, and any other contents are for educational and entertainment purposes only. Investing of any kind involves risk. While it is possible to minimize risk, your investments are solely your responsibility. It is imperative that you conduct your own research. I am merely sharing my opinion with no guarantee of gains or losses on investments.

Microsoft (MSFT) | The safest place to buy🔥Hello traders, Microsoft in daily timeframe , this analysis has been prepared in daily timeframe but has been published for a better view in 2 day timeframe.
It is better not to talk about the general nature of this wave and only explain the counted part of the wave.
Based on the counting of the first wave 1 and 2, it has ended in a very normal state and now we are inside the third wave.
From wave 3, waves 1, 2, and 3 are completed, and now wave 4 is formed. As we previously thought, wave 4 was formed in the form of a flat, and from this flat, waves a and b are completed, and the structure of wave c is formed.
Wave c is at the end of its trend, both in terms of the number of waves and the ratio between waves a and b of the flat, as well as the ratio of the depth of this correction to wave 4, but the probability of correction to Fibo will be 0.38 and then the wave starts breaking the green circle. 5 is approved.
This analysis is also fielded if the trend moves beyond the resistance indicated by the warning sign.
🙏If you have an idea that helps me provide a better analysis, I will be happy to write in the comments🙏
❤️Please, support this idea with a like and comment!❤️


MONDAY LIVE: SPX500, NASDAQ, EURGBP, USDCAD, USA STOCKHi Traders,
This is my view for this week on:
- SPX500
- NASDAQ
- EURGBP
- USDCAD
- AMAZON
- MICROSOFT
I remind you that this is only a forecast based on what current data are.
Therefore the following signal will be activated only if specific rules are strictly respected.
If you follow my strategy you will be able to identify the right filters and triggers to enter correctly the market and avoid fake signals.
I really hope you liked this video and I would like to know what do you think about this analysis, so please use the comment section below this video to give me your point of view.
Thank You
———————————
Pit from Trading Kitchen

Microsoft Analysis 13.01.2022Hello Traders,
welcome to this free and educational analysis.
I am going to explain where I think this asset is going to go over the next few days and weeks and where I would look for trading opportunities.
If you have any questions or suggestions which asset I should analyse tomorrow, please leave a comment below.
I will personally reply to every single comment!
If you enjoyed this analysis, I would definitely appreciate it, if you smash that like button and maybe consider following my channel.
Thank you for watching and I will see you tomorrow!

MICROSOFT - Short PositionMicrosoft should sell Office and Windows to boost cloud business, former executive says.
Microsoft: Buying at Key Level Microsoft - Short Term - We look to Buy at 306.00 (stop at 290.00)
We look to buy dips. Previous resistance, now becomes support at 305.00. Trend line support is located at 310.00. We have a 61.8% Fibonacci pullback level of 280.00 from 350.00 to 306.74. The bias is still for higher levels and we look for any dips to be limited. Further upside is expected although we prefer to set longs at our bespoke support levels at 305.00, resulting in improved risk/reward.
Our profit targets will be 349.50 and 380.00
Resistance: 345.00 / 350.00 / 360.00
Support: 305.00 / 280.00 / 260.00
Disclaimer – Saxo Bank Group. Please be reminded – you alone are responsible for your trading – both gains and losses. There is a very high degree of risk involved in trading. The technical analysis, like any and all indicators, strategies, columns, articles and other features accessible on/though this site (including those from Signal Centre) are for informational purposes only and should not be construed as investment advice by you. Such technical analysis are believed to be obtained from sources believed to be reliable, but not warrant their respective completeness or accuracy, or warrant any results from the use of the information. Your use of the technical analysis, as would also your use of any and all mentioned indicators, strategies, columns, articles and all other features, is entirely at your own risk and it is your sole responsibility to evaluate the accuracy, completeness and usefulness (including suitability) of the information. You should assess the risk of any trade with your financial adviser and make your own independent decision(s) regarding any tradable products which may be the subject matter of the technical analysis or any of the said indicators, strategies, columns, articles and all other features.
Please also be reminded that if despite the above, any of the said technical analysis (or any of the said indicators, strategies, columns, articles and other features accessible on/through this site) is found to be advisory or a recommendation; and not merely informational in nature, the same is in any event provided with the intention of being for general circulation and availability only. As such it is not intended to and does not form part of any offer or recommendation directed at you specifically, or have any regard to the investment objectives, financial situation or needs of yourself or any other specific person. Before committing to a trade or investment therefore, please seek advice from a financial or other professional adviser regarding the suitability of the product for you and (where available) read the relevant product offer/description documents, including the risk disclosures. If you do not wish to seek such financial advice, please still exercise your mind and consider carefully whether the product is suitable for you because you alone remain responsible for your trading – both gains and losses.

I recommend MSFT for purchaseHello guys , according to my graphical analysis of microsoft , there is a high probability of an increase towards over 327$ in the next few days

MSFT Nice reaction to the previous high area.Today, Microsoft stock (MSFT) retested the previous swing high in this uptrend, which came along with a weekly rsi "reset" to 52. The two previous times msft's weekly rsi has touched 52 has been at $212, and $200. As you can clearly see in the chart, we are in an uptrend, consistently making higher highs and higher lows for the past ~280 weeks. For uptrend dip buyers, the opportunity here is fantastic (once we confirm reversal). As someone who is already holding the stock in profit, my plan is to carefully watch the current price action, to confirm we have put in a higher low. If price begins to close below $300, I will consider selling my position.
Even though I'm not a professional, I felt that I needed to share this as msft's situation feels very precarious and I believe holders must be on the lookout. Thanks for reading!

Microsoft (MSFT) | The best scenario for climbing📝Hello traders, Microsoft in daily timeframe , this analysis has been prepared in daily timeframe but has been published for a better view in 2 day timeframe.
It is better not to talk about the general nature of this wave and only explain the counted part of the wave.
Based on the counting of the first wave 1 and 2, it has ended in a very normal state, and now we are inside wave 3.
From wave 3, waves 1, 2 and 3 are completed and now wave 4 is formed, we assume that wave 4 is formed in the form of a flat and two waves are needed from this flat to complete and the end point of this wave can be due to wave 2 which is deep. It should be around 0.23 and 0.38 and it is better to start the upward movement for wave 3 by hitting the trend line and breaking the upper side of the channel.
The target for Wave 3 is a multi-fibo collision.
If the warning sign is broken down, the field analysis is not done, but it returns to normal.
🙏If you have an idea that helps me provide a better analysis, I will be happy to write in the comments🙏
❤️Please, support this idea with a like and comment!❤️

MICROSOFT Short Term View Bearish Or Bullish 1. Hidden Bearish Divergence
2. Making a double top and Mild Volume profile support at Target 1
3. If he Candle forms Bearish closing daily candle will fall back to Target 2
4,RATIONALE for Bullish Move :
4 a. Can take regression Channel Support and move UP
4 b . Its taking 100 EMA support in Daily TF since Corona Meltdown in March 2020 , May bounce back from there
4 c . Mild support as pr FIBo will push the Price Up , Observe for the Volume building up in Lower TF , If it increase go Long
4 d . Volume squuzed up after profit booking at Demand Zone around 280 levels , May touch and Bounce
4 e. It filled the gap and touched 310 levels and formed a doji candle may consolidate a bit and rise above the 310 levels , wait for candle confirmation in Daily TF
5. RATIONALE for Bearish Move :
5a Next Fibo support at lower levels and next volume support at lower levels .
5 b if there is no accumulation will fall back at the lower levesl , Volume will decide if it goes up from these levels
BULLISH PROBABILITY IS MORE THAN BEARISH .
LIKE IF YOU AGREE WITH THE ANALYSIS

Third Series of STOCKS Buying Areas!Hi followers and other TradingView users,
To discover new and exciting stocks for you, for me, for everyone then please name five stocks that interest you and describe them - why!?
So, I would like to know FIVE of your favorite stocks, criteria to get your mentioned stocks into the list:
1) Name FIVE of your favorite stocks - full name and ticker. For example, Apple ( AAPL ), Tesla ( TSLA )...or just ticker, the ticker is a must-have!
2) Hit the "like" button of this post.
3) Hit the "follow" the get the update as fast as possible.
TOP10* most mentioned stocks get analyzed. My technical analysis will point out some possible breakout opportunities to buy the strength and corrections to watch - pointing out some lower levels where your alerts should be set!
* if it is not possible to identify logical buying areas from the graph, then I choose the ones (from the list) that have them.
Stay healthy,
Vaido

Weekly Swing 30 point spreadAcross 7-8 day period Microsoft is at the bottom of RSI,MACD is showing slow down of buying pressure, zig zag swing high/low is changing direction to match bullish sentiment, Rising along and holding below moving average, looks as if it will cross over from bullish to bearish sentiment as well. All sign pointing at a reversal to the weekly resistance of 341 from the low of 313.
2 month call
2 contracts
340 call march 2022 exit at RSI REVERSAL 30 point spread

"Spit Shining Warren Buffett's Shoes.."If we follow through on this $315 mark then I'm shorting every bounce like Michael Burry during the housing bubble crisis.
Bill Gates will be left spit shining Warren Buffets shoes for pennys if he holds on to this stock in 2022.
Will you hold onto a parabolic stock at the top?
Or will you short the market in 2022?
Choose.
- Ninja

MSFTTriple top from a weekly key level, broke an upward channel and daily resistance. It is due for a correction and I expect it to fall under 300 area.

100sma is being tested for the 10th timeMSFT has tested and bounced of the 100sma 9 times, since September 2020.
In all of the 9 tests, RSI was in the 30s, but not oversold. It is currently at the same level.
Besides the multiple tests of the 100sma, we have three tests of the bottom of the horizontal range (drawn with purple horizontal lines). We could potentially see a fill the gap situation short-term.
I think it is a great place to buy.
Placing layered stop-exits to preserve gains.
Risk-reward-ratio is over 4, for a better understanding of the trade, check the Long Position projection to the right of the chart.
Good luck.

