Microsoft Up 1739 Points!Microsoft has progressed nicely since the last post a week ago, moving up 1739 points
at the time of posting and still moving strong.
Price has not made contact with the weekly 50 simple moving average since March 2020,
but it has been using the daily 20 & 50 simple moving averages as support.
We have been seeing deep pullbacks since 2020, but from June 2021 the behaviour
of price has changed and we are seeing more of a linear clean move.
Earnings came out on July 27th, which didn’t disrupt the flow of price. A mini
consolidation has followed earnings and we now await a breakout above the current
all-time high at $290.
A break and close above the recent high will confirm a trend continuation and a move
towards the $300 round number.
How will price react to the $300 round number? This is anyone’s guess, but the
momentum should take price higher over the long term.
See below for more information on our trading techniques.
As always, keep it simple, keep it Sublime.
Microsoft

Microsoft short (simple analysis)Possible presence of a channel where the price fluctuates. Key point for trend relaxation to occur.


MICROSOFT BreakoutAn asset I have been watching for over a month now has finally flashed some signals I have been waiting for as it has done something very major that not many will realize until weeks from now and that is that it has broken bullish out of a huge ascending channel pattern. This pattern has kept the price consolidating inside of it since September of last year and appears to be in the process of confirming this on the weekly time frame by bouncing nicely off of $283.43. This is very important because this price corresponds with the .786 fibonacci level, a level regarded as a major pivot spot for swings. Often known to be reversal areas, they can equally be a springboard for higher prices when support is found on this level. And that is exactly what appears to be taking place as we speak.
I have been in a long at $290 with orders waiting around $283 and sub $283 as well.
Potential target area is $295 as a new all time high in the near future, followed by an additional 5% move to $311.

$MSFT Earnings Season! $300 PT REMAINSUpdate video on $MSFT if you havent seen any of my previous videos on $MSFT it may be worth checking out.
Thank you for all the support

MICROSOFT - My Trading Plan in 2 mins!Hello everyone, if you like the idea, do not forget to support with a like and follow.
Here is the top-down analysis for MICROSOFT, feel free to request any pair/instrument or ask any questions in the comment section below.
Best of luck!

Microsoft weekly analysis (MSFT)Hello everyone , as we all know the market action discounts everything :)
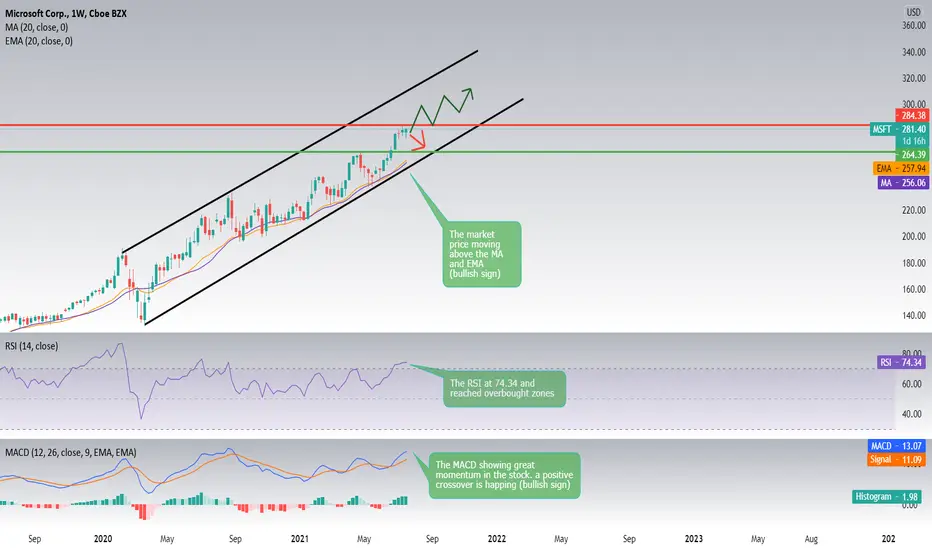
The MSFT seems to continue its bullish movement and the stock price seems to be trading in an upward channel as we are getting higher highs and higher lows, MSFT is currently trading near its 52 week high, which is a good sign. The S&P500 Index is also trading near new highs, which makes the performance in line with the market.
The average volume is 23872600. This is a good sign as it is always nice to have a liquid stock.
The long and short term trends are both positive. This is looking good! We could be seeing the price reaching a new high soon and even maybe hitting the ranges if 290.
using different indicators to understand the trend where :
1_The stock price at 281.40 trending above the MA and the EMA. MA at 256.06 and EMA at 257.94 (bullish sign)
2_The RSI is at 74.34 and reached overbought zones showing great strength in the market with no divergences between the market and the indicator. (bullish sign)
3_The MACD showing great momentum in the stock. a positive crossover is happing (bullish sign)
Support & Resistance points :
support Resistance
1_ 276.86 1_284.38
2_ 272.96 2_288.00
3_ 269.34 3_291.90
Fundamental point of view :
MSFT's return on assets of 18.13% is amongst the best returns of the industry. MSFT outperforms 95% of its industry peers. The industry average return on assets is -4.03%.
The stock has a profit margin of 35.02%. This is amongst the best returns in the industry. The industry average is -8.63%. MSFT outperforms 95% of its industry peers.
Microsoft said Wednesday it’s acquiring CloudKnox, a start-up whose software helps companies reduce the amount of access they provide to their cloud resources. Terms of the deal weren’t disclosed.
The move represents another step Microsoft is taking to expand its security business, in addition to working to keep Windows and its other products secure.
Over the past 5 years, MSFT shows a quite strong growth in Earnings Per Share. The EPS has been growing by 18.13% on average per year. And the stock has a Current Ratio of 2.29. This indicates that MSFT is financially healthy and has no problem in meeting its short term obligations.
_____________________________________________Make sure to Follow and Like for more content_____________________________________________
This is my personal opinion done with technical analysis of the market price and research online from fundamental analysts for The Fundamental point of view , not financial advice.
If you have any questions please ask and have a great day !!
Thank you for reading.
IBM CONFLUENCE RESISTANCE - GAP ABOVE - ALL IN ON IBMAll,
I think IBM is primed to breakout big time downtrend is almost broken and would regain a lost massive support of an uptrend. If this gaps or breaks above I kid you not I will be closing other positions and going long call options with 2-3 month expiration on this and scale in every dip this could hit 180s with ease after breaking.

Quisitive Technology Solutions TA and thoughts $QUIS.VHey Folks,
Quisitive won Microsoft's Healthcare Partner of the year award today. This was made possible by Quisitive acquiring MazikGlobal which was a premier partner of Microsoft prior to; they were (Quis is) considered "Partner 0" in Healthcare for Microsoft. In addition to LedgerPay Bank Sponsorship being announced, Quisitive has some stuff going for it. It has been getting strong PT upgrades. I think it is one worth watching over the next week to see how it behaves around entry into -3SD data territory. Regression to the mean is our friend here if you are long. Buyers matching sellers for some tight action over a couple days could set that up. Eyes on Volume.
If Quis slips into that last channel I believe It will present a great buying opportunity for a long add. I have a Limit buy in for $1.48 to catch any weakness tmrw on the open, adding to my own position.
Please note I had links to the stated accomplishments (award and PT) but TV wont let me publish the idea with links in the notes here. I used yahoo finance and tipranks to source those pages. You can find them across other sites as well.
Please do your own DD and follow your own trading rules.
All the best,
Luke

MSTF 1H What Can Stop Microsoft's grow Supercycle?Today, we will look at the behavior of the share price of Microsoft Corporation on a global chart.
Patient investors have been gaining the position of Msft shares for 13 long years, and the price itself during this period was stuck in the consolidation of $20-37
However, look at the result: as of now, the share price has risen +1000% , and the super cycle of growth itself has been going on for 8 years.
Moreover, during this long super cycle of growth, there have not yet been significant corrections. The recent news that the Pentagon is breaking a $10 billion contract with Microsoft shook the share price down 1%, but the next day, Msft's share price updated its all-time high.
Even during the Covid market drop in February-March 2020, Msft shares fell by only -30% and left the price within the parabolic rally. For example, then the S&P500 fell by -35%, the DJI index -38%, and for example, the hypes TSLA shares by as much as -60%
By the way, yesterday we made an idea for TESLA, we invite you to view:
For ourselves, we set the bar for the growth of Msft shares to $349-350 , from where a long correction may begin. Of course, against the backdrop of such a powerful growth, it is hard to believe in such a deep correction, but it would be nice to test the strength of the top level of $60 per share for Microsoft
An alternative scenario is a breakout and consolidation of the price above $350 , then nothing will prevent the price from moving further with parabolic growth, and the zone of $825-880 per share of MicrosoftCorporation will wait from above

MSFT close to sell areaMSFT has a little more to go before it's in the Sell range.
BlueWave is overmatured, really wanting to give Red Dot sell signal
Stochastic RSI is Extremely Overbought


MSFT: Consolidation.A breakout of the resistance level around 233 may lead to an increase in the price to the 269 area.

Microsoft Major Bullish Breakout Today?MSFT has miraculously just broken bullish out of a bearish ascending channel pattern. If the red trendline of resistance-now-flipped into support can hold, look for fireworks as your first target may be around the $295 area. Only about a 6% gain but it could move there in a hurry and that would be just getting the party started.
This could be a very bullish occurrence for the asset as NVDA some time ago did a similar move by breaking bullish out of the same bearish ascending channel pattern. The move for NVDA resulted in a 27% gain. Keep your eyes on this one.

Microsoft At top Channel - Daily MSFTYou can sell here and wait to react to the mid or bottom channel


MSFT - LT 390 PTAs you can see we have parabolic steps on the monthly time frame. MST is in that final phase now and looking to push much higher in time. GL

MSFTMicrosoft!! It has ran good in last month or so looks like it can retrace a little bit from this levels. May be 255-58 would be decent . It is also in upward parallel channel and is about to breakout that if it does can test 280 before downward move. Nothing to do as of now but very much interested to buy if we get dip around 255 levels.

Microsoft Trending Towards $300!Microsoft’s movement has been relatively predictable over the last few years, as you can see
on the monthly timeframe. We have seen trends followed by consolidation/pullback, then
trends again and so on.
Currently, price is in the trend phase and there are also smaller areas of consolidation on the
daily timeframe (not shown).
The most recent consolidation period was from April this year and lasted up to last month,
where price broke above the previous all-time high at $263.
If price encounters another pullback, then the 50 simple moving average is below to catch price
and act as support. The last time price made contact with this indicator was in March 2020.
As price has remained a reasonable distance away from the 50 simple moving average,
it highlights how good the trend currently is performing.
Going forward, we want to see a more linear-looking trend develop, one with shallow
pullbacks and smaller areas of consolidation.
We now want to see price continue to trend towards the $300 round number as the
bullish momentum builds up.
See below for more information on our trading techniques.
As always, keep it simple, keep it Sublime.

$MSFT Looking For Support VIDEO UPDATEVideo update on $MSFT After we have a lower time frame support break of the ascending wedge.
More details within!

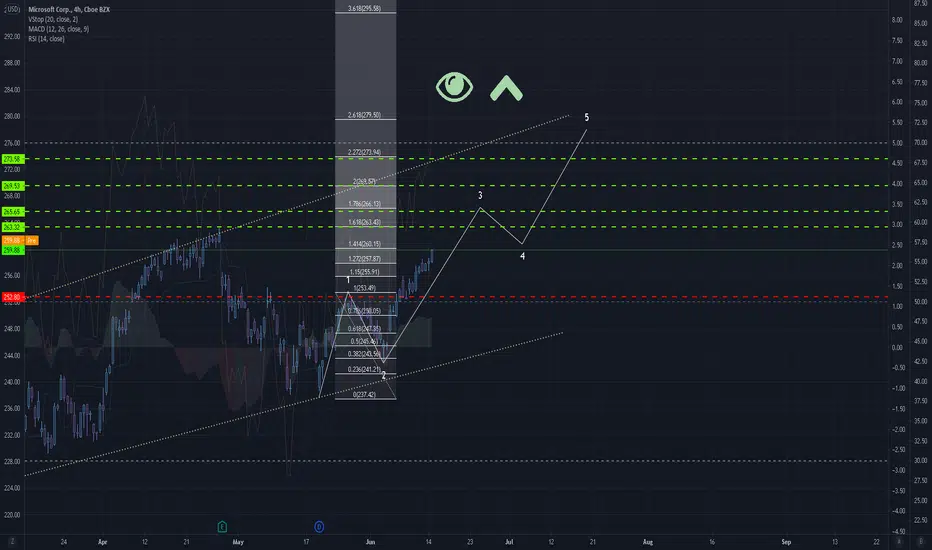
Microsoft soaring even higher. MSFTHere looking at a local impulse, be it a part of a larger diagonal, channel or an even bigger impulse. Feeling confident to go green on this one, but you know how these spiels finish.
Fibonacci goals are in green, reversal or invalidation is in red. This post is not financial advice, make your own financial advice or pay a certified professional ( you are to statistically faire better at blindly longing SnP500 incase of the latter). Playing on the market whether you are an investor or a trader is risky. No good thing is ever without. Good luck out there.
Another target hit, but we have a caution sign here! ⚠️Ok, MSFT finally closed the gap, as we expected it would, but now it has some problems, and we must be aware of them. First, we have a divergence on the RSI, indicating some exhaustion. Second, it lost the 257, and although it did a brief recover to the 20ma, it couldn’t keep above the black line.
In our last analysis, I was saying that the gap were at a 261, but in the daily chart it was already closed, and now MFST is indicating more exhaustion.
It can’t break the 260, and it is doing a correction now. I think that now it is time to start selling instead of buying. By hitting the 253 again, I think it’ll give another chance to buy, but I’ll change my bullish bias to a neutral bias.
If you liked this trading idea, remember to click on the “Follow” button to get more trading ideas like this, and if you agree with me, click on the “Agree” button 😉.
See you soon,
Melissa.

$MSFT Support Bounce or Shoulder Building 6/14 (UPDATE)Update on last weeks video where we secured a bounce off support and a entrance into the gap. Looking into the potential cup and handle or even ascending triangle forming on the daily at $MSFT previous highs! Thank you for tuning in, and make sure to follow us for more breakdowns!
