MSFT- Earnings in Focus - Is That A Head and Shoudlers or Not?Here's a brief analysis of the potential for a Head and Shoulders Pattern forming in MSFT
Thanks for having a look at my take on this.
Let me know how it goes and how you view these recent movements
And if this analysis helps, I'd really appreciate a like, it lets me know I'm doing useful work.
Building upon my recent discussion of a Cup and Handle or a Double Top I'm having a look at how each of these scenarios will play out in constituent stocks, especially with earnings season being underway.
Head and Shoulders
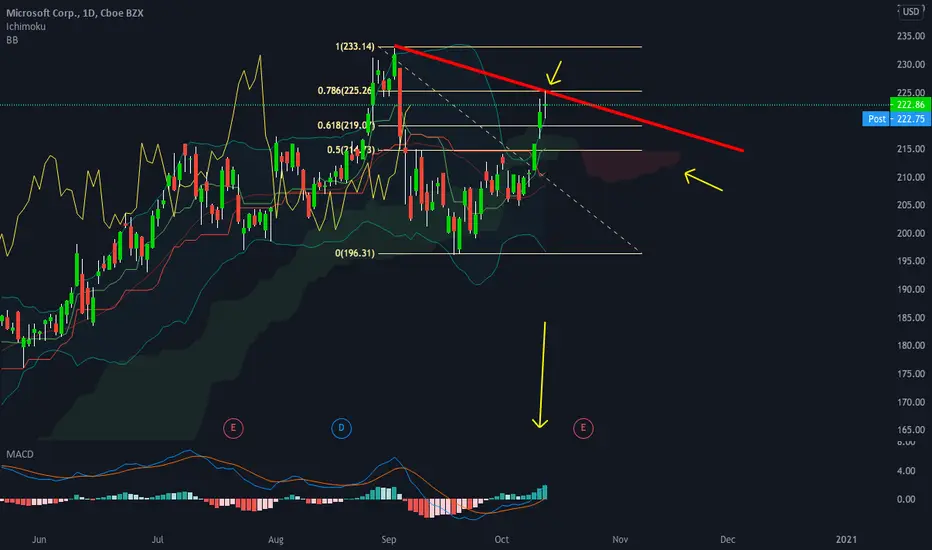
MSFT has recently broken above it's hard resistance of $217 which may have put to bed some investor's fears of future downside. However when looking at the weekly chart:
It can be seen much clearer that this past week has formed a Spinning Top above 216 which is a weak break from the Head and Shoulders pattern formed. This has been caused by a failure to break $225 which would have truly confirmed a rally to higher prices. Furthermore, price action over the last month has failed to regain ground into the Parallel Channel that brought MSFT out of its Covid dip, leading to a stall in momentum seen clearly in the Weekly Chart. This is likely leading to Investors desiring a better buying opportunity in the future.
A break below $220 today will likely lead to fear among investors and may cause prices to test the relatively strong Support of $217. It is unlikely this support of $217 will be breached but a failure to move substantially away from $217 at the close may lead to fear going into next week where this pattern will either be confirmed or debunked.
Verdict
It is unlikely MSFT will be hit down anywhere close to Covid Levels however potential to hit $200 is present and $180 if future negative fundamentals come into play. Be cautious and wait for a serious break of $217 to short. The next support at $210 is even stronger and without a serious surprise hit to earnings, it is unlikely to drop below this. Therefore $210 could act as a buy signal which may cause a move back above $217 and further.
Best of luck and Stay Disciplined
Microsoft

with the covid 19 and the us election this will correct with the covid 19 and the us election this will correct 1 more time to the down side

AMAZON COM INC - BUYHello Friends ! -- please support us with like and share with us your opinion in comment
---------------
So, as you see the market was in a downtrend (marked in green) follow by a high volume at the bottom and a candle that breaks the VWAP , so now is the right time to buy shares . and you can strengthen your position in the candle marked in the graphic
Thank you


Short on open: 209.40
Real-Time Algorithmic Trading Signals. All trades are based on a Geometric HMM.
The Ingenuity Trading Model is a Geometric Hidden Markov Model with specific inputs related to Price, Time, Volume , and Volatility .
Our Algorithmic Trading Model offers real-time buy or sell signals with specific entry and exit prices. This affords you the freedom to successfully trade across all markets and market regimes. We are not interested in biased economic research or opinions on the latest Wall Street narratives. We do not trade based on conventional financial analysis. Our signals prove the power of taking a more scientific approach to trading the market.

Sell Microsoft 24/9/2020Microsoft stock is moving in a short term downtrend
EMA 13 broke down EMA 34 with prices dropping when testing them
And high trading volumes
So it can sell
Target 180.5 stop losses 210.09

MSFT Microsoft path and directionHello everyone
In MSFT we had a uptrend channel since April and the uptrend was broken in September
Watch key levels in chart and price action in lower time frame for decision
trade with care any question feel free to ask me :)

Microsoft MSFT is at a strong support - going up from hereMicrosoft MSFT is at a strong longterm 3/1 gannfan support that lines up with the 200sma atm. On shorter term timeframes it made a bullish structure by making higher lows (ascending triangle) and now the next target to break and retest will be the 50sma that will line up with the middle ganfan line between the 2/1 and 3/1 one. Overall we going to continue going up until the 2/1 top gannfan line which will slightly make higher all-time highs at around 249$ price levels

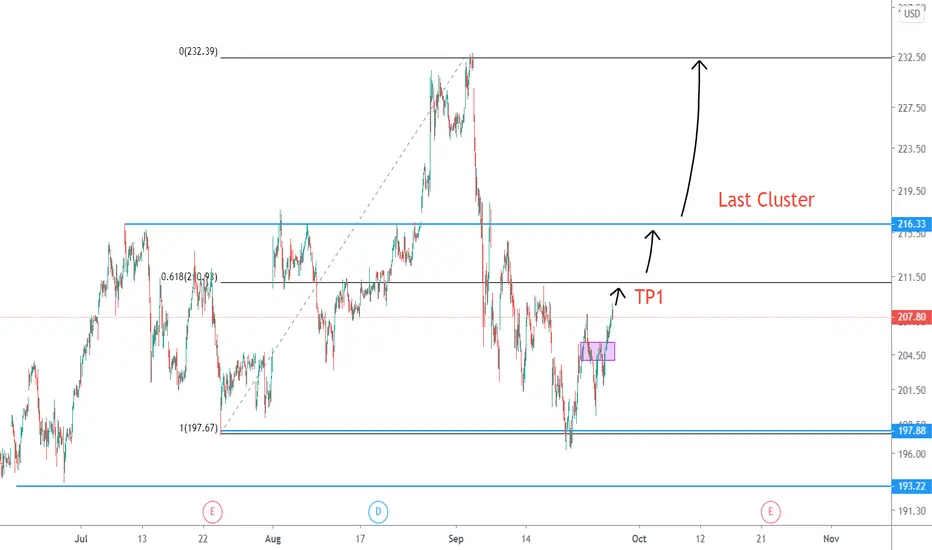
Long position on MSFT/MicrosoftThe price has made a head and shoulders chart pattern, every line is a big resistance and after breaking through every line if we see a pullback to the line it might consider as a good entry point with considering the next line as TP .
GOOD STRADDLE OPORTUNITYAfter the fall of these last weeks (fall that has occurred in all markets, not in Microsoft exclusively), a rejection at lower prices appears again (the last arrow), prices that have already been tested (in the first arrow)
Is this a double bottom pattern or is it in range?
I would say that it is a semi-range with greatly bullish connotations, personally I would open a bullish ratio straddle 2: 1

microsoftthe sellers are gettin weack after a big rally we can make a good profit of it
the microsoft is getting supported with a big support line after breaking the first prz it can be goo tiny profit
but after crossing the big prz point im going for huge profits
like and share if it was helpful

Buy Microsoft 16/9/2020Microsoft stock is moving in a sideways direction. between 230 and 199. with high volume
So you can buy
Target 230
stop loss 198.15
Good luck

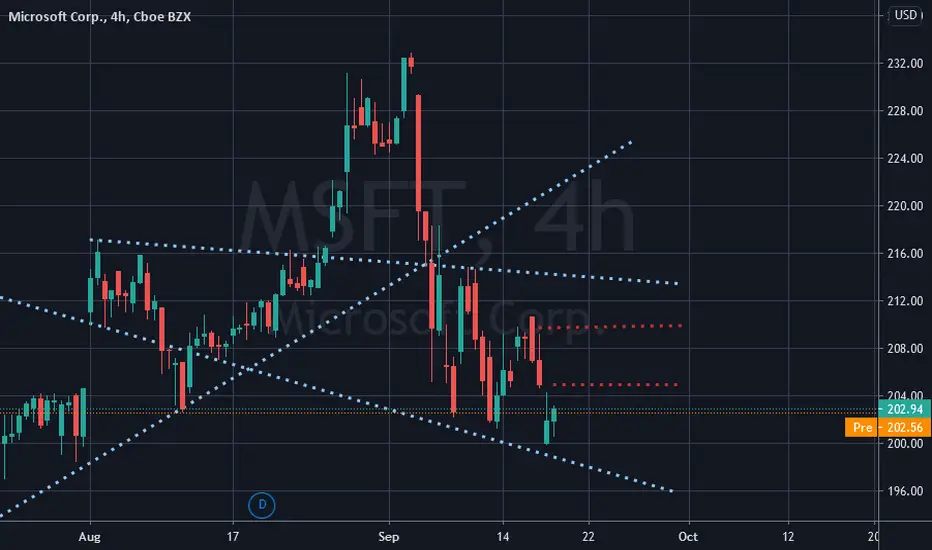
Microosft..... Todays range of trading....Range marked in blue trend lines
resistance marked in Red....
Share... Like... Follow...
Microsoft weekly RSI/MFI divergenceObvious divergence showing on the weekly MSFT chart. However it found support right at 100 Hullma. Let's see if the hullma can be broken. Weekly divergence should take much longer to play out.
Microsoft found a strong support level and is going to reverseMicrosoft has found a double bot on the 200 ma and the 8/1 gann fan line and is now going to continue its way up until 1.618($254) level with some stops inbetween on the 2/1 gann fann line that will be the 0.618 fib level. A strong momentum shift around those strong support levels

MSFT LONG SET UP (MICROSOFT CORP.)TITLE/(DATE)- BUY MSFT/USD
ASSET- STOCK
PLATFORM-MT4
ORDER TYPE- BUY Market
Time Frame-4hr
ENTRY PRICE 1- $206.50✅ market
ENTRY 2- $202.50 pending
STOP LOSS- $199.50 (70 PIPs)
TAKE PROFIT 1-$213.50 (70PIPS)
TAKE PROFIT 2- $220.50(140 PIPS)
TAKE PROFIT 3- $227.50 (210 PIPS)
TAKE PROFIT 4- $234.50 (280 PIPS)
TAKE PROFIT 5- $241.50 (350 PIPS)
STATUS:🏃🏽♂️RUNNING 🏃🏽♂️

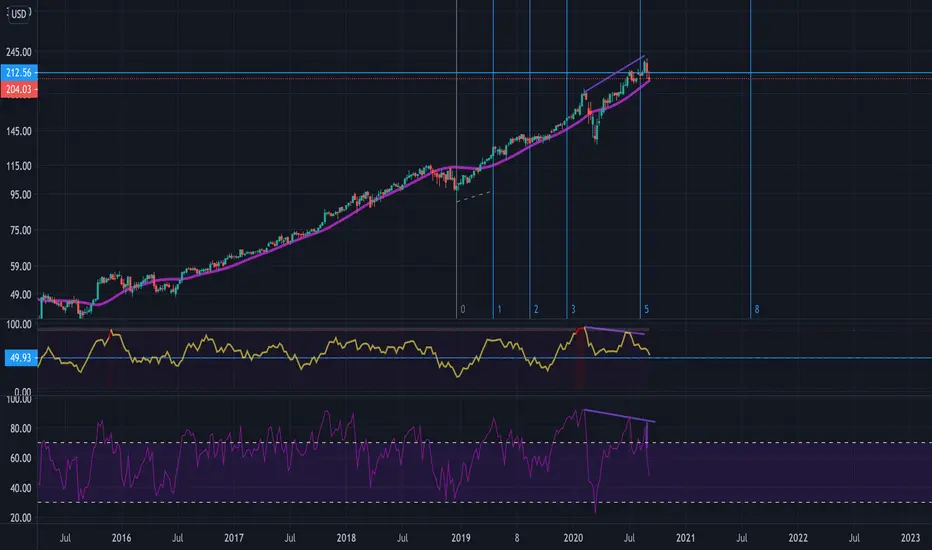
Microsoft - There is one more leg up
I think now we are seeing the start of wave 4
The worst for bull case is we will go to around 190-ish and consolidate before another push higher.
I don't like how RSI is never bought...
Let's see what's coming for NASDAQ:MSFT this month

Microsoft Stock AnalysisBased on Technical analysis, the idea is to go long for a long term investment ONLY if the resistance level of 215 USD will be broken in the next days otherwise hold.

MSFT - buy support zones analysisHello traders,
Description of the analysis:
Microsoft ( MSFT ) support zones ideal for timing long positions (gray). Trade what you understand, trade carefully and sparingly according to the business plan.
About me:
Hi, my name is Jacob Kovarik and I´m trading on stock exchange since 2008. I started with a capital of 3000 USD. My first strategy was based on OTM options. (American stock index and their ETF ). I´ve learnt on my path that professional trading is based on two main fundaments which have to complement each other, to make a bussiness attitude profitable. I´ve tried a lot of techniques and many manners how to analyze the market. From basic technical analysis to fundamental analysis of single title. My analytics gradually changed into professional attitude. I work with logical advantages of stock exchange (return of value back to average, volume , expected volatility , advantage of high stop-loss, the breakdown of time in options, statistics and cosistent thorough control of risk). At the moment, my main target is ITM on SPM index. Biggest part of my current bussiness activity comes from e mini futures (NQ, ES). I´m trader of positions. I´m from Czech republic and I take care of a private fund (over $4.000.000 USD). During my career I´ve earned a lot of valuable experience, such as functionality of strategies and what is more important, control of emotions. Professional trading is, in my opinion, certain kind of mental training and if we are able to control our emotions, accomplishment will show up. I will share with you my analysis and trades on my profile. I wish to all of you successul trades.
Jacob


