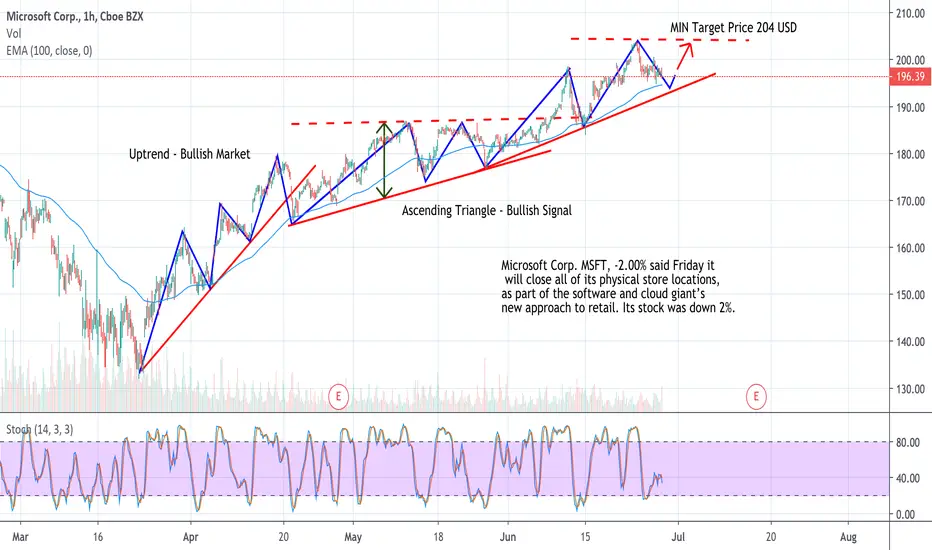
MICROSOFT - MSFT stock AnalysisBased on Technical Analysis, the idea is to go long as per major trend. Before going long wait that the trendline will be tested or wait that the moving average will work as support for the price movement.
Fundamental analysis:
Microsoft Corp. MSFT, -2.00% said Friday it will close all of its physical store locations, as part of the software and cloud giant’s new approach to retail. Its stock was down 2%.
Microsoft
APPLE 🟩🟨🟥 True Facts About Justin Bieber's Love of Apple💬Apple closed some stores for COVID related reasons in some states, but it also opened stores due to re-openings in other states. That is sort of mixed news for Apple.
Meanwhile, the fear in the market over a bearish IMF report and some rising COVID cases is legitimate.
Overall, however, there is logic and reason to bet on Apple.
Apple just made a string of bullish announcements at their recent digital-only keynote and Apple's chart is generally very bullish and tends to respect support/resistance levels.
Let's take a look at some Apple levels that the bulls will need to deal with to keep this tech giant's bull run going.
Hit that 👍 button to show support for the content!
Help the community grow by giving us a follow 🐣
-----
Support:
S1: The S1 S/R flip and pivot point is a logical place for the bulls to find support if they should need it.
S2: The S2 orderblock is good backup support for the bulls. The market is a bit jittery right now, so it wouldn't be shocking to see a further correction and a reaction at S2.
S3: Finally, the S3 S/R flip and price pivot point at the previous all-time high (ATH) range should hold if a more substantial correction ends up being needed. Apple has every reason to keep running, but no asset is immune to the eventual correction after a big run.
Resistance:
R1: The R1 orderblock at the recent swing high and all-time high is the only identifiable level of resistance for Apple. As the only current level, it'll be important for the bulls to break this one and find support on top of it.
-----
Summary:
There are two likely paths for Apple.
One path we see the bulls quickly take out the all-time high and then find support on top of previous resistance.
The other path we see a continuation down, likely after a rejection of R1.
The path downward becomes more likely if the virus fears ramp up, as without fear it is hard to see why investors aren't rushing back into Apple.
Resources:
www.cnbc.com + www.cnn.com + www.npr.org
✨ Drop a comment asking for an update, we do NEW setups every day! ✨

Buy Long: Fortinet Inc - Technology Software InfrastructureBuy Long: Fortinet Inc - Ticker: FTNT - Sector: Technology Industry: Software—Infrastructure
Go to the Invest2Success Advisory Page and Also for USA Asia Financial Forecasts
Buy Entry: 136.58 to 144.25
Stop-Loss: Available to Subscribers
Take Profit Price Targets: Available to Subscribers
NASDAQ:FTNT
NASDAQ:CSCO
NASDAQ:CHKP
NYSE:PANW
NYSE:JNPR
NASDAQ:MSFT
$FTNT #fortinet $CSCO #ciscosystems $CHKP #checkpointsoftware $PANW #paloaltonetworks $JNPR #junipernetworks $MSFT #microsoft #technology #coronavirus #stocks #stockmarket #wallstreet #nyse #sp500 #nasdaq #investing #investors #trading #traders #markets #speculating #finance


🚨 Compression On Microsoft! (MSFT)💰 LET'S GET INTO SOME MICROSOFT ANALYSIS!💰
1️⃣ First off SMASH that LIKE BUTTON & Give us a FOLLOW for DAILY ANALYSIS! ❤❤❤
(Overall Market Sentiment) 🐻 Bearish
- Currently showing signs of compression at previous structural high. A pullback would indicate a double top.
- The candle is still green but is a doji at a very critical price area. Next we want to see it xrop below the green and then the red line for a strong selloff.
- All 3 ema dots on the bottom are firing red, indicates a bearish sign.
- I will be taking a short here and setting a 1% stoploss.
Drop a comment down below and share your chart with us, we would love to see what you think will happen next! 🍻🍻🍻🍻🍻❤❤❤❤❤❤
Thanks for checking out our analysis! ✌😁✌
🥇MLT | MAJOR LEAGUE TRADER


🤔 Hidden Bearish Pattern For Microsoft? (MSFT)🐻 Similar to amazon stock I notice a rising wedge from the main structures. This could lead to a fakeout trap as we approach the upside of previous high and selloff.
Patterns do not always mean what they are said to mean in the textbook but we can use them to help us look for our next play. The top of the wedge lines up with previous high. Be cautious. Play short if the bottom support of wedge breaks.
You never know we could get caught off guard and the bulls could run it up. Anything is possible. Just manage the risk if it were to flip.
Happy trading! ✌😁✌
🥇MLT | MAJOR LEAGUE TRADER


Microsost to go 3.5% bullish move!!!Microsoft is currently retesting a demand zone and may likely go back to previous supply zone, giving traders a 3.5% return on trades.


Microsoft ($MSFT) and Apple ($APPL) 💻 | New Highs for the Market🐮🖥️🐮 Apple and Microsoft are giants of tech and some of the largest holdings of the major indexes. If these companies run, not to mention the other tech giants like Facebook and Alphabet, then the markets will almost certainly run with them.
Just look at the top 5 holdings of the S&P :
Microsoft Corporation 5.68%
Apple Inc. 5.60%
Amazon.com, Inc. 4.26%
Facebook, Inc. Class A2.16%
Alphabet Inc. Class A1.68%
Alphabet Inc. Class C1.68%
Here are the top 5 holdings of the Nasdaq :
Apple Inc. 11.83%
Microsoft Corporation 11.41%
Amazon.com, Inc. 10.25%
Facebook, Inc. Class A 4.35%
Alphabet Inc. Class A 3.88%
Alphabet Inc. Class C 3.85%
Here is the top DOW holdings With non-tech excluded (Microsoft is the 6th on the list, Apple is still #1):
Apple Inc.9.14%
Microsoft Corporation 5.07%
It should be obvious to you now what we mean when we say " if these stocks run, then the market runs ." We mean, they are the biggest parts of the major indexes!
This is good news for the bulls, because run is exactly what is about to happen based on historical trends.
Some people seem to think that these tech stocks rushing past new all-time-highs perhaps signals the top of not only these companies but the market. In fact, we commonly hear this sort of sentiment every time it happens. Reality is just the opposite.
The fact that these companies are breaking all-time-highs is actually bullish for them and the market as a whole.
On top of that, the news is bullish for these companies as well (COVID aside). We have new iPhones, a slick new MacBook Pro, a new Surface Duo, and a declaration against Face ID for Microsoft.
In short, there is nothing really substantial to bring these giants down aside from the broader market, but again, it is more likely they bring the market up. Don't take our word for it though, the historic patterns are clearly illustrated on our charts.
On the charts, you can see yellow horizontal lines marking off each new high. You can clearly see that the longstanding pattern is that breaking a new high is bullish for both Apple and Microsoft (with this being true in spite of any bearish disbelief).
In summary, breaking all-time-highs with conviction is bullish for the tech giants, which is bullish for the markets. So after that last break, our only questions are "when" and "how high?"
Resources: www.etf.com + www.forbes.com + www.forbes.com + www.foxnews.com + mspoweruser.com
✨ Drop a comment asking for an update, we do NEW setups every day! ✨
Like, Comment & Follow to help the community grow 🎉🎉

MICROSOFT LONG Trading PlanMicrosoft's software and services are closely tied to enterprise environments, and computing capabilities have never been more in demand. The shift to working from home has been a major boon for two key components of Microsoft's business.
Key Trading Plan:
i) LONG when it reaches the pull back 1 at 186.75 or pull back 2 at 178.85 with the target Take Profit point at 200.
Author:
S.I.D. Aizu

Microsoft - Price ReversalOur long term buy signal posted on May 2 was accurate
The short term objective of $190 posted on May 3 was also successfully reached
A shooting star formed along with large selling volumes today.
Price is now heading toward the next support at $180-181.


MSFT in case of ↘↘Depending on a lot of sign MSFT going to be With a huge endurance decreased and it's the perfect time to sell


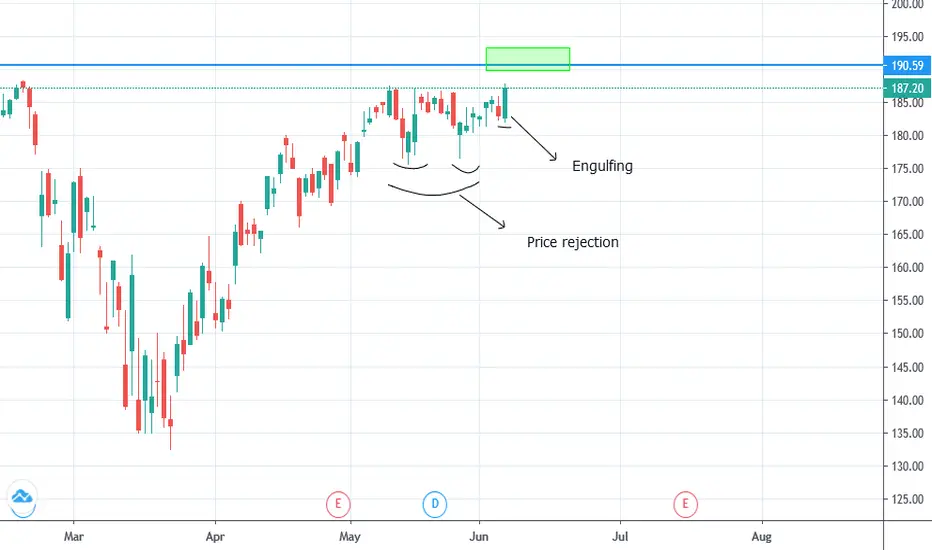
MSFT WEEK ANALYSISFrom a technical point of view, the price rejects prices below the last lows, and a bullish engulfing candle pattern appears.
The forecast is a rise to at least the maximum.