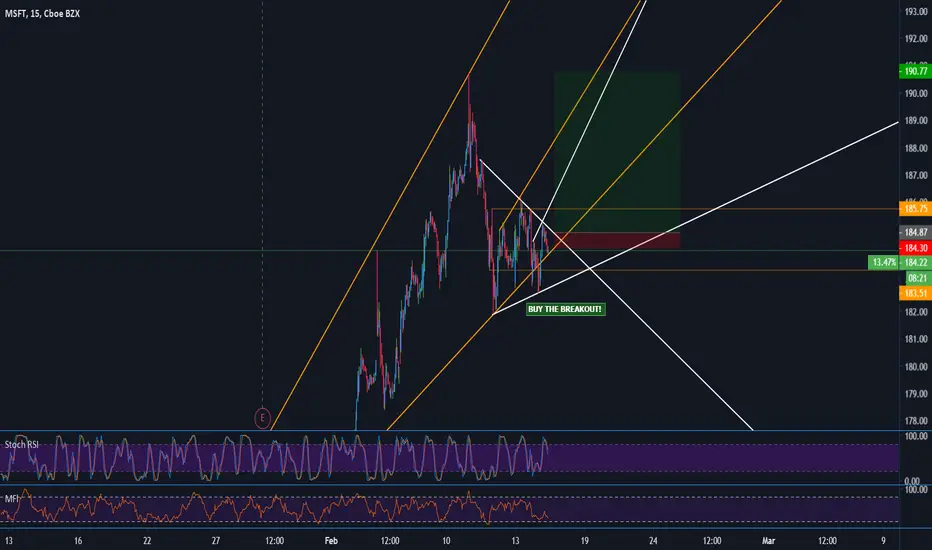
Microsoft Corrects | Bottom Of ChannelGood afternoon traders, If MSFT can hold its correction back into channel we should see some nice positive movement. This move down was mainly due to the JEDI ruling which learned toward Amazon. Quick TA, Please share your opinion, always love to hear!
DotcomJack
(I'm not a financial advisor... blah... blah.. I'm not providing financial advice..
Microsoft
BILL ACKMAN, JOHN PAULSON & SARAH KETTERER UPS STAKE IN VIAC Here's yet more BULLISH news for VIACOMCBS (VIAC)
We feel along with several other large institutional investors that VIAC is DIRT CHEAP!
News Releases..
www.benzinga.com
www.gurufocus.com
DISCLAIMER
This website and our posts are for general information only. No information, forward looking statements, or estimations presented herein represent any final determination on investment performance. While the information presented in this website and our posts has been researched and is thought to be reasonable and accurate, any investment is speculative in nature. StockKid, and/or our agents cannot and do not guarantee any rate of return or investment timeline based on the information presented herein.
By reading and reviewing the information contained in this website and our posts, the user acknowledges and agrees that StockKid, and/or our agents do not assume and hereby disclaim any liability to any party for any loss or damage caused by the use of the information contained herein, or errors or omissions in the information contained in this website or our posts, to make any investment decision, whether such errors or omissions result from
negligence, accident or any other cause.
Investors are required to conduct their own investigations, analysis, due diligence, draw their own conclusions, and make their own decisions. Any areas concerning taxes or specific legal or technical questions should be referred to lawyers, accountants, consultants, brokers, or other professionals licensed, qualified or authorized to render such advice.
In no event shall StockKid, and/or our agents be liable to any party for any direct, indirect, special, incidental, or consequential damages of any kind whatsoever arising out of the use of this website, our posts or any information contained herein. StockKid, and/or our agents specifically disclaim any guarantees, including, but not limited to, stated or implied potential profits, rates of return, or investment timelines discussed or referred to herein.

SONIC THE HEDGEHOG SETS RECORD - $70 MILLION - STRONG BUYBUY VIAC WHILE IT'S DIRT CHEAP FOLKS...
THE STOCK IN OUR OPINION, IS OUTRAGEOUSLY CHEAP AND AN INVESTOR'S DREAM STOCK FOR SHORT & LONG TERM
AS YOU CAN SEE, THE CHINA VIRUS IS NOT HURTING VIAC OR THE MOVIES
PARAMONT HAS A BUNCH OF NEW AND EXCITING RELEASES IN THE WORKS INCLUDING A NEW TOP GUN MOVIE...
SEE PRESS RELEASE...
www.wsj.com
FULL RELEASE
news.futunn.com
LONG 2.5 MILLION SHARES
STRONG BUY
DISCLAIMER
This website and our posts are for general information only. No information, forward looking statements, or estimations presented herein represent any final determination on investment performance. While the information presented in this website and our posts has been researched and is thought to be reasonable and accurate, any investment is speculative in nature. StockKid, and/or our agents cannot and do not guarantee any rate of return or investment timeline based on the information presented herein.
By reading and reviewing the information contained in this website and our posts, the user acknowledges and agrees that StockKid, and/or our agents do not assume and hereby disclaim any liability to any party for any loss or damage caused by the use of the information contained herein, or errors or omissions in the information contained in this website or our posts, to make any investment decision, whether such errors or omissions result from
negligence, accident or any other cause.
Investors are required to conduct their own investigations, analysis, due diligence, draw their own conclusions, and make their own decisions. Any areas concerning taxes or specific legal or technical questions should be referred to lawyers, accountants, consultants, brokers, or other professionals licensed, qualified or authorized to render such advice.
In no event shall StockKid, and/or our agents be liable to any party for any direct, indirect, special, incidental, or consequential damages of any kind whatsoever arising out of the use of this website, our posts or any information contained herein. StockKid, and/or our agents specifically disclaim any guarantees, including, but not limited to, stated or implied potential profits, rates of return, or investment timelines discussed or referred to herein.

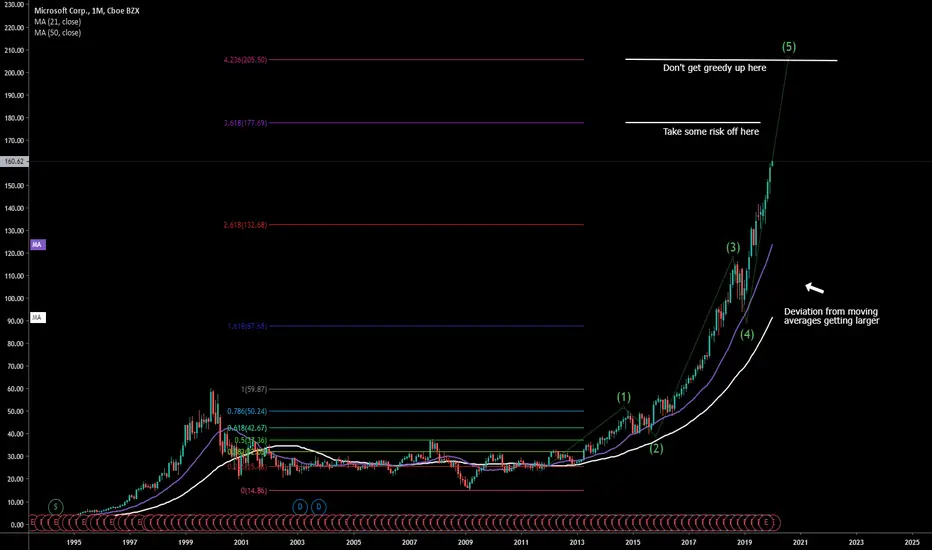
Microsoft Parabolic Pattern 1155% within 10 Year#Microsoft Parabolic Pattern:
I Also Became a big FAN of This #Parabolic Pattern
2009 to now 1135% up within 11 Year
March 2010 to till now #BTC 329499900% up
Wht You can expect from #Bitcoin in 11 Year?
My Prediction=< $2000000
Please like and follow for latest crypto charts and updates.
#DYOR
Not Financial Advice

CHINA INJECTS $174 BILLION OF LIQUIDITY ON FEBRUARY 3 - BUY!!!Like we've been posting, the China flu is nothing but a scare tactic by the FAKE NEWS!
With the State of the Union address coming within a few days, GOLD is down and the economy is BOOMING!
President Trump will not let the US Stock Market Crash so forget about it folks.
Short sellers will continue driving this market higher as they are forced to cover.
Earnings recently out tell a big story, the US economy is growing like a wild grape vine!
Get in now and ride the markets up to 50,000
If Amazon is added to the DOW stocks, you are looking at a stock market blowing past 30,000
Don't be on the side lines of the BOOMING Trump Economy!

CHINA INJECTS $174 BILLION OF LIQUIDITY FEBRUARY 3 - BUY!!!Like we've been posting, the China flu is nothing but a scare tactic by the FAKE NEWS!
With the State of the Union address coming within a few days, GOLD is down and the economy is BOOMING!
President Trump will not let the US Stock Market Crash so forget about it folks.
Short sellers will continue driving this market higher as they are forced to cover.
Earnings recently out tell a big story, the US economy is growing like a wild grape vine!
Get in now and ride the markets up to 50,000
If Amazon is added to the DOW, you are looking at a stock market blowing past 30,000
Don't be on the side lines of the BOOMING Trump Economy!

CHINA FLU IS FAKE NEWS! BUY THE MARKETS..READ WHY..!Folks, and our followers...
The Chinese flue is "FAKE NEWS" only meant to cast a shadow over the BOOMING USA Economy and scare the public around the world...!
The SICK Liberals and Dirty Democrats want the USA stock market and stock markets around the world to crash and the USA economy to sink! These people are SICK..!!!
The real statistics you need to know about before selling into this FAKE NEWS China Flu Scam ...
Each year, over 600,000 people die from the FLU...
In 2018 alone, over 80,000 people died from the FLU...
Did we see the market crash in 2018..? NO NO NO..!!!
As of this post, there are ONLY 8 CASES of the dirty China flue in the USA...The FAKE NEWS continues their SICK agenda to try and crash the USA Economy before the 2020 election...!!!
CDC Link...
www.cdc.gov
Public Companies are reporting ROBUST Revenues and Profits, the China Flue is a SCAM...!
BUY THE DIPS BECAUSE UNTIL WE SEE THE DEATH TOLL IN THE USA COME CLOSE, OR PASS 60,000 TO 80,000 DEATHS FROM THE CHINA FLUE, IT'S FAKE NEWS!!!
DO NOT LET THE FAKE NEWS SCARE YOU INTO SELLING.
BUY BUY BUY

CHINA VIRUS IS FAKE NEWS! READ THIS POST & BUY THE MARKET!!!Folks, and our followers...
The Chinese flue is "FAKE NEWS" only meant to cast a shadow over the BOOMING USA Economy and scare the public around the world...!
The SICK Liberals and Dirty Democrats want the USA stock market and stock markets around the world to crash and the USA economy to sink! These people are SICK..!!!
The real statistics you need to know about before selling into this FAKE NEWS China Flu Scam ...
Each year, over 600,000 people die from the FLU...
In 2018 alone, over 80,000 people died from the FLU...
Did we see the market crash in 2018..? NO NO NO..!!!
As of this post, there are ONLY 8 CASES of the dirty China flue in the USA...The FAKE NEWS continues their SICK agenda to try and crash the USA Economy before the 2020 election...!!!
CDC Link...
www.cdc.gov
Public Companies are reporting ROBUST Revenues and Profits, the China Flue is a SCAM...!
BUY THE DIPS BECAUSE UNTIL WE SEE THE DEATH TOLL IN THE USA COME CLOSE, OR PASS 60,000 TO 80,000 DEATHS FROM THE CHINA FLUE, IT'S FAKE NEWS!!!
DO NOT LET THE FAKE NEWS SCARE YOU INTO SELLING.
BUY BUY BUY

CHINA VIRUS IS FAKE NEWS! - READ WHY...BUY THE DIPSFolks, and our followers...
The Chinese flue is "FAKE NEWS" only meant to cast a shadow over the BOOMING USA Economy and scare the public around the world...!
The SICK Liberals and Dirty Democrats want the USA stock market and stock markets around the world to crash and the USA economy to sink! These people are SICK..!!!
The real statistics you need to know about before selling into this FAKE NEWS China Flu Scam ...
Each year, over 600,000 people die from the FLU...
In 2018 alone, over 80,000 people died from the FLU...
Did we see the market crash in 2018..? NO NO NO..!!!
As of this post, there are ONLY 8 CASES in the USA...The FAKE NEWS continues their SICK agenda to try and crash the USA Economy before the 2020 election...!!!
CDC Link...
www.cdc.gov
Public Companies are reporting ROBUST Revenues and Profits, the China Flue is a SCAM...!
BUY THE DIPS BECAUSE UNTIL WE SEE THE DEATH TOLL IN THE USA COME CLOSE, OR PASS 60,000 TO 80,000 DEATHS FROM THE CHINA FLUE, IT'S FAKE NEWS!!!
DO NOT LET THE FAKE NEWS SCARE YOU INTO SELLING.
BUY BUY BUY

Fixing The Supply Variable: DJI/IOTA plusAn updated version of stocks pegged to IOTA which has a fixed supply to eliminate the supply variable when trading. Supply is often changed by the federal reserve policy. Printing money, changing interest rates, etc... This makes it hard to asses the value of the stock market. By fixing supply with IOTA's limited supply pegged against the market. The only variables that must be considered are news and demand which makes analysis work much easier. It is also easier to trade as both IOTA and stocks are likely to appreciate against the inflating USD or other native currencies.

"Microsoft: Top and Bottom Analysis" by ThinkingAntsOk4H Chart Explanation:
- Price is on a Weekly Ascending Channel.
- Price is on a Micro Ascending Channel.
- Bearish CCI.
- If price breaks the Micro Ascending Channel, it has potential to move down towards the bottom of the Weekly Ascending Channel.
Weekly Vision:
Daily Vision:
Updates coming soon!

US stock market: growth out of control The Dow Jones Index is showing the longest period of growth in its history. Given that this growth is completely divorced from economic development, even the most avid bulls in the US stock market are beginning to doubt about prospects: the growth is clearly out of control.
There is another fact: when the market grows very rapidly in a very short period, it becomes extremely vulnerable to correction.
According to many analysts, a correction in the US stock market is inevitable and its minimum scale is 10% -20%.
Jack Ablin, chief investment officer at Cresset Capital, expects a 15% correction in early 2020.
The problem of the US stock market in terms of continuing the bull rally is the lack of drivers for such growth: the economic growth rate has long lagged behind the stock market growth rate, on the eve of the Presidential election, there are no serious economic reforms to be expected, companies are stopping their share buyback programs, and their financial results for the fourth quarter in a row show worse growth rates.
Perhaps the only chance for stock market growth is an active interest rate cut by the Fed. But the Central Bank made it quite clear that it is not going do that.
Recall, we consider 2019 the last year of unjustified growth in the US stock market. Already in 2020, it is going to adjust. The scale of correction is from 50% and higher. Given that in recent years, shares of technology companies in the US stock market have grown by an average of 7-8 times, the US stock market will no doubt become the object of massive sales. We recommend participating in this process, selling both the market as a whole (Nasdaq index) and the shares of individual issuers (Apple, Microsoft, Alphabet, Oracle, etc.).

WEAK INDICATORS - BE CAREFULIt's amazing how a stock looking bullish one day can turn negative the next day on no news.
The daily chart...
SNAP stock looks over bought. Accum/Dist & On Balance are trending down.
Stochastic looks over bought.
RSI looks like it's ready to peak.
A few indicators are still in an uptrend.
The Weekly Chart still looks to be in an uptrend.
We think the stock could go either way. BE CAREFUL
BEST OF LUCK & HAPPY NEW YEAR!

MSFT Cycle DeviationMSFT has an extreme deviation pattern for its business cycle. The Detrending Price Oscillator Indicator for cycle analysis shows an extreme speculative price mode is underway. Risk of profit-taking by Professional Traders is increasing as the stock continues to climb speculatively.

Apple & Microsoft: Worse Than the Dot Com BubbleThe charts speak for themselves. Parabolic curves are found on linear scales.
These look like bitcoin on December 17th, 2017. We know happened next.
What goes up must come down.
Either the top of these markets are beginning to form or we will have some massive pushes to finish off this 4000-day bull run.
We now have a competitor for this asset class: Cryptocurrencies
We know the institutional interest is beginning to arise for cryptos. Where will they get the money to invest? Maybe from the stock market that's intensely overbought?
Timing is key.
These markets are floating.
2020 is time for the shift.

MSFT goes parabolicMicrosoft is currently in a strong parabolic uptrend, If this momentum continues the long term price may reach massive ATH’s. With the development of new AI technology, could technology, and MSFT’s involvement in digital currency I think this is entirely possible by 2036.

ROKU | 37% Correction Coming SoonGood Morning Traders,
I'm switching it up a bit and covering Roku. We should be looking for entry toward $123.5 to $125.33 with a exit around $164. Roku is sitting at 339% profit in 348 days, which is incredible for a Fortune 500 company. Throughout the previous 3 weeks, we saw a correction pushing 22%; if we can hold the channel movement up is likely with a target of $164. Billionaire, Anthony Wood quit his career with Netflix to join Roku & quadruple his fortune in just a year; Pulling in $2.2 billion since January.
This read is sponsored by Dan Orr, a stock market legend.
As always do your own research, I am not providing financial advice nor am I financial advisor.
DotcomJack | EasyLootFund

ENJ 1H: Tokenize Me*This is not financial advice. Do your own research.*
In the matter of a few days, companies showing public interest in NFTs has grown wildly. Microsoft announced Azure Heroes, which actually uses the Enjin blockchain, Nike announced ERC-721 use for tokenizing their sneakers, Binance announced NFT collectibles for the holidays (using 1115, possibly Enjin in the interim until their planned move to BEP7), and a few less notable companies.
Microsoft caused the huge pump on this chart, but I'm inclined to believe that it's not over.
OBV is at ATH.
Above observations are self-explanatory. Good luck!

Microsoft broke the All-Time High !Hello, Traders!
Monfex is at your service and today we overview Microsoft .
Last Friday, the Pentagon selected Microsoft as the winner of its winner-takes-all cloud contract, which could be valued as high as $10B.
The Global 2000: The World’s Best Employers List consists of 500 companies.
In the second place - Microsoft !
A Flat top triangle pattern was broken and the price is over the resistance zone with a bullish formation and it's a good buy signal. Bulls dominance.
The target is 127% Fibonacci.
The target zone ~ $155
The local support zone ~ $142-142.5
The support zone ~ $136-137
Market Cap
1096.412B
Share your thoughts, ideas about the market under the chart.
Watch for our Updates to be the first who gets well-timed signals !
GOOD LUCK AND LOTS OF PROFITS !!
Disclaimer
This report is for information purposes only and should not be considered a solicitation to buy or sell any trading assets. Monfex accepts no responsibility for any consequences resulting from the use of this material. Any person acting on this trade idea does so entirely at their own risk.

MSFT Gann ProjectionsUse the low of 0.05812; use the high of 38.9382; project out from there and these critical levels present themselves
acknowledge the strength of these gann levels
manage your own risk
gl hf
xoxo
snoop

MSFT Long with ascending triangleMicrosoft has just broken above the resistance of the ascending triangle and now looks like it's going to erect!
Love it!

