#BTC Macro update - Bitcoin $BTC Weekly resistance at 11716 and we have weekly support at 10253.
A close below or above would be significant.
Plan, patience, execute!
Mid-term

KEG ROYALTIES INCOME FUNDKRIUF.OTC PINK, KEG-UN.TO
Keg Royalties Income Fund
Gap is the game Change on this stock
Keep this one on your watch list

NZD/JPY Short!! WowThis pair has just hit its mid/long-term downtrendline once again. So in the medium term I see a gain of 8000 pips going down. I am short !!

Mid-term outlook / idea for GBPUSD 🔌Today I'd like to share my GBPUSD trade idea with you.
We're seeing Dollar weakness as at end of July. I expect GBPUSD to continue it's rally to in and around the 1.30000 psychological level. I also expect price to react quite strongly at this level, to push to the downside.
Potential downside targets can be in and around the 1.24500 level (550 Pips). Some confluent factors to this target are the channel and potential liquidity lying under the bars / wicks formed early in July.
After the retracement to 1.24500 I'll look to go long targeting the pre-covid level of 1.32000 for a potential 750 Pip rally.
something I'll be looking at for confluences - stronger DXY in upcoming weeks, as well as a rise in the yield of 10-year Treasury Notes. So lower prices!
But all of this is just speculation - happy trading.


BTC/USD Bearish AnalysisMy analysis for today is essentially the same as yesterday and really the entire week. The price has been consistently setting lower highs which screams bearish to me. The arrows I've left on the chart are from yesterday's analysis. I figured the price would either immediately drop or rally up to 9.4k and bounce off the resistance and fall down 9.3k. My timing was a little off but for the most part that's exactly what happened. This is just to reiterate what I said yesterday: if the price can't break past 9.4k and stay, I don't expect to see any significant price increases.
Yesterday (6/20) ended with a green candle which could be a reversal signal, but we've just ended today (6/21) with a red candle with a larger body than yesterday's. So far today's candle (6/22) is starting off strong with a green candle with a very small lower shadow. This could mean that there isn't nearly as much selling pressure compared to the last few days, which could be good for bullish activity, but again, the price has to break through several levels of resistance. That being said, it doesn't look like there is significant resistance between 9.6k and ~9.75k. Breaking through 9.6k could result in a rally straight to 9.75k - 9.8k.
Overall I will continue to be bearish (short - mid term) until we start breaking through areas of historical (within the last 2 weeks) resistance. The more we bounce off these areas of resistance, the less likely the chances of the price having a significant upward spike. This also applies for spikes to lower price points, but as it stands we are having a lot more trouble driving the price up than down.

Bitcoin is dead! Or isn't it?Bears will always believe they have the upper hand untill 20k breaks. Well, we ain't there yet and there are some big resistances to break before we will get there.
First one being 10k of course!
And what do we know about a horizontal trendline that has been tested week after week, day after day again and again? (Please think about the oh so strong 6k horizontal support line back in 2018...)
Yes sir, you are absolutely right! It will break and it will break in magnificent fashion!
Have fun trading guys, keep it safe!

Crude oil mid-term trading outlookWTI crude oil prices rose significantly with a very modest rally in the last few sessions!!
on D chart, we can see that the price seems to form an inverse pattern of head and shoulders (Unusual) suggesting a possible continuation of the signal with a positive trend.
however, the move may be corrective because the price may form a continuation pattern or (Pullback) to the downside..!!
the potential targets are fibo50% and Fibo61.8%
Taking into account the previous AREA GAP DOWN. :=)
P.S.
Personally. I work only intraday:=)
Good Luck Folks.

BTC: Elliot Impulse Wave completed: Correction InboundHello All!
By taking a wider view point, we can see that BTC has cleanly completed a 5 point Impulse Wave up from COV-Crash lows, meaning that we can keep our eyes peeled for a corrective wave to Short on. Targets are taken to enter at Donchian break lows on 3H timeframe, or the risk-takers may try to add shorts at 7.5-7.7K range. SL target is the current recent 3H Donchian high but would advise implementing a trailing stop position for this, or some careful monitoring given the potential market volatility in this period.
TP has been placed along the downtrend created by the Corona-Corrective wave from December/Januarys bull run, which also neatly fits into a 50% Retracement of the Impulse Wave. Again, I would suggest a well-adjusted trailing stop and/or careful monitoring.
ATR has slowly settled down to pre-crash levels suggesting the capability for another major swing, and trendlines have been very well respected by BTC recently. Market news, especially from the U.S has been overwhelmingly negative recently and it may be time for another round of 'pricing in' said news.
Please Note: Major Trendlines on this chart are established using Line/Area graphs for clean price action and noise filtering. Heikin-Ashi has been used to publish the idea, but I find that focusing trendlines on crazy wicks isn't a good focus and that trading based on where the price was for 1 minute out of a 4-8H period can lead to very off targets.
All the best!

Bitcoin is making it self ready for the next bullish run.Btc is making it self ready for the next bullish run, the analysis is different from all other midterm bitcoin phases so I'm very curious how big this move will be. The new run will start in 3-10 days from now.

Crude Oil - low price, good mid-term investmentAs summer approaches, the strength of the covid-19 is likely to weaken as heat kills it. In addition, the price is too low and producer countries will eventually be forced to reduce barrel production.

XRP/USD going with the trend !Please check my video with the analysis.
I am looking for opening a long position with the trend.
If you like my video please like it and subscribe :)

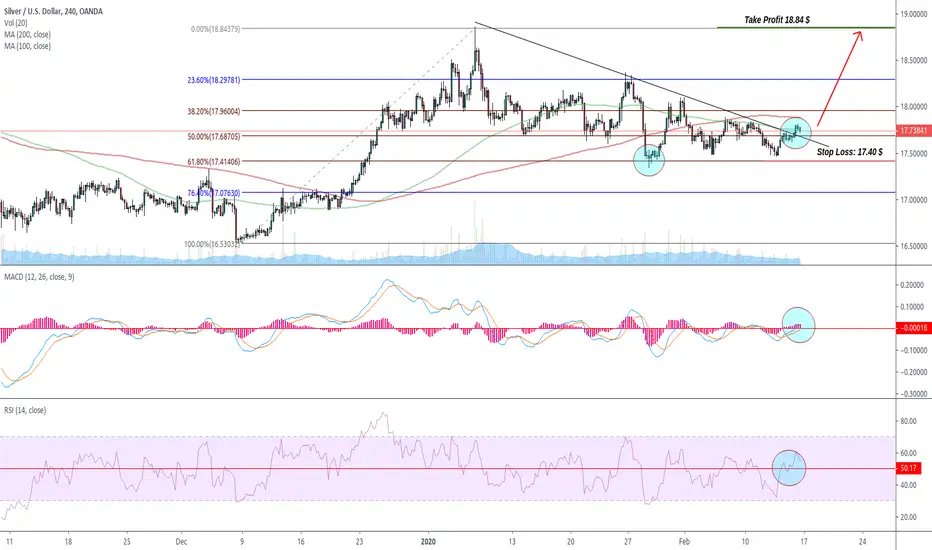
SIlver the most undervalued asset !The Setup:
The price has retested the 61.8% fib retracement level.
RSI is above 50
MACD crossed below and above the signal line
There is a trend line break of the triangle (flag correction pattern)
So we are ready to enter the trade at current market price with the following parameters:
Entry: 17.70 $
Stop Loss: 17.40 $
Profit Target: 18.84 $ (the previous swing high)
Good luck !
Updated Mid term View XAUUSD with 2013 Ghost overlayGold has from the Start of the year more or less floated between 1545 and 1590, the 2013 ghost went long to a short setup during this time, in reality gold just ranged straight through, this gives us an area to look at in the short term, I cannot see what can stop it now making its way through 1600, with only 1582in its sights. At 1611, gold may either retrace to 1582-1578 or progress further up to 1648, (1638 is resistance also), from 1648 to follow the 2013 trend a pull back to again 1582 looks on the cards but may push further to 1550 before pushing north again

Btc: Does bulls really have won?After seeing a rise in the price of 1600$ (23%) in 6 days, can we simply assume that Bulls wons and that we only long from here?
Well not exactly, it's the 4th time that we get massively rejected on the top of the trend line , this means that bulls are far from winning at the current moment, in fact now bears could get an advantage.. Why?
- Over 300$ rejection after hitting the top;
- Oversold on Rsi ;
- Really big sell pressure;
- Top of the Ichimoku Cloud working has a Resistance;
- Didn't manage to break MA200 yet;
So does this means we are going down then?
Well that's the hard part to anwser, we got last night a re-test on the 7 760 - 7 850 if bulls manage to hold over the day, we can still have hope of a break before the end of january.
If not, then 7 270 - 7 460 will be next area to be re-tested and probably quickly too.
But there are still good news, if we zoom in a little we can see that we broke an important triangle, this means that a re-test at 7 760 - 7 850 is normal and from here a re-test of 8 500 would make sense.
How to play in this situation?
My personal bias currently is bullish , mainly because of my 1W chart (Will show it below) Bitcoin has been on a bullish rise since the beginning and if we look closer bottom should be in at 7 100.
Currently bottom is around 7 270 so i will put longs orders ladder down to there!
Here's my current orders:
Long: 7 270 - 7 330 - 7 480 - 7 550 - 7 760 - 7 850 (Took profits at 8 100 on my 7 950 order)
Sl: 6 950
Short: 8 560 (This one is risky so don't put to much if you try it)
Sl: 8 670
When i ladder i don't use more than x5 - x15 leverage.
So there we go, right now i'm waiting to get a long entry at 7 760 - 7 750 let's get it!!!
If you have questions feel free to ask, or click on the link below you'll be re-directed to my groups.

AUD/USD MondayAUD/USD 1hr
I think it is two way to up.
If AUD is stronger from last week.
We can update for 3 days next.

GBP/AUD MID-TERM********** HAPPY NEW YEAR *************
This chart is set in 1Hr and entry is at 1.89197 the target is 6000 point (1.95197).
You can leave the process at any point numbers.
If the market is happy maybe target touch after 3 days.
Please see my other ideas and results.
What do you think about this?


MFT-BTC Get more than 10% profitHigh growth ability simply.
BUY: 13-14
SELL:
TARGET 1 : 16 = 12%
TARGET 2 : 18 = 22%
TARGET 3 : 19 = 35%
STOPLOSS: 11

ORBEX: Correction Could Take Prices Lower Before Bullish "Three"The correction seeing on USDJPY could let prices fall a tad lower, providing a better structure for minor A.
This should be followed by a "three" correction, where minor B is going to offer some buying opportunities in the short-term before sliding lower towards the golden Fibonacci retracement level of 106.67.
Better remain patient for minor B to complete!
Trade safe
Stavros Tousios
Head of Investment Research
Orbex
This analysis is provided as general market commentary and does not constitute investment advice


Gold/USD DailyGOLD/USD
I think Gold change in the next week by fundamental but for now, it is the best option.
It all comes down to how traders respond to the retracement zone at $1512.40 to $1526.40.
Holding inside the zone will indicate a neutral to upside bias.
Overtaking and sustaining a rally over the upper or Fibonacci level at $1526.40 will signal the buying is getting stronger, while a sustained move under the lower or 50% level at $1512.40 will indicate the presence of sellers.
This could trigger the start of a steep break.

BTC/USD Bullish Short Term & Bearish Mid term Outlook...Hi guys,
I have plotted a fib retracement from around the 17th November (high) to 18th December (low) and you can clearly see some vital rejections, support levels and wickfishing i.e. bull traps or bear traps - with the long wicks... with daily candle closures failing to close above or below the fib levels.
Currently, BTC on the daily is looking like it has broken the .618 level @ 7273.08 USD and is making its way towards the next fib level at .5 @ 7533 USD, which is also at a key resistance and support level (long term key levels which are highlighted by yellow shaded boxes), so this is one confluence for a short term bullish outlook.
The next confluence is that we have not even seen a single retest of the 8000 USD region since we have fallen below and in the long term... every time we have gone below or above this region we have always retested it, therefore it is a key level.
This brings us to our next confluence which is the completion of the head and shoulders at this region - with the left shoulder starting from 25TH NOV, which lines up exactly with the FIB RETRACEMENT .0.236 @ 8116 USD
Next confluence is the higher highs and higher lows shown by the white trendline drawn across 25 Nov to 3rd Jan... Although we broke this trendline 16th-18th December price has come back up strongly to retest and maintain this trendline, and the opening of this daily looks like a strong and solid bounce off the trendline.
After this short term region of around 8100-7700 USD is met... price should bounce off the bearish channel drawn on the long term outlook with the two red trendlines and we could be seeing levels as low around 6000-4000 USD before price will continue to surge again and hopefully act as the next starting point for the next 2020 bull run which could be initiated by the long term green trendline bounce...
Thanks
