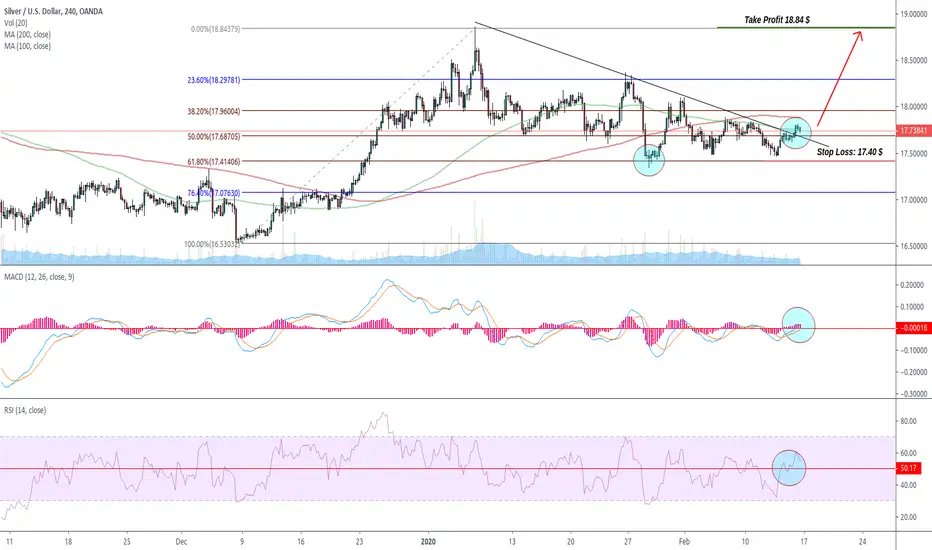
SIlver the most undervalued asset !The Setup:
The price has retested the 61.8% fib retracement level.
RSI is above 50
MACD crossed below and above the signal line
There is a trend line break of the triangle (flag correction pattern)
So we are ready to enter the trade at current market price with the following parameters:
Entry: 17.70 $
Stop Loss: 17.40 $
Profit Target: 18.84 $ (the previous swing high)
Good luck !
MID
Updated Mid term View XAUUSD with 2013 Ghost overlayGold has from the Start of the year more or less floated between 1545 and 1590, the 2013 ghost went long to a short setup during this time, in reality gold just ranged straight through, this gives us an area to look at in the short term, I cannot see what can stop it now making its way through 1600, with only 1582in its sights. At 1611, gold may either retrace to 1582-1578 or progress further up to 1648, (1638 is resistance also), from 1648 to follow the 2013 trend a pull back to again 1582 looks on the cards but may push further to 1550 before pushing north again

Btc: Does bulls really have won?After seeing a rise in the price of 1600$ (23%) in 6 days, can we simply assume that Bulls wons and that we only long from here?
Well not exactly, it's the 4th time that we get massively rejected on the top of the trend line , this means that bulls are far from winning at the current moment, in fact now bears could get an advantage.. Why?
- Over 300$ rejection after hitting the top;
- Oversold on Rsi ;
- Really big sell pressure;
- Top of the Ichimoku Cloud working has a Resistance;
- Didn't manage to break MA200 yet;
So does this means we are going down then?
Well that's the hard part to anwser, we got last night a re-test on the 7 760 - 7 850 if bulls manage to hold over the day, we can still have hope of a break before the end of january.
If not, then 7 270 - 7 460 will be next area to be re-tested and probably quickly too.
But there are still good news, if we zoom in a little we can see that we broke an important triangle, this means that a re-test at 7 760 - 7 850 is normal and from here a re-test of 8 500 would make sense.
How to play in this situation?
My personal bias currently is bullish , mainly because of my 1W chart (Will show it below) Bitcoin has been on a bullish rise since the beginning and if we look closer bottom should be in at 7 100.
Currently bottom is around 7 270 so i will put longs orders ladder down to there!
Here's my current orders:
Long: 7 270 - 7 330 - 7 480 - 7 550 - 7 760 - 7 850 (Took profits at 8 100 on my 7 950 order)
Sl: 6 950
Short: 8 560 (This one is risky so don't put to much if you try it)
Sl: 8 670
When i ladder i don't use more than x5 - x15 leverage.
So there we go, right now i'm waiting to get a long entry at 7 760 - 7 750 let's get it!!!
If you have questions feel free to ask, or click on the link below you'll be re-directed to my groups.

AUD/USD MondayAUD/USD 1hr
I think it is two way to up.
If AUD is stronger from last week.
We can update for 3 days next.

GBP/AUD MID-TERM********** HAPPY NEW YEAR *************
This chart is set in 1Hr and entry is at 1.89197 the target is 6000 point (1.95197).
You can leave the process at any point numbers.
If the market is happy maybe target touch after 3 days.
Please see my other ideas and results.
What do you think about this?


MFT-BTC Get more than 10% profitHigh growth ability simply.
BUY: 13-14
SELL:
TARGET 1 : 16 = 12%
TARGET 2 : 18 = 22%
TARGET 3 : 19 = 35%
STOPLOSS: 11

ORBEX: Correction Could Take Prices Lower Before Bullish "Three"The correction seeing on USDJPY could let prices fall a tad lower, providing a better structure for minor A.
This should be followed by a "three" correction, where minor B is going to offer some buying opportunities in the short-term before sliding lower towards the golden Fibonacci retracement level of 106.67.
Better remain patient for minor B to complete!
Trade safe
Stavros Tousios
Head of Investment Research
Orbex
This analysis is provided as general market commentary and does not constitute investment advice


Gold/USD DailyGOLD/USD
I think Gold change in the next week by fundamental but for now, it is the best option.
It all comes down to how traders respond to the retracement zone at $1512.40 to $1526.40.
Holding inside the zone will indicate a neutral to upside bias.
Overtaking and sustaining a rally over the upper or Fibonacci level at $1526.40 will signal the buying is getting stronger, while a sustained move under the lower or 50% level at $1512.40 will indicate the presence of sellers.
This could trigger the start of a steep break.

BTC/USD Bullish Short Term & Bearish Mid term Outlook...Hi guys,
I have plotted a fib retracement from around the 17th November (high) to 18th December (low) and you can clearly see some vital rejections, support levels and wickfishing i.e. bull traps or bear traps - with the long wicks... with daily candle closures failing to close above or below the fib levels.
Currently, BTC on the daily is looking like it has broken the .618 level @ 7273.08 USD and is making its way towards the next fib level at .5 @ 7533 USD, which is also at a key resistance and support level (long term key levels which are highlighted by yellow shaded boxes), so this is one confluence for a short term bullish outlook.
The next confluence is that we have not even seen a single retest of the 8000 USD region since we have fallen below and in the long term... every time we have gone below or above this region we have always retested it, therefore it is a key level.
This brings us to our next confluence which is the completion of the head and shoulders at this region - with the left shoulder starting from 25TH NOV, which lines up exactly with the FIB RETRACEMENT .0.236 @ 8116 USD
Next confluence is the higher highs and higher lows shown by the white trendline drawn across 25 Nov to 3rd Jan... Although we broke this trendline 16th-18th December price has come back up strongly to retest and maintain this trendline, and the opening of this daily looks like a strong and solid bounce off the trendline.
After this short term region of around 8100-7700 USD is met... price should bounce off the bearish channel drawn on the long term outlook with the two red trendlines and we could be seeing levels as low around 6000-4000 USD before price will continue to surge again and hopefully act as the next starting point for the next 2020 bull run which could be initiated by the long term green trendline bounce...
Thanks


Triangular ETHHello to investors,
As we can see in this analysis , ETH can repeat the yellow small rectangle area again,
Of course i killed myself to fit the smaller pattern for making it bigger ,But still it's nice to see that.
In this months longers are celebrating & sellers are crying .... as usual
Don't forget that ,Market knows when it should shake out the weak investors ...

#EURUSD midterm technical sell#EURUSD midterm strong sell
there are some channels , some trend lines and resistance and a high level divergence on 15m chart on MACD
Sell @ 1.10885
SL 1.11085
TP1 1.10300
TP2 1.10150
Use 10% Money Management
BY : Mohammad Reza Ebrahimi Moghaddam
#B_W_I_X
#FOREX #IRAN


XAUUSD, 4h, Short-Term & Mid-Term analysisNow gold it's indecision,
Short-Term (Bullish)
if gold could break support 1466 there is possibility could test the next support in 1453
if bull in power than the market would be tested to strong resistance at 1478
Mid-term (Bearish)
1478 it's a very good position to taking short
my short target it's 1440 or possible to reach fibonacci target 1417
This could happen if trade war US-China phase one, it's done
Comment below if you have other opinion
Like it if you Like it

TD Sequential on Weekly Chart BTCAccording to TD Sequential Indicator a weekly 9 bearish is a good opportunity to long BTC in mid-term. Targets may vary depending on your time-frame.

scbtc longterm and midterm investment Analysishello our friends, we are giving this Analysis for swing traders and tell them a little bit about this coin.
so let's go (read till end and please follow us to give Energy to our team):
sc is a part of SIA project, Sia is a cloud storage platform like Google Drive and Dropbox.
Unlike many other coins or crypto projects, Sia didn’t start with an ICO or pre-mining. Still, to date, Nebulous Inc. has raised $1.25M in total funding. Prominent investors include Procyon Ventures, Raptor Group, Fenbushi Capital, and angel investors like Xiaolai Li.
The long-term goal of Sia is to compete with cloud storage platforms like Dropbox, Google Drive, and OneDrive. In the blockchain space, Sia’s direct competitors are Storj and MaidSafe, but Sia claims to be better with encryption and decentralization.
The developer’s community is confident that they are making a highly competent product and they don’t believe in mass marketing campaigns for promotion.
nowadays this altcoin, like other altcoins had a dump, however base on our analysis that we are going to share them with you, this altcoin have a really good potential and also for Long term invest, volatility of this coin is higher than it trades now.
In the daily TF, we can see that downtrend have been ended and it is growing in moment that lots of altcoin's cause of dumping in BTC are getting down, however its possible that upward trend slow down but its completely obvious that its in upward trend.
Indicators like Ichimoku gives us really good sign, however in Macd we can see that push up energy is already finished.
RSI confirm Macd to and shows us that have been over bought(sell signal).
But remember that for long term investments, momentum indicators are not the most important's.
ATR: this indicator is in 0.0000003 pip, so for mid term swingers we would suggest 0.0000009 pip SL down of their bought price and for long term swings better to put SL under lower Sup. line.
Volume: volume is showing us a really big move from Bulls, however and have not closed yet.
overall: For swing traders who wants to invest longterm, its really good alt coin for investing in this price and for midterm swingers, we would like to say that this coin is trading between res. and sup. lines , the downward is in check lists however its not going to be for much time and our Analysis team are agreed that this coin is going up in midterm.
caution: this Analysis is not for day traders and short term swings.
References: Fundamental parts have been written from Coinsutra.com
REMEMBER our motto, Acquirement the knowledge of this business, then design and Manner the strategy that works for you and Repeat it to be better trader.(AMRTrade)
Good luck

BITCOIN - Bearish Mid-Term Scenario & Important LevelsThis is a bearish mid-term scenario for the next months.
The overall trend is downwards. The Buy Zones are located at the most important levels.
We will possibly meet our long-term trendline at 4500.00 and bounce from there.
Leave a thumbs up if you like my idea and let me know what you think!
This will keep me motivated :-)
Disclaimer:
Any opinions, chats, messages, news, research, analyses, prices, or other information contained in this Idea are provided as general market information for educational and entertainment purposes only


One last chance to get Bitcoin cheap!Hello hodlers,
hello traders,
i want to share my opinion with you. I have to say first, iám really hope this plays out, but there is NO Guarantee that we will see this drop in the "buy zone" (white circle).
Why i think we will see a last drop before taking off from these levels forever:
- since the bottom @ dec´18 we see a massive rally ( much more than 100% )
- people are very greedy at this moment ( alternative.me )
- it would be healthy
- i want to buy more ( yes, this point is not objective at all :-D )
Please tell me what you think about the drop and in which range we will see it, if it happened anyway.
Note:
It is also possible, that we will see 10k first and after that we see a drop.
Bitcoin in the past was good for a 30-40% drop at any state, so there will be a better buy opportunity in future as in this moment ( just my opinion )

EURNZD Important Resistance All Discussed in the Chart
waiting for the Daily Closing and price action from here !
