The Best Odds within a Consolidated MarketEvery pattern of the market has precise areas where the probabilities can play in the most favorable way for you, if you trust the pattern (until it expires). Of course, we trust patterns... that's what we do: we drink and trust patterns .
This example on the XRPUSDT pair is a good example of this. As a day trader (or a FTT trader), your hope here would be to catch a meaningful impulse, a long movement of the price that could give you profits. If you want that, where would you place your entry?
The basic knowledge tells about "zones", but all zones are not equally safe and important in every pattern.
For example, we know that the average zone in a consolidated market (the midrange between its resistance and support) is important... but is it safe? Let's think about it:
By definition, an established market that goes sideways is bouncing between its resistance and support zones. It also tends to bounce against the midrange, of course (or, at least, it tends to struggle in that place); but normally you would expect the price to break the middle of the channel in order to reach its margins. Why? Because that's the very nature of the pattern! Duh!
If the price surpass the midrange, the pattern stays vigorous, healthy and reliable. But what happens if the price exceeds markedly the channel's resistance or support? That would be an apparent or definitive breakout of such pattern... its closure: There's no trustable pattern anymore and you must be careful because your previous analysis now belongs to the past.
This reflection is meant to warn you about one of the common mistakes we commit –perhaps because of the nature (a fault?) of our system or because of our unwise decisions–: Not waiting for the price to come up to the best spot for our entry. Not being selective enough when deciding the best settings of the market.
In my series about trading psychology I expect to delve more into this attitude of not caring too much about our best chances, which is a way of not protecting our capital –although there is also a problem in caring too much , to the point of inertia–. But, for now, let's just reflect about the significant disadvantage of placing our bets into forecasts that objectively lack the best odds within a known pattern! Surely those are not the most educated bets we are capable of... and a profitable trader is person who makes educated bets.
Midrange

Interesting trendline and midrangeJust noticed this interesting trendline going back to 2016 that's holding strong, coinciding with a retest of a midrange going back to 2015.
Looks primed to head to the top of the range. From there we'll see if it begins a new range above this one.

USDJPY LongThe DXY looks like it is trying to bottom near 101.5 support. Today was the first bullish day on the Daily.
USDJPY is on it's 2nd Daily bullish candle and looks to be reversing.
1. I'd like to see a pullback on Tuesday to Midrange and for price to find support there. If so, I'll look to get long at Midrange near 130, with stops at 129.60.
2. I'd like to see price move about Monday's High and hold 130.90. If so, Take the long and assess price action for stops.
Notes - Scale in
Be Patient - Expect one to two days of sideways price action this week.
Hold for Target/Projection level - TP1 - 132.74

OGNUSDTHELLO Traders
I hope you start a good trading week.
On the chart, we see a formed side range between 0.32~0.18 , which has been active for more than a month.
If the Bitcoin price remains in the current stable position and does not lose its value in the following hours, we can expect a rise in the price of OGN from its current price 0.322 to 0.470 in the next week .
However, if the bitcoin loses its value again, the price will go down to the support area that is 0.238 ~ 0.200which can be a good opportunity for mid-term investment. See the image below for more details.
If you like this post or have any comments, leave a comment for me here and share it with your friends.

Rising Wedge pattern updateI am reposting this idea as I have updated and placed a mid-range resistance for the wedge .
$BTC idea :
Another idea for BTC could be that we are created a pattern of a rising wedge on the weekly TF . Rising wedges usually breakdown to the downside .
Moreover , if it plays out like this we could be having another bounce retesting the previous ATH and then breakdown .
But as mentioned before market is variable and changes .
So we could just be falling from here further to the downside without going higher .
Which in my opinion , I would be expecting another pump before finally crashing the market , as whales could be looking for more liquidity or placing more shorts .
Apr 6
As we got rejected on the mid-range I believe that we could be revisiting the bottom of the rising wedge .

BTC: targeting 69.5k as a TP.If 59k was a key level and 64.5k was the midrange, i’m looking at 69.5k as a possible first stop. 70k is also a psychological level.
We could even get a 66.5/67 > retrace to 64.5k midrange > blast off to 69.5k. This is inside the realm of possibilities.
Good luck!

Trading idea for NEOUSDTNeo may revisit its previous resistance levels once it completes its retest and gets its reaction after correction.

Trading idea for BATUSDTIf all goes well, BAT may complete its flag formation and goes up to its target in midrange.


Trading idea for BTCUSDTThe price may have a movement between resistance areas, or it may break the minor downtrend and make a new ATH. We will see in time.

Trading idea for LINKUSDTIt is still in the downtrend. LINK needs to break minor downtrend and keep it over that in order to reach its previous resistance levels. If not, it can move between the downtrend lines.

Trading idea for ATOMUSDTIf ATOM breaks the channel and ongoing downtrend, it may revisit its previous resistance levels.

Trading idea for THETAUSDTTHETA has made a nice correction. IF it breaks its current downtrend, it can reach its ATH level again in midrange.

Trading idea for LTCUSDTLTC has broken down its previous downtrends, our scalping targets had already hit TPs. This time LTC may hit its current resistance level and try to break its current resistance levels.

Trading idea for EOSUSDTThis is a mid to long term trade. If EOS keeps breaking its oncoming resistance levels, it can reach up to even higher resistance levels as shown.

Trading idea for QTUMUSDT This is a mid-term trading idea. QTUM seems to keep going up to its ATH resistance level. I hope it will break its oncoming resistances one by one.


Trading idea for ATOMUSDTIf ATOM breaks its current downtrend, it may reach its previous ATH resistance level soon.

Scalping idea for AVAXUSDTIf it breaks red triangle, it may revisit its previous resistance levels. AVAX has the potential.

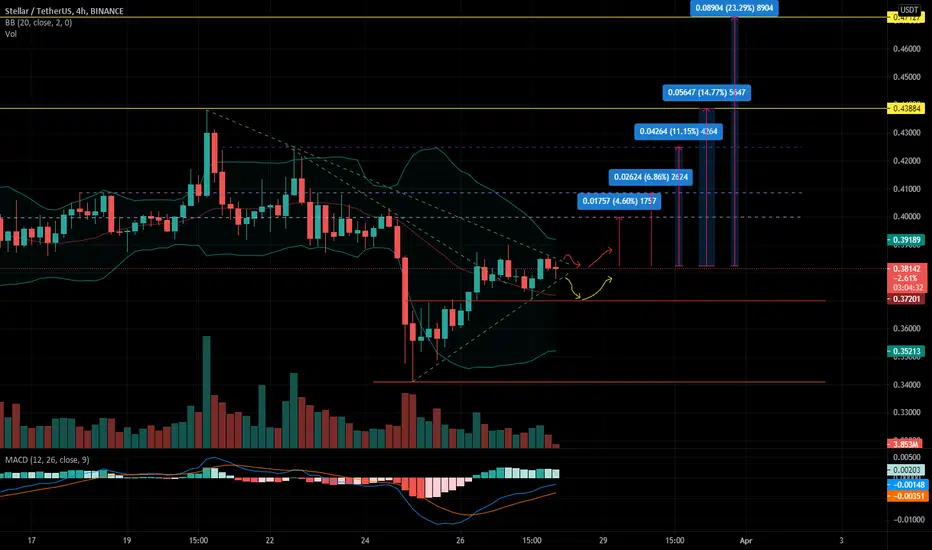
Trading idea for XLMUSDTIf XLM has enough buyers and breaks the downtrend, it will revisit its resistance levels in the midrange. However, the price moving is mostly horizontal. XLM needs some good news to pump up.
Long FISUSDTI have missed entry from $2.8, but it still has the potential to go its top resistance level.

Long SRMUSDTThis may be a midrange trade. If SRM breaks the downtrend of its triangle, it may revisit its previous resistance levels.

