#BTCUSDT will go to 30K in mid termThis is just an idea ! Do not panic. It may be true, it may not be true.
Bitcoin can see 30K again and then move towards high targets like 100K.
In my opinion, it is not possible to achieve stable high prices without seeing low prices again.
Note : 28K-30K is the most important support zone.
Midterm

Time to sell GoldThe position of Gold is currently below the Weekly and 1 hour Supply Zone, and the projections will start to decline.

Potential BTC move This is TA based on the WaveTrend with Crosses by James_Bl
The numbers indicate a long signal with said indicator. During this bullish push by BTC, it has moved by 16% or more when three of these occur in close succession (measuring from the bottom of the 1 candle, to the next “1” bottom)
If we potentially see a 3rd candle play out, the trend could continue up another 16% or more, which would have btc testing previous highs this year.
This could easily be invalidated with a move downwards, obviously. DYOR and good luck everyone

CAD/JPY Bullish W Pattern Running!Hello Traders
CAD/JPY has broken bearish trendline and successfully consolidated above it.
Also as we can see price is moving inside of a big channel.
Right now we have a big support around 87.4 (Big channel mid + W pattern + Fib 0.618 + previous resistance).
A minor correction to around 87.4 and then continuing upward momentum is probable.
Thanks for Reading


HUYA (1W) - Midterm Plan Hi Traders,
Below is my Idea about this very good loking company .... from CHINA !!
Compared to competitors (like Twitch) is discountedm same like DOYU. WHich are both owned by TENCENT as one of biggest investors.
After some FUD price from chinese government the price is Dummping.
In my Opinion, we are approaching end of impulsive wave DWON. you can also see touch with downtrend line + RSI COnvergence + MACD Convergence. Which are very bullish signs for me.
ALso fundamentally, this could be very good investment. But lets see. My plan is to take around 75-100% and sell everythin from actual price around 8.40 USD.
Trade safe. Enjoy the ride.

Not bad for the midtermpay attention ... midterm
hiihiihiihiihihiihiihiihiihiihiihiihiihiihiihiihiihiihiihiihiihiihiihiihi
hiihiihiihiihiihiihiihiihiihiihi

@GBPUSD not enough strength looks like the price is heading to 1.36; still thinking about the SL;
not enough strength to stay above 1.4; it can go also to 1.3?

@platinum; long term buyI believe that this is a very good buying opportunity for midterm/long term traders

@usdzar: not that bad datathe data was bad, but not that bad;
maybe it was a emotional reaction;
we saw this scenario a week ago, when the dollar was weak on Friday but Monday got back on track;
dogeusdt is ready for long posWe will wait for the third encounter with the trend line and pick up the remaining orders and then climb

#Zrx / #Usdt #Spot #Midterm
Entry Zone : 1.1170 / 0.9860
Target :
01 : 1.25(Scalp)
02 : 1.45
03 : 1.685
04 : 2.32
Buy 02 : 0.7979
Buy 03 : 0.5467
Buy 04 : 0.3841
Don't risk more then 3% of capital.

#Link / #Usdt#Link / #USDT 4hr
Only purchase/long if link closes a 4hr above the Green line! not before!

#Eos / #Btc #Spot #Midterm
Entry Zone :0.00010130 / 0.00009502
Target :
01 : 0.000124
02 : 0.000139
03 : 0.000155
04 : 0.000175
05 :0.000214
Buy 02 : 0.00008230
Buy 03 : 0.00006760
Don't risk more then 3% of capital.

#Dodo / #Usdt Entry : 1.96 / 1.68
#Spot #midterm
Tp : 3.40
Tp 02 : 4.7
Tp 03 : 5.4
Buy 02 : 1.26
Buy 03 : 0.87
Don't risk more then 3% of capital.

#LRC / #Usdt#LRC / #Usdt
#Spot ( #midterm )
Entry : 0.35064 / 0.32453
Target :
🎯0.42112
🎯🎯0.60906
🎯🎯🎯0.77091
Buy :
🐊🐊02 : 0.24622
🐊🐊🐊03 : 0.20968
🐊🐊🐊🐊04 : 0.13659

TLMUSD switch trade ideaWe can clearly see a very strong uptrend yet. So we can try a good trade with excellent Profit / Lose coef .


Komodo is about to bite a bear!Komodo is about to bite a bear!
Its a mid term trade
the chance is high but we might have some correction first so you can wait a lil bit or buy steps!
the zones I draw for you is where you can save gains or move sl under it !

BTCUSDT LONG#BTCUSDT Update:
$BTCcurrently trading at $44755
And $47181is the next resistance.
But I think there's a correction and the price will be 43823$ at the end of the day.
So what now..?
BTC will be in a range between (45000_44000) If BTC could pass$ 45000 then we can see a pump in the chart again...(47181$)
Support is $43823_42341
But If BTC breaks the $42341 support level then BTC is entered in a bearish zone and My Target will be $40680.
Hope this will not happen.
My Levels:
Support:- $42256/$43823
Resistance:
/$47181/$47181
I guess,
BTC needs to get a rest in 43823 in the next few days. (Be careful)
Must follow me for the latest crypto real-time updates.
Goodluck (:

BTCUSDT LONG#BTCUSDT Update:
$BTCcurrently trading at $43155
And $43823is the next resistance.
But I think there's a correction and the price will be 42256_40608$ at the end of the day.
So what now..?
BTC will be in a range between (43823_40608) If BTC could pass$ 43823 then we can see a pump in the chart again...(47141$)
Support is $42256_40680
But If BTC breaks the $40680 support level then BTC is entered in a bearish zone and My Target will be $36081.
Hope this will not happen.
My Levels:
Support:- $42256/$40680
Resistance:
/$47181/$43823
I guess,
BTC needs to get a rest in 42256in the next few days. (Be careful)
Must follow me for the latest crypto real-time updates.
Goodluck (:

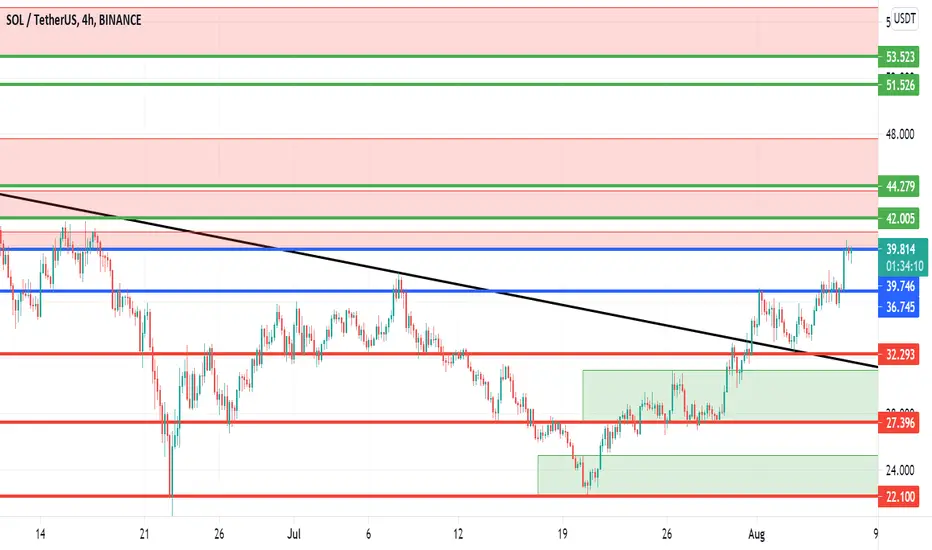
SOL/USDT on an uptrend As per my previous idea, SOL/USDT made a breakout from the downtrend since May and showing a bullish uptrend move.
Entry zone - NOW
Target 1 - $42.005
Target 2 - $44.279
Target 3 - $51.526
Target 4 - $53.523
This is not financial advice. Please DYOR. Place stop loss below $32.293 (Short term), or $27.396 or $22.10
I'm hodling for long term and buying more at every support order block becase this is one of the best performing coin of 2021 with great use case and strong team