MINA/USDT – Major Downtrend Breakout! Early Signs of Reversal?📈 Full Technical Analysis – MINA/USDT (1D Timeframe)
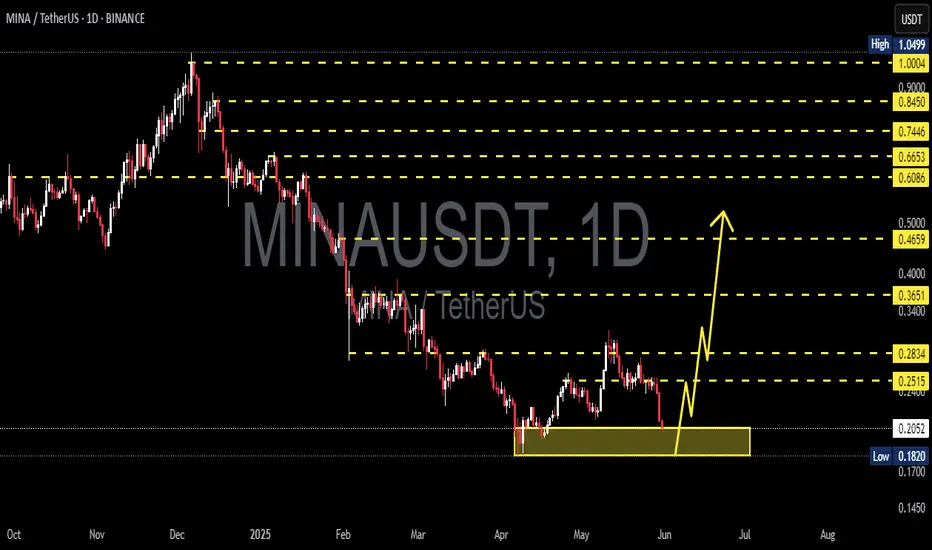
After enduring a prolonged downtrend since late 2024, MINA is now showing strong technical signs of a potential trend reversal. A decisive breakout above the long-term descending trendline suggests that bullish momentum may be gaining traction.
🟨 Consolidation Phase & Strong Breakout
Price was previously stuck in an accumulation zone between $0.18 and $0.21 for several weeks.
The breakout occurred right after a successful retest of this key support zone, confirming it as a new demand area.
The structure also validates the formation of a descending broadening wedge, a bullish pattern that often signals exhaustion of selling pressure and the start of a new uptrend.
🟢 Bullish Scenario
If bullish momentum continues, here are the next key resistance levels to watch:
1. $0.2984 – Minor resistance and a psychological barrier.
2. $0.3686 – Previous swing high.
3. $0.4511 – Primary technical target based on the wedge height.
4. $0.6562 and $0.8425 – Potential mid-term targets if momentum accelerates.
✅ A daily candle closing above $0.25 with strong volume would further confirm the bullish case.
🔴 Bearish Scenario (Risk Case)
Despite the breakout, a failed continuation could still trigger a bearish move:
If price falls back below $0.21 and fails to hold the newly established support zone ($0.18–$0.21), this would suggest a false breakout.
A drop below $0.18 may retest the recent low at $0.1459, bringing back bearish sentiment.
⚠️ Watch closely for volume confirmation and rejection signs to avoid a potential bull trap.
🔍 Pattern in Play:
Descending Broadening Wedge ➜ Typically signals a bullish reversal after a downtrend.
Breakout + Successful Retest ➜ One of the strongest technical signals, indicating that previous resistance has turned into support.
🧠 Market Sentiment & Strategy:
Current Sentiment: Moderately Bullish
For short-term traders: Entries on pullbacks near $0.21–$0.22 with targets at $0.298–$0.368.
For swing traders: Hold positions while price remains above the breakout zone; aim for $0.45 or higher.
🔖 Conclusion:
MINA has delivered a powerful breakout from a long-standing downtrend, supported by a successful retest and a solid bullish structure. As long as the breakout holds, there's strong potential for a trend reversal and mid-term upside continuation. However, discipline and risk management remain essential in this volatile crypto environment.
#MINA #MINAUSDT #CryptoBreakout #TrendReversal #TechnicalAnalysis #Altcoins #WedgePattern #BullishBreakout #SwingTrade #CryptoSignals #PriceAction
MINAUSDT

MINAUSDT: The Ground is ShiftingIn markets filled with noise, clarity comes from listening to the chart's subtle whispers. For MINA, those whispers are growing louder.
Let's look at the evidence. The Orderflow is no longer a one-way street; we are seeing signs of strength returning. At the same time, Volume is starting to build. This isn't a spike of panic or euphoria, but the steady hum of accumulation—a sign of quiet confidence.
When the ground begins to shift, a good trader doesn't jump blindly. They have a plan.
The blue boxes on the chart highlight two logical areas of interest for potential longs.
The upper blue box is the first zone of potential support, an area where buyers may show their hand soon.
The lower blue box represents a deeper foundation of value. An entry here would require more patience but could be built on stronger ground.
The idea is simple: have a plan, watch for the price to enter these areas of interest, and act with discipline. A plan without a pre-defined exit for when you're wrong is just a wish. The goal isn't just profit; it's the peace of mind that comes from trading with a clear map.
The chart is telling a story of a potential turn. Are you prepared to listen?
📌I keep my charts clean and simple because I believe clarity leads to better decisions.
📌My approach is built on years of experience and a solid track record. I don’t claim to know it all but I’m confident in my ability to spot high-probability setups.
📌If you would like to learn how to use the heatmap, cumulative volume delta and volume footprint techniques that I use below to determine very accurate demand regions, you can send me a private message. I help anyone who wants it completely free of charge.
🔑I have a long list of my proven technique below:
🎯 ZENUSDT.P: Patience & Profitability | %230 Reaction from the Sniper Entry
🐶 DOGEUSDT.P: Next Move
🎨 RENDERUSDT.P: Opportunity of the Month
💎 ETHUSDT.P: Where to Retrace
🟢 BNBUSDT.P: Potential Surge
📊 BTC Dominance: Reaction Zone
🌊 WAVESUSDT.P: Demand Zone Potential
🟣 UNIUSDT.P: Long-Term Trade
🔵 XRPUSDT.P: Entry Zones
🔗 LINKUSDT.P: Follow The River
📈 BTCUSDT.P: Two Key Demand Zones
🟩 POLUSDT: Bullish Momentum
🌟 PENDLEUSDT.P: Where Opportunity Meets Precision
🔥 BTCUSDT.P: Liquidation of Highly Leveraged Longs
🌊 SOLUSDT.P: SOL's Dip - Your Opportunity
🐸 1000PEPEUSDT.P: Prime Bounce Zone Unlocked
🚀 ETHUSDT.P: Set to Explode - Don't Miss This Game Changer
🤖 IQUSDT: Smart Plan
⚡️ PONDUSDT: A Trade Not Taken Is Better Than a Losing One
💼 STMXUSDT: 2 Buying Areas
🐢 TURBOUSDT: Buy Zones and Buyer Presence
🌍 ICPUSDT.P: Massive Upside Potential | Check the Trade Update For Seeing Results
🟠 IDEXUSDT: Spot Buy Area | %26 Profit if You Trade with MSB
📌 USUALUSDT: Buyers Are Active + %70 Profit in Total
🌟 FORTHUSDT: Sniper Entry +%26 Reaction
🐳 QKCUSDT: Sniper Entry +%57 Reaction
📊 BTC.D: Retest of Key Area Highly Likely
📊 XNOUSDT %80 Reaction with a Simple Blue Box!
📊 BELUSDT Amazing %120 Reaction!
📊 Simple Red Box, Extraordinary Results
📊 TIAUSDT | Still No Buyers—Maintaining a Bearish Outlook
📊 OGNUSDT | One of Today’s Highest Volume Gainers – +32.44%
📊 TRXUSDT - I Do My Thing Again
📊 FLOKIUSDT - +%100 From Blue Box!
📊 SFP/USDT - Perfect Entry %80 Profit!
📊 AAVEUSDT - WE DID IT AGAIN!
I stopped adding to the list because it's kinda tiring to add 5-10 charts in every move but you can check my profile and see that it goes on..
Disclaimer: This analysis is for informational purposes only and is not financial advice. Trading involves significant risk. Always do your own research.

MINA : Is the shedding over ?Hello friends
Given the heavy fall of this and the prolonged price correction, you can now see that the price is supported within the specified support range, which is a good sign...
We have identified important support areas for you, where you can buy in steps and with risk and capital management.
We have also identified targets.
*Trade safely with us*

SCRUSDT UPDATE
Pattern: Falling Wedge Breakout
Current Price: \$0.268
Target Price: \$0.398
Target % Gain: 50.1%
Technical Analysis: SCR has broken out of a falling wedge pattern on the 12H chart with a clean close above resistance. The breakout is backed by bullish candles and increasing volume, suggesting a potential 50% move upward.
Time Frame: 12H

MINAUSDT 1D AnalysisMINA ~ 1D Analysis
#MINA Maybe you can consider starting to buy back from here with a short term target of at least 10%+ from here and a long term target of $1
SOLUSDT UPDATE
Pattern: Falling Wedge Breakout
Current Price: \$173.38
Target Price: \$300
Target % Gain: 105.90%
Technical Analysis: SOL has broken out of a falling wedge pattern on the daily chart, indicating a bullish reversal. Strong momentum and breakout confirmation suggest a potential move towards the \$300 level.
Time Frame: 1D
Risk Management Tip: Always use proper risk management.

DEXEUSDT UPDATE
Pattern: Bullish Pennant Pattern
Current Price: $14.835
Target Price: $26.61
Target % Gain: 80.18%
Technical Analysis: DEXE has broken out of a descending triangle pattern on the 1D chart. The breakout is supported by a strong bullish candle and sustained price action above the trendline resistance, indicating momentum toward the target.
Time Frame: 1D
Risk Management Tip: Always use proper risk management.

SCRTUSDT UPDATE
SCRT Technical Setup
Pattern: Falling Wedge Breakout
Current Price: $0.2453
Target Price: $0.59
Target % Gain: 160.55%
Technical Analysis: SCRT has broken out of a falling wedge on the 1D chart, indicating a bullish reversal. The breakout is confirmed with strong green candles and volume build-up.
Time Frame: 1D
Risk Management Tip: Always use proper risk management.

KAVAUSDT UPDATEPattern: Falling Wedge Breakout
Current Price: $0.4567
Target Price: $0.74
Target % Gain: 60.53%
Technical Analysis: KAVA has broken out of a long-term falling wedge on the 1D chart, with strong bullish momentum and price closing above the trendline resistance. This breakout signals potential continuation toward the projected target.
Time Frame: 1D

LISTAUSDT UPDATELISTAUSDT Technical Setup
Pattern: Falling Wedge Breakout
Current Price: $0.1893
Target Price: $0.30
Target % Gain: 60.04%
Technical Analysis: LISTA has broken out of a falling wedge pattern on the 12H chart with increasing momentum. Price is holding above the breakout trendline, suggesting bullish continuation. A confirmed breakout with volume could push price to the projected target.
Time Frame: 12H
Risk Management Tip: Always use proper risk management.

MAGICUSDT UPDATE
MAGIC Technical Setup
Pattern: Symmetrical Triangle Breakout
Current Price: $0.2253
Target Price: $0.290,
Target % Gain: 30.06%
Technical Analysis: MAGIC has broken out of a symmetrical triangle on the 4H chart with a strong green candle and volume spike, signaling bullish momentum and a potential 30% upside move.
Time Frame: 4H
Risk Management Tip: Always use proper risk management.

MINAUSDT 1D AnalysisMINA ~ 1D Analysis
#MINA Buy gradually from here if you still have a Conviction on this coin with a short -term target of at least 15%+ from here.

ACEUSDT UPDATEACE/USDT Technical Setup
Pattern: Falling Wedge Breakout
Current Price: $0.635
Target Price: $1.714
Target % Gain: 250.34%
Technical Analysis: ACE has broken out of a long-term falling wedge pattern on the 1D chart with strong bullish momentum. Volume has increased significantly, confirming the breakout with potential for a 250% upside move.
Time Frame: 1D
Risk Management Tip: Always use proper risk management.

DEGOUSDT UPDATEDEGO/USDT Technical Setup
Pattern: Falling Wedge Breakout
Current Price: $1.808
Target Price: $3.70
Target % Gain: 115.05%
Technical Analysis: DEGO broke out of a falling wedge on the 1D chart, showing bullish momentum with a clean candle close above resistance and follow-through volume. Chart suggests potential continuation toward the measured target.
Time Frame: 1D
Risk Management Tip: Always use proper risk management.

MDTUSDT UPDATEMDT/USDT Technical Setup
Pattern: Falling Wedge Breakout
Current Price: $0.02544
Target Price: $0.0586
Target % Gain: 150.48%
Technical Analysis: MDT has broken out of a falling wedge on the 1D chart with a strong bullish candle and an 11.82% daily gain, confirming momentum. Breakout volume and candle close above resistance support further upside.
Time Frame: 1D
Risk Management Tip: Always use proper risk management.

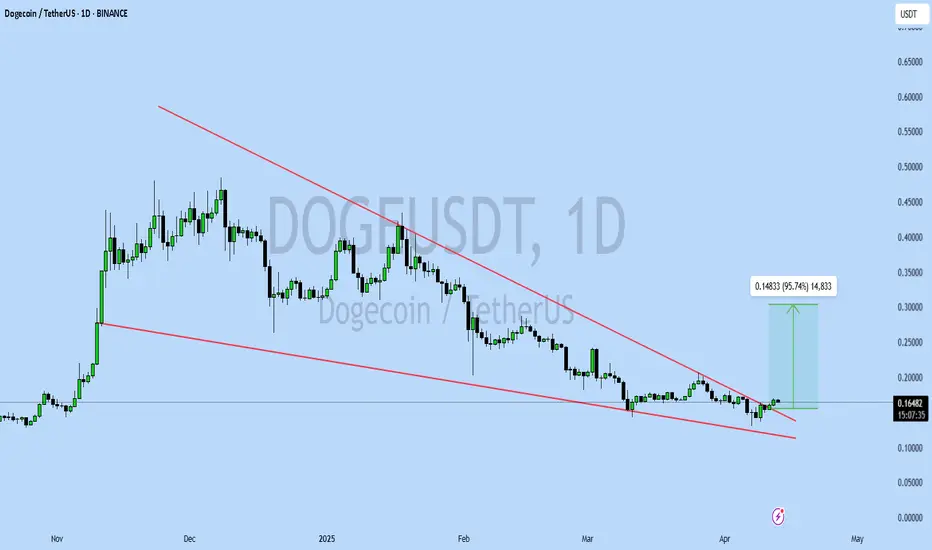
DOGEUSDT UPDATEDOGEUSDT is a cryptocurrency trading at $0.16485, with a target price of $0.30000. This represents a potential gain of over 90%. The technical pattern observed is a Bullish Falling Wedge, indicating a possible trend reversal. This pattern suggests that the downward trend may be coming to an end. A breakout from the wedge could lead to a significant upward movement in price. The Bullish Falling Wedge is a positive indicator, signaling a potential price surge. Investors are showing optimism about DOGEUSDT's future performance. The current price may present a buying opportunity. Reaching the target price would result in substantial returns for investors. DOGEUSDT is positioned for a potential breakout and significant gains.
SEIUSDT UPDATESEIUSDT is a cryptocurrency trading at $0.1700, with a target price of $0.4500. This represents a potential gain of over 200%. The technical pattern observed is a Bullish Falling Wedge, indicating a possible trend reversal. This pattern suggests that the downward trend may be coming to an end. A breakout from the wedge could lead to a significant upward movement in price. The Bullish Falling Wedge is a positive indicator, signaling a potential price surge. Investors are showing optimism about SEIUSDT's future performance. The current price may present a buying opportunity. Reaching the target price would result in substantial returns for investors. SEIUSDT is positioned for a potential breakout and significant gains.

TAOUSDT UPDATETAOUSDT is a cryptocurrency trading at $231.9, with a target price of $360.0. This represents a potential gain of over 60%. The technical pattern observed is a Bullish Falling Wedge, indicating a possible trend reversal. This pattern suggests that the downward trend may be coming to an end. A breakout from the wedge could lead to a significant upward movement in price. The Bullish Falling Wedge is a positive indicator, signaling a potential price surge. Investors are showing optimism about TAOUSDT's future performance. The current price may present a buying opportunity. Reaching the target price would result in substantial returns for investors. TAOUSDT is positioned for a potential breakout and significant gains.

STRAXUSDT UPDATESTRAXUSDT is a cryptocurrency trading at $0.04440, with a target price of $0.07000. This represents a potential gain of over 80%. The technical pattern observed is a Bullish Falling Wedge, indicating a possible trend reversal. This pattern suggests that the downward trend may be coming to an end. A breakout from the wedge could lead to a significant upward movement in price. The Bullish Falling Wedge is a positive indicator, signaling a potential price surge. Investors are showing optimism about STRAXUSDT's future performance. The current price may present a buying opportunity. Reaching the target price would result in substantial returns for investors. STRAXUSDT is positioned for a potential breakout and significant gains.

ATOMUSDT UPDATEATOMUSDT is a cryptocurrency trading at $4.700, with a target price of $7.500. This represents a potential gain of over 60%. The technical pattern observed is a Bullish Falling Wedge, indicating a possible trend reversal. This pattern suggests that the downward trend may be coming to an end. A breakout from the wedge could lead to a significant upward movement in price. The Bullish Falling Wedge is a positive indicator, signaling a potential price surge. Investors are showing optimism about ATOMUSDT's future performance. The current price may present a buying opportunity. Reaching the target price would result in substantial returns for investors. ATOMUSDT is positioned for a potential breakout and significant gains.

CFXUSDT UPDATECFXUSDT is a cryptocurrency trading at $0.0788, with a target price of $0.1400. This represents a potential gain of over 80%. The technical pattern observed is a Bullish Falling Wedge, indicating a possible trend reversal. This pattern suggests that the downward trend may be coming to an end. A breakout from the wedge could lead to a significant upward movement in price. The Bullish Falling Wedge is a positive indicator, signaling a potential price surge. Investors are showing optimism about CFXUSDT's future performance. The current price may present a buying opportunity. Reaching the target price would result in substantial returns for investors. CFXUSDT is positioned for a potential breakout and significant gains.

UNIUSDT UPDATEUNIUSDT is a cryptocurrency trading at $6.780. Its target price is $10.000, indicating a potential 50%+ gain. The pattern is a Bullish Falling Wedge, a reversal pattern signaling a trend change. This pattern suggests the downward trend may be ending. A breakout from the wedge could lead to a strong upward move. The Bullish Falling Wedge is a positive signal, indicating a potential price surge. Investors are optimistic about UNIUSDT's future performance. The current price may be a buying opportunity. Reaching the target price would result in significant returns. UNIUSDT is poised for a potential breakout and substantial gains.

KDAUSDT UPDATEKDAUSDT is a cryptocurrency trading at $0.4898. Its target price is $0.8000, indicating a potential 90%+ gain. The pattern is a Bullish Falling Wedge, a reversal pattern signaling a trend change. This pattern suggests the downward trend may be ending. A breakout from the wedge could lead to a strong upward move. The Bullish Falling Wedge is a positive signal, indicating a potential price surge. Investors are optimistic about KDAUSDT's future performance. The current price may be a buying opportunity. Reaching the target price would result in significant returns. KDAUSDT is poised for a potential breakout and substantial gains.
