GDX Gold miners at support!pretty close to the buying area now...
wait for 4th of December for the Italy referendum vote, we could see one final dump to buy the dip.
Possibility a re-test of $26.
Miner

Short miners Almost a complete capitulation here... giving another try.
Possible technical breakout, with tight stop loss...

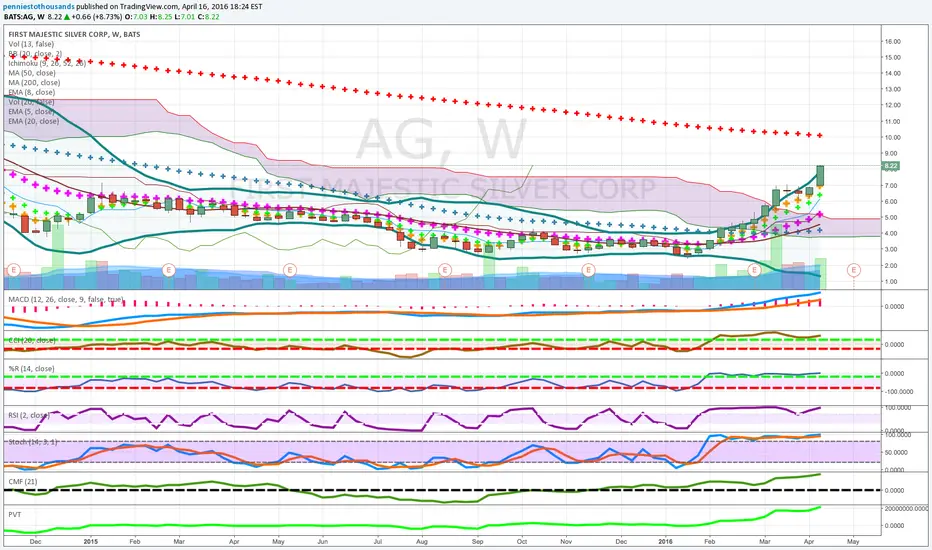
pennies to thousands long term miner coming out of cloudcoming out of thin cloud-see our book on amazon on clouds-diversify among juniors-cci and percent r upper range-stoc crossed-money flow good-bollinger bands narrow-

pennies to thousands long term junior minerabove cloud and 200-juniors will run with metals-see in our book on amazon about relative strength-diversify among juniors-stop loss i n cloud-cci and percent r upper range-money flow good-mace crossed

My dataminer is stating bull, but i'm only seeing bear (next 3 dMy data miner is showing high probability, based on last 20 years, of VOD going up
Longterm neutral Andrew's Pitchfork at roughly 33.50;
Shortterm schiff's pitchfork bullish (and below price action);
Showing strong support/resistance at fibonacci levels
ActionReaction showing a downtrend yet realized that should end around 4/22.
Fib Arcs showing strength by trends; both showing downward arc resistance.
All Bear news on MACD, Stoch, and CCI.
Let me know your thoughts

SPY/XME/USO/GLD/SLV Ratio 4/18/2016 (Short-Term View)Watch the lines. This chart tells us when to switch from bubble assets to contrarian assets.

SPY/XME/USO/GLD/SLV Ratio 4/18/2016 (All-Time View)Watch the lines. This chart tells us when to switch from bubble assets to contrarian assets.


pennies to thousand long term pureest silver play minersilver mining cost 11- above cloud and rising - put stop loss at cloud- pvt and money flow growing- cci and percent r upper range -stoc and money flow strong -relative strength strong- good hedge against negative interest rates


GDX DAILY CHART -- MINERS BREAKOUT, CASH WONT BE KING FOR LONG With all the NIRP's and ZIRP's flying around in an economy based off fraud and debt, this was expected, and now we have the start of the technical indicators to back it up :)
I was expecting it to retrace down to the 17 area to "fill the gap"
Instead it created a bull flag / pennant , and then in 3 days , broke out of our channel and above price action
All very bullish signs, even with the 50 and 200 ma quite far behind
Tomorrow (April 12th) I will be looking for a retracement of 22.16, which if it can hold, is where I buy more miners
- If it doesn't retrace at all I will simply buy in before the day ends, as I'm a firm believer in price action
Feel free to comment with questions or ideas :)
Happy Trading!

pennies to thousands gold mining candidateabove cloud
candle above long base
get our book on patterns to buy on amazon
mad about to cross
relative strength good
above weekly cloud

pennies to thousand gold minermoney flow strong
relative strength good
good candle after series of dojis
get our book on amazon for other indicators
tune into utube channel same name
saucer bottom

Waiting for a breakupConsolidating for the past 3 months, it should break up over the next few weeks.
Enter only if it closes above 0.1267, with stops at 0.1068.
A bullish bitcoin should give a little push to this penny stock, given the risk aversion in the emerging market right now.
