AUMN - DailyStill waiting for launch in the 3rd. Solid (1)-(2), 1-2 set up. Below 0.48 I get concerned. This is a very risky choice; below 1.00 here. Mind you position size and respect what could be a low volume spike down, possibly stopping out what could otherwise be an exciting trade.
Miners

AU - DailyI'd like to see AngloGold hold 9.63 for (2). Was close enough and in the target region so I added some the other day. Targets are projected based on 10.45 low; subject to slight modification. Below 9.63 the pattern is still valid but I'd want to see an initial 5-wave impulse up to add confidence.

AGI - DailyNot completely convinced Alamos Gold has bottomed in (2). Here's a notional projection if it has. Deeper (2) would actually raise these targets slightly. Stop at 6.04, or as deep as 4.50 if your position is small enough and your horizon long enough...

AG - 2 dayNo confirmation yet that Primary 2 has bottomed, but the potential upside here is remarkable. Gonna need a loose stop if you use the 61.8% retrace (bottom of green box).

SA - DailySeabridge bottomed earlier than many miners. So far it topped at the 100% extension (log-scale). That has me concerned as it would normally count as the (3) of P3. I've annotated it as an extended (1) of P3 instead since the retrace is too deep for a 4th wave, imo. That'll extend targets for (3) and P3 beyond normal expectations, but that's not entirely unreasonable for metal-related stocks.
What has me concerned is that the 100% extension is also a typical A=C target in a corrective move...see red oval.
Getting close to the lower end of retrace support, and may wind up stopping me out.

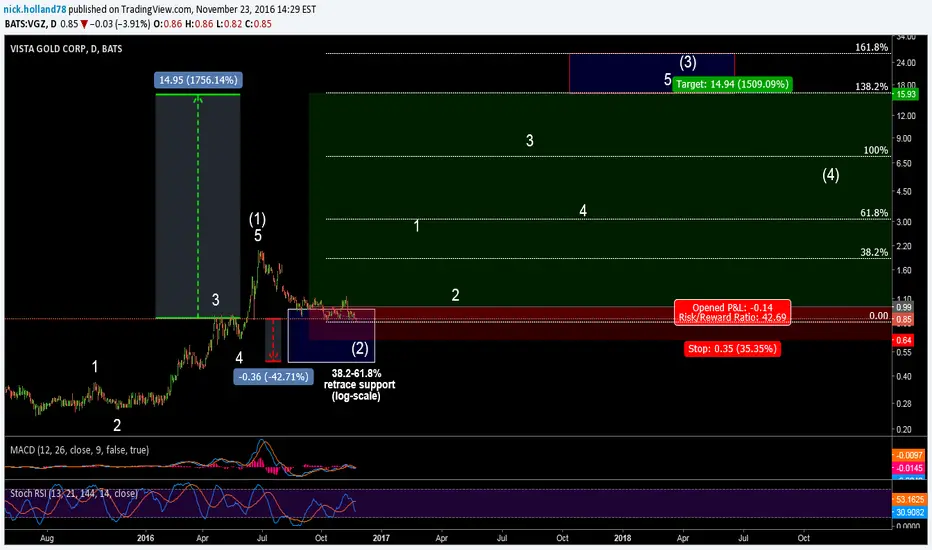
VGZ - DailyPenny stock (currently). Not for the faint of heart. I didn't take a second mortgage for this position (and neither should you). Something like a lotto size position, if you must.
Note: positive divergence holding nicely on MACD, but wave (2) box goes some -43% deeper...
PVG - DailyPretium Resources bottomed about two years earlier than many other miners. This should be wave (4) of primary 3, and technically still valid, but I'm skeptical perhaps something else is in play. The move up stopped near the 100% extension of primary 1-2, a typical A=C corrective target. However, its also a typical (3) of 3 target so I gave it the benefit of the doubt. Price has dipped below the 61.8% extension now - where wave (4) should have stopped. Going to put a hard stop at the recent low ~7.77.

RGLD - 2hrRoyal Gold in holding up well, considering. It's another on that has be caught between two possible counts. Alt blue 2 can go quite a bit deeper but not necessary.

PAAS - 2hrHolding up well considering. Encouraging signs of a potential start to possible start of (1) in Primary 3

MUX - 2hrMcEwen Mining bottomed earlier than many other miners. Getting a confident Elliott Wave count has been challenging. The white 1-2, (1)-(2) is still technically valid but broke below ideal support for (2). Alt blue Primary 2 can come significantly deeper, as shown. If an impulsive move forms above recent highs then that would be an early encouraging sign of much higher prices into next year.

IAG - 2hrLooked like a solid reaction off the top of retrace support. I was a bit early here, but layered in small. Price made an initial 5-waves move up, but cir-ii is questionable and I haven't seen cir-iii of 1 forming like it should. Gonna give it more time.

HMY - 2hrRidiculous potential here, but needs to show some sign of turning. I was too early here, too. Might keep layering in though as my initial position was relatively small.

GPL - 2hrHolding up fairly well here considering. Next target should be clear. Blows through 3.00 range and could be in the more aggressive bullish count.

AXU - 2hrLooks like I might have been a bit early on this one. Primary 2 can go a whole lot deeper but I anticipated the potential for a shallow retrace. Breaking down today.


FCX - 2hrShould start to see some consolidation here soon for wave 4 of (1). Retraces could be shallow if this is indeed setting up wave (3) of Primary 3.

Mix signals - GDX WeeklyA lot of bearish signals here, but one could argue that there are some pretty bullish ones too. The obvious bearish pattern is the potential H&S forming. Bellow average volume on the right shoulder is a clear signal as well as the symmetrical candles compared to the left shoulder. It's seriously almost a mirror image. But on the flip side, we have a potential bullish MA cross happening possibly as soon as this week.
The MACD is looking like it has started to curl up which is bullish. However it could just be a head fake like what we saw on the week of May 23rd (opposite). RSI level is pretty much at a neutral point and could swing either way. Gold is getting a little top-heavy right now but with the elections on Tuesday, it could keep climbing.
Bottom line, we'll know by Wednesday which way GDX is going. I'll be looking at starting a position then...

HUI - DailyMore than a few miners I'm trading count similar to the Gold Bugs Index, with a complex W-X-Y move in the presumed near completion of primary wave 2.

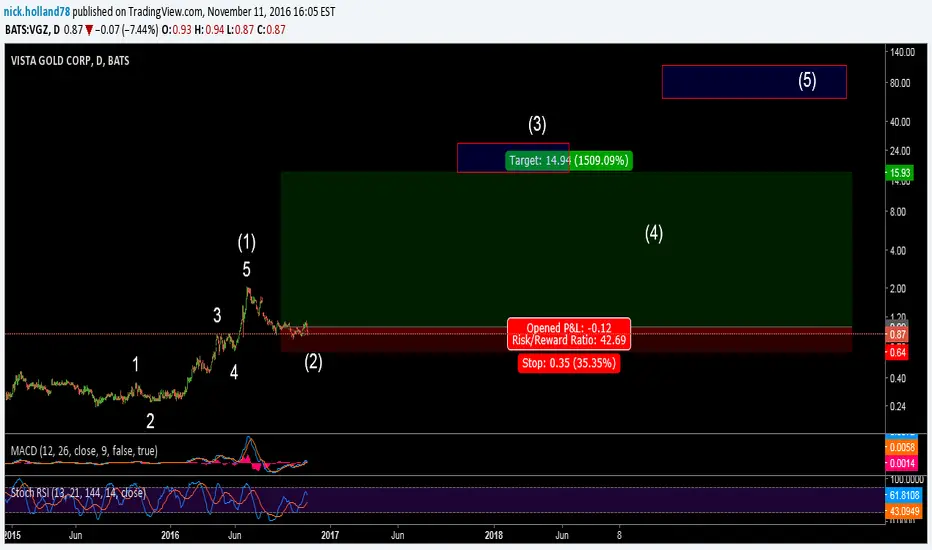
VGZ - DailyFor something trading under $1, gotta be careful. But then look at what some other miners that have been beaten down managed to do earlier this year...
I'm holding a small long position and adding periodically.

BTGLong from 2.35. Stop 2.15. Might be a long-term hold but I'm showing a notional trade to the $9 region.


AG - DailyAG has unbelievable potential in this count. Wave III could go even higher, to the 161.8% extension, but I'll take even a 100% measured move to ~$97...
