Rebalancing with HIVE: A Closer Look at a Solid Miner Taking a strategic look at my crypto portfolio today, and HIVE keeps catching my eye. This established miner offers some compelling reasons for a long-term position. Let's dive in:
Proven Track Record: HIVE has been around longer than many competitors, navigating the ups and downs of the crypto market. This experience translates to reliable operations and consistent uptime, key factors for steady returns.
Efficiency Leader: They consistently rank among the most efficient miners, squeezing the most out of their resources. This efficiency translates to better cost management and potentially higher profitability.
Growth Focused, Not Frantic: While some miners chase aggressive expansion, HIVE prioritizes sustainable growth. This measured approach might limit explosive upside, but it also reduces risk and enhances their long-term stability.
Undervalued Potential: Currently trading below some peers, HIVE could offer an attractive entry point for investors seeking value.
Technical Considerations: The charts signal potential for solid growth, further strengthening the investment case.
Beyond Bitcoin: HIVE ventures into AI and high-performance computing, potentially diversifying its revenue streams and future-proofing its operations.
HIVE Mined 234 BTC in January, HODL Up 14%. Upgraded Fleet for Efficiency, Bracing for Halving.
Key Points:
Production: 234 BTC mined, HODL increased 14% to 1,939 BTC.
Efficiency: Upgraded fleet with latest S21 miners, aiming for lower mining costs.
Halving Ready: HODL strategy and efficiency upgrades position HIVE for Bitcoin halving in April.
Looks like business as usual from HIVE. 😎
Miners

RIOT: Staying on bearish side until bulls can prove me wrongStaying with bearish count until price can break above $18.36. Since BTC is pumping, would expect some more gains for RIOT next week, but don't expect much at the moment. The earnings were good and company is doing a lot of right things to become the leading name in mining. There is an inverse head and shoulders patter forming. I have taken a small position at around $8.5 where I got a buy signal and taken some profit. I want to see another lower low to fill my bag properly. If I don't get my wish and if $7.8 was the final low (technically it could be), then I will look to buy the dips only after price moves above $18.36.

RIOT Platforms Options Ahead of EarningsAnalyzing the options chain and the chart patterns of RIOT Platforms prior to the earnings report this week,
I would consider purchasing the 15usd strike price Calls with
an expiration date of 2025-1-17,
for a premium of approximately $2.98.
If these options prove to be profitable prior to the earnings release, I would sell at least half of them.

Bitcoin Miners Navigate Uncharted Waters Amid Halving EventThe aftermath of Bitcoin's recent halving event has ushered in a new era of uncertainty and opportunity for miners, as they grapple with escalating mining costs and shifting market dynamics. With the hash power required to produce one Bitcoin ( CRYPTOCAP:BTC ) per day surpassing unprecedented levels, miners face a daunting reality characterized by shrinking profit margins and heightened competition.
Halving's Impact on Mining Economics:
The halving's direct impact on miners' revenue, coupled with the surge in hash rate, has triggered a seismic shift in mining economics. The reduction in block rewards from 6.25 CRYPTOCAP:BTC to 3.125 CRYPTOCAP:BTC has necessitated a doubling of mining investments to maintain profitability. Data from Glassnode underscores the magnitude of this shift, with the total number of Bitcoins produced plummeting post-halving, exerting further pressure on miners' bottom lines.
Navigating Profitability Challenges:
The profitability of Bitcoin ( TSX:BCT ) mining, as measured by hashprice, has plummeted by 72% in the wake of Bitcoin's declining price. Despite these challenges, miners find solace in the potential of transaction fees emerging as a viable revenue stream amidst dwindling block rewards. The surge in transaction fees following the halving, driven by protocols like Runes, offers a glimmer of hope amid turbulent market conditions.
Whale Movements and Market Sentiment:
Bitcoin's dip below $64,000 has ignited speculation about a potential market reversal, with whale movements and bearish sentiment dominating the narrative. The surge in whale Bitcoin exchange inflows suggests profit-taking amid the ongoing bull run, fueling concerns of further price corrections. However, optimistic signals, such as decreasing exchange reserves and a declining Network To Value (NVT) ratio, hint at a potential price rebound in the offing.
Charting a Path Forward:
As miners worry about their current plight, resilience, and adaptability emerge as their greatest assets. With the potential for transaction fees to offset declining block rewards and promising indicators of a market reversal, miners are poised to capitalize on emerging opportunities amidst the evolving Bitcoin ecosystem. The convergence of technological innovation and market dynamics presents a fertile ground for miners to thrive in the face of adversity.

USAS is currently in an accumulation area between $0.20-0.25Below 0.20 is a danger zone, so I wll be having stop loss at $0.19 and keep buying at $0.20-$0.25. And looking to sell half at $0.45.
Long-term, we are looking at a $0.88 sell level.

RIOT trade idea.If BTC uptrend in tact. RIOT has bullish post-june fundamentals. If Rate cut thesis in tact etc.

Bubble theory 🫧 BTC minersThere are two type of bubbles and they burst for different reasons? A bubble is when too many people hold something and what has driven prices up, now as a force works against them.
There's a saying. Buy things when everyone is a skeptic. Sell when a taxi driver starts talking about investing. There are no more buyers left on top.
First bubble is when volume dries up as the price hits extremes.
Second is when peoples attitudes or sentiment, or opinions change to bearish. And that can happen over night, like a switch. It's interesting and finance is a social science.
Some bubbles can burst due to external events, like start of wars or some financial crisis.
There can be strong bull markets and most of times, these external events would just be noise?
> Was btc miners in bubble? And what type of bubble?
I think Yes and No? Whenever there's a risk free trade, supported by factors a bubble emerges? The price of Mara was rallying hard, trend was strong. You could argue people got over optimistic, knowing the ETF decision was a risk event. -> therefor (the burst) was sentiment driven. But also predictable?
Bubble is when too many people hold asset and there re no buyers left. Similar how a taxi driver is hype about investing.
Technical analysis gives you perspective and context. In 1st instance, impulse was too high and volume indicates crowding? It's tricky because it looks so bullish.
In 2nd instance, impulse was too low. Price action looked bullish? bubbles happen when too many people hold the shares and expect them to rise.
If 1st instance was sentiment switch driven, then 2nd time, the bubble must burst due to exhaustion (or no people left to buy... at these prices.. similar how taxi driver hops in the trade at the wrong time).
Factors and thesis can be bullish - and bubble still bursts.
Is NVDA and SMCI a bubble?
I think there is difference between NVDA, SMCI investors and their time horizon? It could be. I think people believe their investment is supported by the tech drivers. Every dip should be bought out by smart investors and these are the best assets to own in next 5-10 years.
It doesnt mean there cant be external events and risks.
again- bubble is when too many people are in investment. So bubble can burst either by them changing their sentiment or beliefs (maybe fundamentals must change?). Or if price is just so ridiculously high or there is no money left at sidelines, that trend can't be sustainable.
When markets rally - everyone only reads good news and ignores bad news. And vice versa. #HowardMarks #MarketCycle
---> The Risk-Reward buying at these tops just isn't great. That's why they burst. Accompanied by sentiment risks, that hide behind the hood.

Mara cooling down before the next leg upIt's been a difficult time being a Mara/BTC miner holder the past few weeks, as BTC has hit ATH's and the miners have counterintuitively been crashing and burning..
No one was expecting the BTC ETF to have the demand that it did, there just isn't enough BTC out there, post halving this will get even tighter. Historically, once previous cycle ATH's have been breached the average time for BTC to double in price is c.70 days, if this holds true we are going to see a $140k BTC by the Summer.
With that backdrop, moving onto the Miners, Mara was way over-extended and had run up too hard (As seen by the large bearish divergence on the RSI), it needed to cool down, this is just reversion to the mean and I can see it falling further to the $18-19 levels where there is historical support. I think at these levels it is a big buying opportunity and I can see this going far higher - $40 by end of April is where I see this going. The weak hands are being flushed out and it is supercharged and primed for a move higher! Let's see how it plays out :)

Bitcoin 3 month chart. PROOF OF WORK REGULATIONS** Are Proof-of-Work Crypto Miners in Danger of Government Crackdown ?**
Proof-of-work (PoW) is the consensus mechanism that secures the Bitcoin network and some other cryptocurrencies. It involves miners using powerful computers to solve complex mathematical problems and earn new coins as a reward. However, this process also consumes a lot of energy and generates a lot of heat and noise. Some critics argue that PoW mining is wasteful, harmful to the environment, and contributes to climate change.
In recent years, some governments have taken steps to regulate or ban PoW mining in their jurisdictions. For example, China, once the dominant player in the global mining industry, has cracked down on PoW mining activities and forced many miners to relocate or shut down. Other countries, such as Iran, Venezuela, and Kazakhstan, have also imposed restrictions or taxes on PoW mining operations.
One of the main reasons for these regulatory actions is the concern over the illicit use of cryptocurrencies for money laundering, terrorism financing, tax evasion, and other criminal activities. To combat these risks, some governments have introduced or proposed anti-money laundering (AML) and know-your-customer (KYC) rules for the crypto industry. These rules require crypto service providers, such as exchanges, wallets, and custodians, to verify the identity and source of funds of their customers and report any suspicious transactions to the authorities.
However, PoW mining poses a challenge for the implementation of these rules, as it allows anyone with a computer and an internet connection to create and transfer cryptocurrencies without revealing their identity or location. This makes it difficult for regulators to monitor and trace the origin and destination of crypto transactions and enforce compliance with AML and KYC standards.
Some experts believe that this could lead to a global crackdown on PoW mining in the near future, as more governments adopt the Markets in Crypto-Assets (MiCA) regulation proposed by the European Commission in 2020. This regulation aims to create a harmonized framework for the crypto market in the European Union and beyond, and it includes provisions that could potentially ban or discourage PoW mining.
According to the vice chair of the European Securities and Markets Authority (ESMA), Erik Thedéen, PoW mining should be banned in the EU, as it is incompatible with the bloc's environmental and social goals. He also suggested that EU regulators should nudge the crypto industry towards the less energy-intensive proof-of-stake (PoS) mining, which is used by some newer cryptocurrencies, such as Ethereum 2.0¹.
If the MiCA regulation is adopted and enforced, it could have a significant impact on the global crypto market, as the EU is one of the largest and most influential economic blocs in the world. It could also set a precedent for other countries and regions to follow suit and impose similar or stricter rules on PoW mining.
This could pose a serious threat to the survival and security of PoW-based cryptocurrencies, especially Bitcoin, which relies on a large and diverse network of miners to maintain its decentralization and resilience. If PoW mining becomes illegal or unprofitable in many parts of the world, it could reduce the hash rate and the difficulty of the network, making it more vulnerable to attacks and manipulation.
On the other hand, some proponents of PoW mining argue that it is not as bad as it seems, and that it has some benefits that outweigh its costs. They claim that PoW mining is a fair and transparent way of distributing new coins and incentivizing network participants to behave honestly and cooperatively. They also point out that PoW mining is becoming more efficient and eco-friendly over time, as miners adopt renewable energy sources, such as solar, wind, and hydro, and use waste heat for other purposes, such as heating homes and greenhouses.
Moreover, they contend that PoW mining is not the main driver of crypto-related crime, and that banning it would not solve the problem of illicit use of cryptocurrencies. They assert that most criminals prefer to use centralized and anonymous platforms, such as mixers, tumblers, and dark web markets, rather than decentralized and transparent networks, such as Bitcoin. They also emphasize that cryptocurrencies are not inherently evil, and that they have many legitimate and positive use cases, such as financial inclusion, innovation, and empowerment.
Therefore, they urge governments and regulators to adopt a more balanced and nuanced approach to PoW mining, and to recognize its potential value and contribution to the development and adoption of cryptocurrencies. They also call for more dialogue and cooperation between the crypto industry and the authorities, and for more education and awareness among the public and the policymakers, to foster a better understanding and appreciation of PoW mining and its role in the crypto ecosystem.
What do you think? Do you support or oppose PoW mining? Do you think it should be regulated or banned? Share your thoughts and opinions in the comments below.

RIOT: Bull and Bear ideasRIOT has made a V recovery once again, making the bear case almost obsolete. The primary and secondary trendline resistance has been successfully broken and right on the third trendline resistance at the moment. Let's look at bull and bear case and see when to enter the rocket to the moon.
Bull case:
If this is the beginnings of intermediate wave 3, then the current price action is at the start of Minute degree wave 1. We should see a higher high above December high and then a correction. The correction or Minute degree wave 2 cannot break below $8.61. After that we should see the strongest part of the rally which will be a wave 3 of 3 of 3. Ideally, after a higher low is confirmed, entry point would be above the previous higher high. We are looking at triple digit numbers, so it is OK to wait until we see a solid support above $19.
Bear case:
Bear case would still suggest intermediate wave 2 is still in effect. The correction just got a whole lot more complex. The current price action could be part of a B wave triangle where a C wave is still in the books, or it could be part of a larger Y wave that will take things down back to previous lows. At this point these two scenarios cannot be written off. Need to let some more time pass before the bear case can be completely thrown out.
We should see a correction of the current runup in the next week or two. How that plays out will confirm which way is right. Ideally, a higher low and higher high on weekly will provide confidence on bull side.

Bitcoin's Rebound Above $45,000 Signals Market ResilienceAs Bitcoin ( CRYPTOCAP:BTC ) breaches the $45,000 mark once again, signaling a bullish resurgence, underlying market dynamics suggest a significant shift in sentiment and resilience within the crypto ecosystem. Amidst fluctuating prices and heightened volatility, a closer examination reveals a compelling narrative of miner confidence and evolving investor strategies.
Recent data from CryptoQuant unveils a notable trend: the largest U.S. publicly traded bitcoin mining companies are actively increasing their bitcoin holdings. Marathon Digital, among others, has seen a steady accumulation of bitcoin over the past months, indicating a strategic shift towards long-term investment strategies among miners.
This accumulation comes at a pivotal moment as on-chain metrics depict a reduction in mining selling pressure. Daily selling by miners, which peaked at over 800 bitcoins during the tumultuous months of November and December 2023, has now tapered off to below 300 bitcoins per day in 2024. Despite a substantial decline in profits from network fees, miners are holding onto their reserves, showcasing a newfound resilience amidst market fluctuations.
The decline in fees, attributed to lower network activity, is a consequence of fewer transactions originating from inscriptions and BRC20 token mints. From a daily all-time high of 731,000 transactions in late December, the Bitcoin network has witnessed a significant drop to a three-month low of 278,000 transactions. This decline, however, hasn't deterred miners from maintaining their bitcoin reserves, emphasizing a long-term bullish outlook.
Furthermore, the decrease in mining rewards, as observed by The Block's Data Dashboard, underscores the evolving landscape of bitcoin mining. Despite reduced rewards, miners are steadfast in their commitment, indicating a fundamental belief in the long-term value proposition of Bitcoin.
The recent upswing in Bitcoin prices has not been without its share of volatility. The surge above $45,000 triggered a cascade of liquidations, totaling over $114 million in leveraged cryptocurrency positions. Coinglass data reveals that over $49 million in bitcoin leveraged positions were liquidated, predominantly shorts.
Despite these liquidations, Bitcoin has maintained its upward trajectory, showcasing resilience in the face of short-term market turbulence. With a price increase of over 4% in the past 24 hours, Bitcoin's resurgence to $45,133 at 9:35 a.m. ET signifies renewed investor confidence and underscores the robustness of its underlying fundamentals.
Technical Outlook
Bitcoin has successfully remained above the $43,000 mark, around which its price had been oscillating for more than two weeks, showing an upward trend yesterday. Nevertheless, this does not assure the coin's continued growth in the medium term.
On the chart, there's a significant resistance area between $45,000 and $46,150, which harbors a considerable number of sell orders. This range is pivotal for the continuation of the upward trend. If buyers can establish a foothold above $46,150, Bitcoin could rapidly target $48,970 and possibly challenge the psychological barrier of $50,000.
In a different scenario, BTC could persist in its local downward trend. At present, the primary buy orders are positioned at the $43,000 level. If BTC loses this support, the next targets for sellers would be the support zones of $40,800–$41,800 and $38,500–$39,600.

RIOT: Choppy action upwards. Brace for impact!The bounce upward this week is looking choppy and corrective, keeping the bearish count alive. If this path continues next week, we should see heavy resistance between $12 and $13. The leg down afterwards should be the last leg on this downside, and we should see the entire crypto market come alive with intense impulsive drive when that is done. Right now, if we see a break above $ 13.75 and a sustained price action above $10, then things might start to look more bullish. Until that happens, shorting the resistance area would be the next play.

A nice looking base continues for Outcrop!A base has been building for 5-6 years while some diagonal lines are starting to squeeze this base. If we see 50 cents again -- then expect much higher prices shortly thereafter.

RIOT: can go one of two waysRIOT price action has been interesting. The choppy action in the month of October has kept me out of a trade but, the November pump has made things a bit awkward. From EW perspective, I have 2 possible counts that are high probability. I have changed some degree of labeling from my last post, but overall, it's the same idea.
Option 1: Bearish idea that we are still having a larger degree wave 2. Price is putting in wave B right now and we will see a very sharp move down to complete intermediate wave 2 and then go into the bull run of all bull runs for the miner stock.
Option 2: Bullish idea that intermediate wave 2 is complete and price is already in the massive bull run.
So how do we know which one it is? The answer is to let some more time pass.
For option 1 we might see one or two more highs in the next few days before some kind of a bearish divergence gets created in RSI in lower (4/8/12 hour) to higher (daily) time frames. Then, the downturn would be sharp and quick. Everyone will say crypto is dead again and most likely the low of wave A will break.
For option 2, the same one or two highs in the next few days will be just the lower degree wave 3 and the retrace will be slow and choppy for wave 4 for a week or two and it will put in another 5 waves to complete the minor degree wave 1 and then the correction will be a longer wave 2.
The trade will be to watch the price and play the retrace. If things are sharp and quick, we can play the bounces with stop losses. If things are lazy and time consuming, then start to build small positions along fib retrace areas and DCA until some key level breaks. In both cases, trade is not right now and, in both cases, RIOT will make some crazy gains next year. Risk is lower above $20.

Breakout imminent. Time to play catch up.Bitcoin has moved a bunch whilst these stocks lagged. A big divergence in price appreciation. NDX is bottoming out. So is the S&P.. as long as bitcoin holds price up here these stocks could easily run 150% - my prediction is 25$ before a pull back to 15

HIVE Next Steps 2023 Q3 & BeyondAm expecting HIVE to continue consolidating within a reversal Head & Shoulders pattern.
Applying the trendlines to the fib line retracement and extension mappings, building out the various channels and then overlaying the relevant pattern(s), it appears the bottom of the right shoulder is approx. $2.80 and the future target is approx. $28.
DYOR NFA ... if $2.80 breaks, may result in a double-bottom around the $0.30 range.
Enjoy every sandwich :)

Gold - what the heck?Gold made a brief New All time high before getting smashed down.
This is the largest Daily Bearish engulfing candle gold has ever had.

$MARA down again to $6-8 before up?Similar to my thoughts on NASDAQ:RIOT , I also think NASDAQ:MARA likely has another leg down before starting the uptrend higher.
I think most likely scenario is price tests the $10.43 level once more, rejects, and falls to retest the lows.
After retesting the lows in the gray box, then we start the real rally higher.
If this idea does play out, my current thinking is that the rally higher would be quick in early December hitting between $16-20 as the final move higher.
This idea lower would be invalidated on a move higher than that $11-12 region.
Let's see what happens.

Moon. Soon.Bitcoin has moved a bunch whilst these stocks lagged. A big divergence in price appreciation. NDX is bottoming out. So is the S&P.. as long as bitcoin holds price up here these stocks could easily run 150% - my prediction is 27$ before a pull back to 14.50

MARA Marathon Digital Holdings Options Ahead of EarningsAnalyzing the options chain and the chart patterns of MARA Marathon Digital Holdings prior to the earnings report this week,
I would consider purchasing the 8usd strike price in the money Calls with
an expiration date of 2023-11-10,
for a premium of approximately $1.50.
If these options prove to be profitable prior to the earnings release, I would sell at least half of them.
Looking forward to read your opinion about it.

$RIOT, more downside around $8 before higher?As you can see on the chart, NASDAQ:RIOT has formed a rising channel and has broken to the downside and is currently testing the channel as resistance. Should it not be able to make it back into the channel, then my bias leans towards more downside before higher prices.
As of now, I lean towards the lows getting retested or broken and a bottom forming around the $8 region.
After that takes place, then I think NASDAQ:RIOT is primed for a large move higher in which we should see prices go 100%+ into the $15-$17 region.
Let's see if/how it plays out.

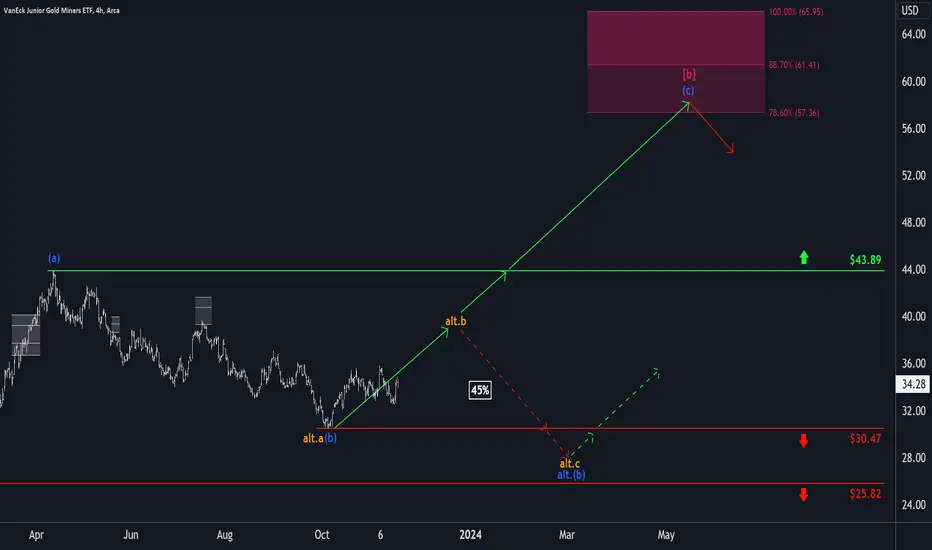
GDXJ: Revived 🌅In the current blue wave (c) of the GDXJ, the bulls pulled out their defibrillators and breathed some life back into the market. With a 5.5% gain, the wave extension continued, which should carry on above the next resistance at $43.89 and then enter the magenta Target Zone ($57.36 - $65.95). In this price range, both the top of the blue wave (c) and that of the overarching magenta wave (b) should be manifested. However, our alternative with a probability of 45% also remains valid. In this case, an imminent reversal would take place with the high of the orange wave alt.b.
Bitcoin - Take Advantage of the Exit Pump, While You Still CanThe pattern on Bitcoin is really similar to Ethereum, which I outline in a recent call:
Ethereum - A Sucker's Rally Before The Bitter Winter
The difference between Bitcoin and Ethereum is ETH has more than 50% upside available to hit its similarly-placed goalposts, while BTC is just another ~30%.
Fundamentally, the problem for crypto bulls is that the 2021 bull run formed a Bump and Run Reversal (BARR) on CME Futures.
The inner meaning of a BARR is that its the eternal top, and once the lows are taken, the trend is over.
This is especially crucial to understand when a BARR manifests on regulated futures, because these futures are uniquely cash settled and do not require anyone to post spot as collateral to short, there are ETFs linked to CME price, miners are hedging their on-chain wallets with this product, and the day-to-day survival of crypto relies on the SEC/FBI/DOJ delaying the annihilation of iFinex/Bitfinex/Tether.
Once the trend is over, getting a rip to sell into is really a blessing, because what comes after is some gapping and then the landslide doom pattern that delisted coins and garbage penny stocks follow for a long time afterwards.
We're at the prelude to crypto entering the no-bounce territory, because they need to be eliminated for Central Bank Digital Currencies (CBDC).
Governments need to issue their own coins on centralized blockchains in order to install worldwide the Chinese Communist Party's Zero-COVID social credit system, because they just love the CCP's things so much it amounts to a fetish.
And the problem for humanity is that these digital currencies do very little that is positive, while consuming an unbelievable amount of physical technical resources to make the chips and even more resources to produce the power that's needed to win the mining lottery.
SHA256 mining is a total joke because more miners being added to the network don't increase transactional throughput at all, or really even "security." It's just a life-or-death requirement for miners to keep up with the difficulty boosts to win the block reward lottery to keep putting these things online.
And in China, where everything is corrupt because of Xi Jinping's CCP, flooding villages and cities to manipulate the supply of hydro to sell to mining outlets has been a common practice of the regime's officials for years.
Even the Mekong has been impacted gravely by the rogue CCP's gluttony for electricity to fuel the crypto mining operations run and cut by the regime's cronies.
Much of digital currency has been co-opted by the CCP via its United Front Work Department operations, and much is done through the Triad mafia itself.
Just about everything in crypto and everyone who's anyone in crypto operate on Wechat, the CCP's erstwhile implementation of surveillance and social credit.
This is important because the 24-year persecution and organ harvesting genocide against Falun Dafa's 100 million practitioners looms like The Reaper over Xi and the Party.
Disaster and plague can take the regime down literally any day.
At the same time, Xi can save himself by overthrowing the Party in a coup, Gorbachev style, literally any day.
So the risks are huge.
But right now, if you want to play this table at the international casino, then the trade is long, not short, with a target over the May of '22 pivots at $48,000 and an expectation that $50,000 will either not be touched, or will be wicked through to sweep stops that both close shorts and open longs.
You have a clear breakout on Monthly and Weekly bars, with no retrace on lower bars, and this is why short = dead, until price reaches its upside target. Frankly, a brief interlude back to $34,000 would be quite the gift to go long on and mitigate underwater shorts with.
You cannot short $48,000 unless a reversal pattern appears, because the trend is strong for the first time in more than a year.
Digital currencies are something for you to have absolutely no faith in. You need to stay away from everything related to this. A huge amount of killing, human trafficking, and corruption operates via that community and its various blockchains, and the sins are both boundless and eternal.
The sins are so huge that mankind's justice system, even in the future, will not be able to settle the blocks that update the real ledger in this Cosmos.
