Strong Fundamentals, Stretched ValuationThe Bull Case - Operational Excellence:
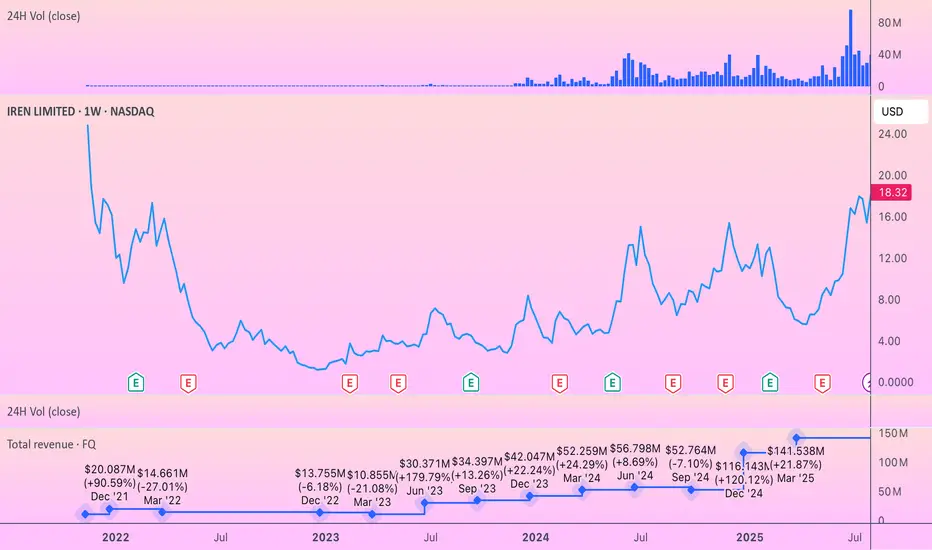
IREN delivered another impressive month with record monthly revenue of $86m, record 728 BTC (#1 among Bitcoin miners and surpassed Mara, Cleanspark, Cango, Riot, and BitFuFu) and record hardware profits of $66m in July IREN July 2025 Monthly Update. The company's operational metrics are genuinely strong:
Mining Efficiency: 45.4 EH/s average operating hashrate with best-in-class efficiency (15 J/TH) and healthy 76% hardware profit margin
AI Pivot Execution: Successfully expanding beyond Bitcoin with 2.4k NVIDIA B200/B300 GPUs and 98% hardware profit margin on AI services
Infrastructure Scale: Massive pipeline with 1,400MW Sweetwater 1 and additional 600MW Sweetwater 2 projects
The Valuation Concern:
However, the market appears to have gotten ahead of itself. IREN is trading at $18.32 with a 52-week range of $5.13 to $21.54, representing a ~257% gain from its lows. Current analyst consensus shows mixed signals - while 12 analysts give it a Buy rating with an $17.78 price target, this suggests minimal upside at current levels.
Key Risk Factors:
Bitcoin Dependency: Despite AI diversification, Bitcoin still drives 97% of revenue (~$83.6M vs $2.3M AI)
Execution Risk: Aggressive expansion timeline with April 2026 energization for Sweetwater 1 creates delivery pressure
Capital Intensity: Massive CapEx requirements for 2GW+ of planned capacity in a rising rate environment
IREN is operationally executing exceptionally well, but the stock price already reflects much of this success. The 320%+ rally from 2024 lows has created a situation where even strong execution may not drive meaningful returns from current levels. The company's transformation into a diversified digital infrastructure play is promising, but investors are paying a premium multiple for what remains largely a Bitcoin mining operation.
Mining
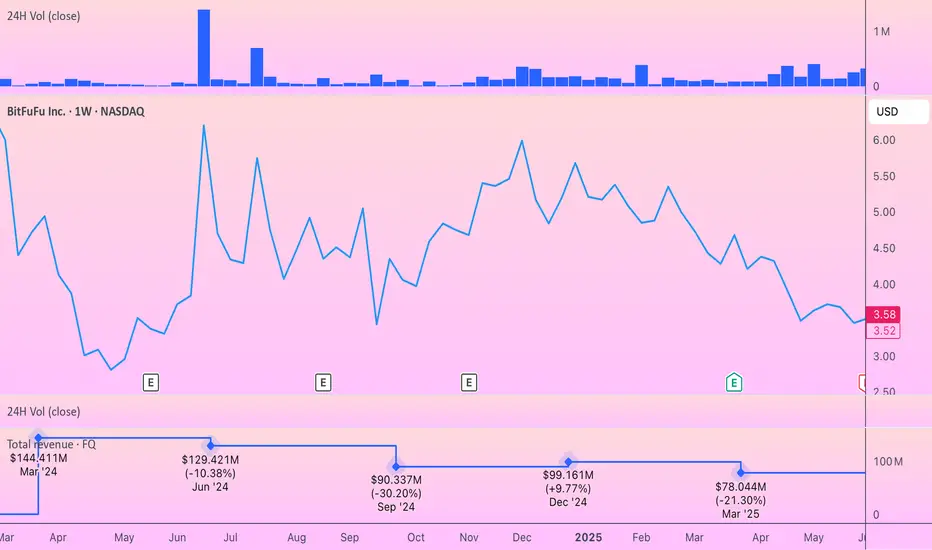
$FUFU | Strong July NumbersBitFuFu just dropped solid July metrics. Total hashrate under management hit a record 38.6 EH/s (+6.6% MoM), now ranked #5 among public Bitcoin miners, with power capacity expanding to 752 MW. Self-mining production surging 43.1% to 83 BTC - this shows they're getting real operational leverage from their infrastructure investments.
The dual approach is working: they're scaling both proprietary mining and their cloud platform (now 629k+ users). With the recent crypto-friendly policy shifts in the U.S., including the GENIUS Act, FUFU is positioned to benefit from the regulatory tailwinds.
I'm watching this as a leveraged infrastructure play on crypto. The operational momentum is clear, but it's still tied to BTC price action. Looking for volume confirmation and any breaks above key resistance if Bitcoin stays strong. The mining gains suggest they're building real competitive advantages here.
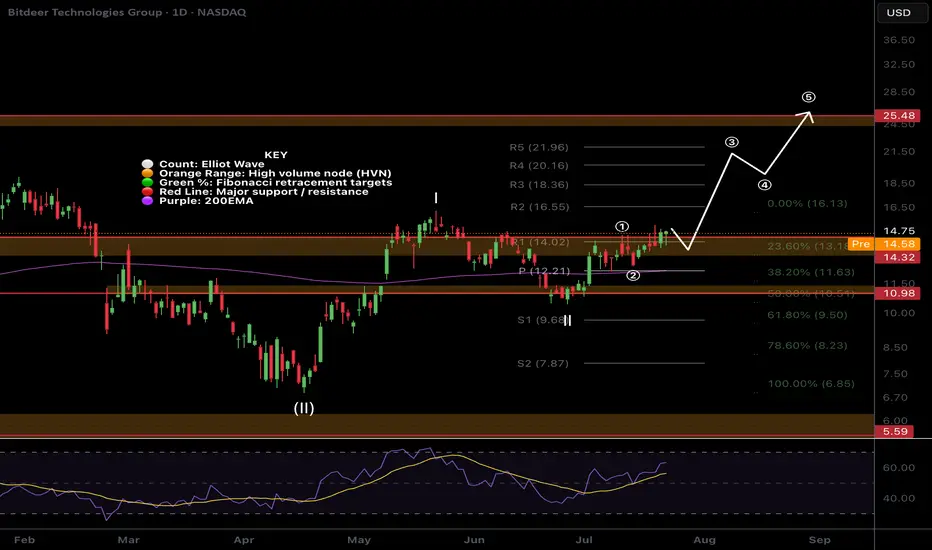
$BTDR Closed above resistance!NASDAQ:BTDR Bitdeer closed above major resistance yesterday, despite BTC and alt coins having a bearish day, triggering our long signal in the Weekly Trade signals substack.
I am looking for price to start to accelerate in wave 3 and resistance now support to hold. If BTC reverses it will add additional tailwinds with a target of the major resistance above the R5 daily pivot $24
Safe trading
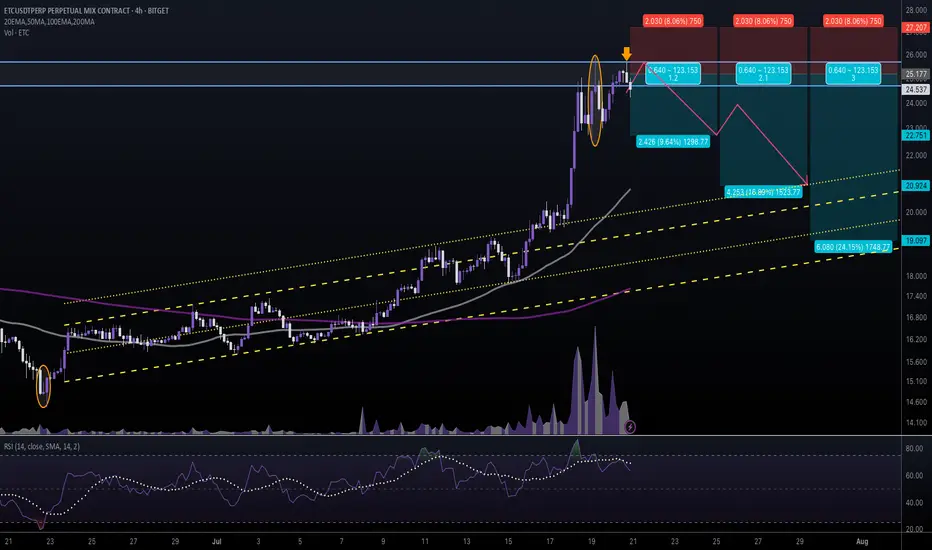
#ETCUSDT #4h (Bitget Futures) Ascending channel retestEthereum Classic printed two evening stars in a row, looks locally topped and ready for correction towards 50MA & 200MA supports.
⚡️⚡️ #ETC/USDT ⚡️⚡️
Exchanges: Bitget Futures
Signal Type: Regular (Short)
Leverage: Isolated (5.0X)
Amount: 5.0%
Entry Zone:
24.679 - 25.675
Take-Profit Targets:
1) 22.751
2) 20.924
3) 19.097
Stop Targets:
1) 27.207
Published By: @Zblaba
CRYPTOCAP:ETC BITGET:ETCUSDT.P #4h #EthereumClassic #PoW #L1 ethereumclassic.org
Risk/Reward= 1:1.2 | 1:2.1 | 1:3.0
Expected Profit= +48.2% | +84.5% | +120.7%
Possible Loss= -40.3%
Estimated Gaintime= 1-2 weeks
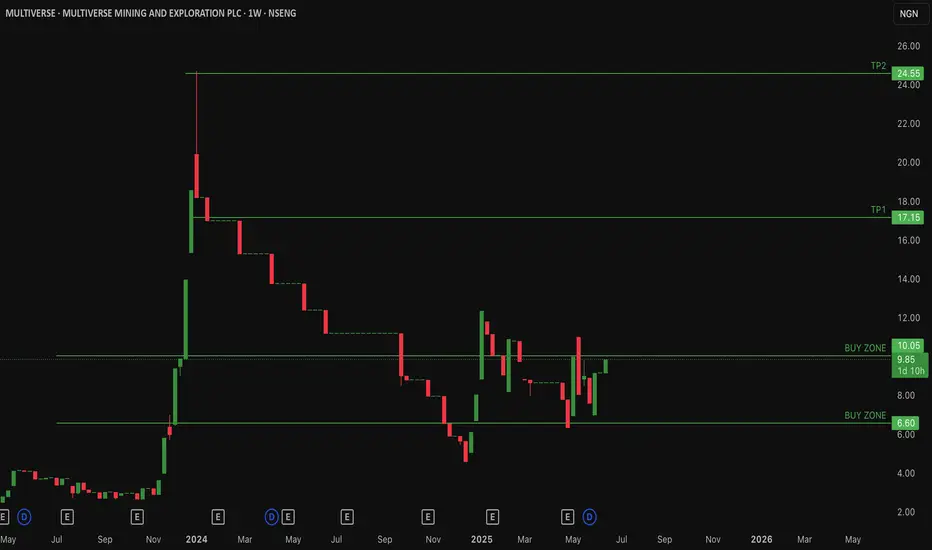
$MULTIVERSE Multiverse over 60% retracement from All time HighNSENG:MULTIVERSE Multiverse Mining & Exploration Plc focuses on quarrying solid minerals (granite, zinc, tin, tantalite, barite, columbite, gold, etc.) in Nigeria, with operations in Ogun and Nasarawa State.
Currently NSENG:MULTIVERSE has lost over 60% of its value from an all time high of 24.50/share and is in consolidation.
Current price: 9.85naira/share
Low risk Buy zone levels is between 6.8naira - 10naira/share
Expecting #Multiverse to retest previous resistances at 17naira/share and 24naira/share if price attempts a recovery.
📈 Key Levels
Breakout above ₦10.20 Breakout zone – key resistance turning into support if broken
₦17.1 TP1 – next major resistance (target)
₦24.5 TP2 – higher resistance / bull target
Invalidation of this idea is a weekly close under 6.8naira/share
CLSK Finally Ready for a strong move up?Price printed a textbook motif wave 1 and ABC wave 2 correction ending at the 61.8 Fibonacci retracement golden pocket and High Volume Node (HVN) major support.
Price continues to flirt with weekly 200EMA and looks ready for another test as resistance on the local chart.
The weekly pivot still looms above but if price is in a macro wave 3 we should punch through these resistances over the next few weeks and head towards long term target of $80.
Wave 2 can extend all the way $1.80 before invalidation, though the lower prices goes, the lower the probability of the analysis being correct
Safe trading

Pegasus is closing in on a major price decision!Pegasus is squeezing vs uranium sprot price.
A break above the top (black) diagonal line would give this a lot of room to run.

Most likely to bounce towards 75This may have reached its bottom for now (or more room to go down towards low 40s)... most likely it should bounce to $75 and then collapse to lows. This could go sideways for years with small ups and downs in between.

Potential outside week and bullish potential for ADTEntry conditions:
(i) higher share price for ASX:ADT above the level of the potential outside week noted on 21st February (i.e.: above the level of $4.41).
Stop loss for the trade would be:
(i) below the low of the outside week on 19th February (i.e.: below $3.97), should the trade activate.

TradeCityPro | PI: Detailed Crypto Analysis and Insights👋 Welcome to TradeCity Pro!
In this analysis, I want to review PI, which has been highly requested in the comments. This project was one of the oldest crypto airdrops, and its coin has finally been launched. Now, I want to analyze it for you.
✨ This coin doesn’t have much chart history, so I will analyze it using the 4-hour and 1-hour timeframes.
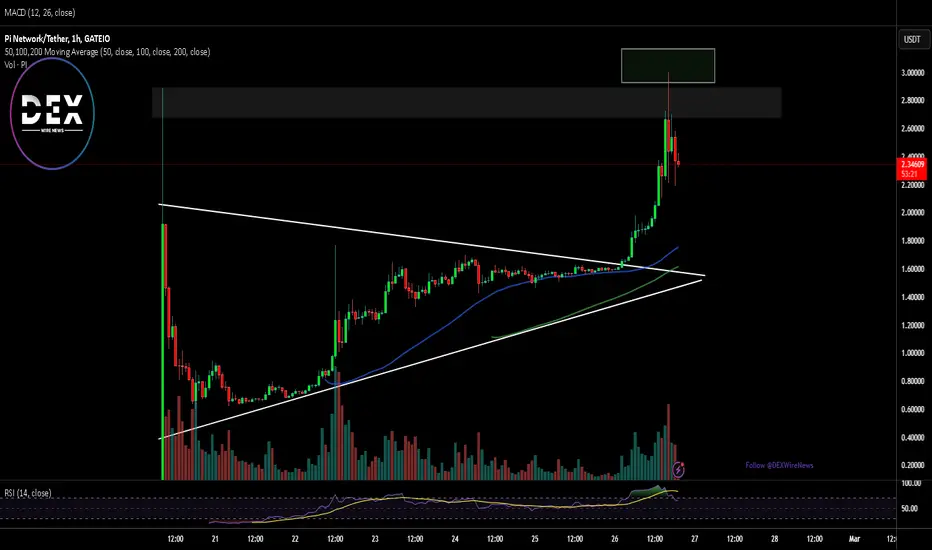
⏳ 4-Hour Timeframe
On the 4-hour timeframe, as you can see, after the launch of this coin, we saw a massive bullish leg, moving from $0.6498 to $2.9304. Currently, the price is undergoing a correction phase.
📊 Volume initially surged during the launch, which is expected, but it has been decreasing during the correction. RSI is also near the 56.08 trigger, and if this level is broken, strong momentum could enter the market.
🔼 The correction has continued to the 0.382 Fibonacci level, and it seems that a range has formed between the 0.382 and 0.236 Fibonacci retracement levels. If the top of this range is broken, we can enter a long position.
📉 If the correction continues, the next important levels are 0.5, 0.618, and 0.786 Fibonacci retracement levels, and we have to see which level the price reacts to.
⏳ 1-Hour Timeframe
On the 1-hour timeframe, we can see price movements in more detail.
🧲 As you can see, after the price hit the $1.6342 low, it has been forming a bullish structure and has now reached the $1.9807 level.
📈 If this level is broken, we can enter a long position. The next resistance level is $2.3479.
💥 The RSI oscillator is in a sensitive zone, and as long as it stays above the 50 level, market momentum remains bullish. However, if $1.8770 is broken, we can enter a short position.
📝 Final Thoughts
This analysis reflects our opinions and is not financial advice.
Share your thoughts in the comments, and don’t forget to share this analysis with your friends! ❤️

Breaking: $PI Surges to $3 Before Retracing Amidst Market DipThe cryptocurrency market witnessed a surprising move as Pi Network ( NASDAQ:PI ) surged past its all-time high of $2.70, reaching an impressive $3 before a sharp retracement brought it back to $2.21. This remarkable 70% surge caught traders and investors off guard, demonstrating the unpredictable nature of the crypto space.
Technical Analysis
At the time of writing, NASDAQ:PI remains up 38.59%, with technical indicators showing a mix of bullish and corrective signals.
The 1-hour RSI sits at 59.47, indicating that buying pressure remains present but is gradually slowing down. The psychological $2 resistance zone has now been decisively broken, which could turn into a new support level. A potential retracement to $1.60, the ceiling of the bullish symmetrical triangle, may occur before another major upward push.
While the initial rally was explosive, the decline in buying momentum suggests a temporary cooldown before the next leg up.
If NASDAQ:PI can hold above $2, it could establish a solid foundation for another attempt at higher price levels. However, if selling pressure continues, the $1.60 level will be a critical area to watch for a rebound.
What’s Next for NASDAQ:PI ?
If bullish momentum returns, NASDAQ:PI could attempt to reclaim the $3 level and push toward new highs. However, if the price continues to decline, $1.60 will serve as a crucial support level before another breakout attempt. Traders should monitor RSI trends, volume shifts, and key resistance zones** for further confirmation of the next move.
With the $2 psychological barrier now broken, NASDAQ:PI ’s price action in the coming days will be crucial in determining whether this was a one-time event or the beginning of a sustained bullish trend.
WULF - Sustainable Bitcoin mining - x3Potential x3 here, good moment to enter.
TeraWulf Inc. is a company focused on sustainable Bitcoin mining. It aims to provide domestically produced Bitcoin powered by 100% zero-carbon energy. The company leverages its expertise in energy infrastructure and cryptocurrency mining to create efficient and environmentally friendly mining operations.
Key Advantages
Sustainable Mining Practices: TeraWulf is committed to using 100% zero-carbon energy sources for its mining operations. This focus on sustainability not only reduces the environmental impact but also positions the company favorably in an industry often criticized for its carbon footprint.
Strategic Energy Partnerships: The company has established partnerships with energy providers to ensure a reliable and cost-effective power supply. This strategic approach helps in maintaining low operational costs and enhances profitability.
Experienced Leadership: TeraWulf is led by a team with extensive experience in both the energy and cryptocurrency sectors. This expertise allows the company to navigate the complexities of the industry effectively and capitalize on emerging opportunities.
Scalability: With plans to expand its mining capacity, TeraWulf is well-positioned to scale its operations in response to increasing demand for Bitcoin. This scalability is a significant advantage as the cryptocurrency market continues to grow.
Market Position: As one of the few companies focusing on sustainable Bitcoin mining, TeraWulf has carved out a niche in the market. This unique positioning can attract environmentally conscious investors and partners.
Overall, TeraWulf Inc. combines sustainable practices with strategic partnerships and experienced leadership to offer a compelling proposition in the Bitcoin mining industry.

Alamos Gold (AGI) Analysis Company Overview:
Alamos Gold NSE:AGI is a mid-tier gold producer with a strong commitment to sustainable mining across North and Latin America. With record production, strategic acquisitions, and high-grade resource expansion, AGI is well-positioned for long-term growth.
Key Catalysts:
Record 2024 Gold Production & Future Growth 📈
AGI reported a record 567,000 ounces in 2024, with a projected 24% increase by 2027.
Magino Mine Acquisition – Boosting 2025-2026 Outlook 🏗️
This acquisition raises 2025-2026 production guidance by 20%, improving AGI’s growth profile.
Island Gold Expansion – High-Grade Drilling Success 🔬
Ongoing resource expansion at Island Gold increases AGI’s future production potential.
Lynn Lake Project – Long-Term Growth Pipeline 🌎
The Lynn Lake gold project, set for 2028, strengthens AGI’s future development outlook.
Investment Outlook:
Bullish Case: We are bullish on AGI above $15.50-$16.00, supported by rising production, strategic acquisitions, and exploration upside.
Upside Potential: Our price target is $32.00-$33.00, reflecting strong operational execution and an expanding resource base.
📢 Alamos Gold—Sustainable Growth in Precious Metals. #Gold #Mining #AGI #SustainableMining

STRIKEPOINT GOLDOTC:STKXF
Great North American Jurisdictions with global tensions and currency debasement. American jurisdictions could prosper.

LITM a lithium penny stock gets momentum LONGLITM is a lithium mining company with operations is Western USA and Canada now getting a
lift as lithium prices are rising. It popped 16% today and hit a screener on volume yesterday.
This is a junior miner compared with LAC and SGML. As such it is more reactive to price. All
indicators confirm the move including the extent of the trend, relative volume spiking and the
RS lines. This is a low float low volume stock.
Accumulation of a low float could precipitate more price action upward quite easily.
As a volatile penny stock LITM is risky. Right now, I see a long trade in a
small position ( < 0.001 of account balance) for the potential gain despite the obvious risk
SL at 10% Targets at 10% 20% (red line pivots to the left-1.2o December to Feb) then 70% (
pivot low March 23) and finally 250% for the runners ( January and July 23 high pivots). Time
will tell. I expect great profit in this swing trade with stratified partial profits and less time
effort in the trend using alerts and notifications. A trailing loss will be employed at 10%
once the trade is over 20% profit.

Caledonia Mining $CMCL - Breaks of Support Lines are a concernI must admit a bit of anxiety, concerning my earlier enthusiasm with regards to the Chart for a favorite Company... Recently, I re-entered a Position in this fine company ... only to watch it continue to break support levels, I've plotted (the Yellow lines). AMEX:CMCL just broke the lowest support line that I could plot (Green line). So, I'll buy it once more at the Pink (ATTENTION!) line; and then, I'm done...

Symmetrical triangle and downward continuationMilitary Metals currently has no clear valuation and is entirely speculative. I like their strategy (buying up antimony properties) but they have a cartoonish website and I get weird vibes from them.
In any case, the chart demonstrates a symmetrical triangle and I predict a continued downward trend in price, potentially bouncing ~30% down or more.
RSI also does not show strength, and volume is tapering down.

VALE: Elliott Wave AnalysisWe're looking at an Expanded Flat correction in Wave 2, with Wave C forming a Complex Corrective ABCDE triangle pattern
After breaking down from the triangle pattern, Wave C is likely to terminate near major support levels (~$7.50-$6).
Implications for Wave (3):
Once Wave (2) concludes, a powerful impulsive Wave (3) is expected, with targets around:
$27-29 (161.8% extension).
~$40 (261.8% extension).
The triangle within Wave C suggests exhaustion of the bearish trend, setting the stage for a multi-year rally.
Based on Vale's goals in producing and expanding on their "energy transition" metals like nickel (currently the second largest nickel miner in the world) and copper, and the demand for EV batteries. It's likely that Vale will benefit.
This is a long projection so Vale will have to execute on all its timelines and goals for production capacity.
Best of luck all.

#ETHWUSDT #1W (ByBit) Descending channel breakoutEthereum PoW regained 50MA weekly support and seems to be in full bullish mode, continuation is on.
⚡️⚡️ #ETHW/USDT ⚡️⚡️
Exchanges: ByBit USDT, Binance Futures, OKX Futures
Signal Type: Regular (Long)
Leverage: Isolated (1.0X)
Amount: 5.0%
Current Price:
3.665
Entry Zone:
3.524 - 2.904
Take-Profit Targets:
1) 5.119
1) 7.030
1) 8.941
Stop Targets:
1) 1.940
Published By: @Zblaba
AMEX:ETHW BYBIT:ETHWUSDT.P #1W #Ethereum #PoW ethereumpow.org
Risk/Reward= 1:1.5 | 1:3.0 | 1:4.5
Expected Profit= +59.3% | +118.7% | +178.2%
Possible Loss= -39.6%
Estimated Gaintime= 3-6 months

TASI-1211: SAUDI ARABIAN MINING COMPANYBullish bias for TASI-1211: SAUDI ARABIAN MINING COMPANY on 4 Dec 2024.
Buy at 50.6 with Stop Loss at 49.
Take profits at 52, 53, 54.5 and 57.

XAUUSD - Mining in China Vs GoldGold is below the EMA200 and EMA50 in the 4-hour timeframe and is moving in its Neroli channel. If the upward movement continues, we can see the limited supply and sell within that range with the appropriate risk reward. The continuation of the gold neroli movement will provide us with the next opportunity to buy it.
Chinese officials have announced the discovery of a huge deposit of high-quality gold ore, estimated to be worth around $83 billion, and may be the largest known deposit of the precious metal in the world.
Chinese scientists have discovered a "supergiant" deposit of high-quality gold ore near some of the country's existing gold mines. This massive deposit, which could be the largest single reservoir of this precious metal remaining anywhere on Earth, is worth billions of dollars.
Representatives of the Geological Bureau of Hunan Province (GBHP) told Chinese state media on November 20 that the new deposits were discovered in the Wangu gold field in northeastern Hunan province. Workers identified more than 40 gold veins containing about 330 tons of gold down to a depth of 6,600 feet (2,000 meters). However, using 3D computer models, mining experts have predicted that as much as 1,100 tons of gold – roughly eight times the weight of the Statue of Liberty – may be hidden as deep as 9,800 feet (3,000 meters). If true, the total reserves are likely to be worth about 600 billion yuan ($83 billion).
Mark Chandler, referring to the poor performance of gold after the recent drop, said: "The price of gold has not yet recovered even half of its decline and remains below the level of $2,663.40. If the U.S. employment report at the end of next week is stronger than expected (with around 200,000 new jobs forecast), speculation about a Fed rate cut in December is likely to ease. This can help strengthen the dollar and interest rates. However, US policies that threaten to derail the international order have encouraged some foreign central banks to continue hoarding more gold.
Employment data will be the centerpiece of the economic calendar next week and is expected to have a significant impact on the direction of markets. This set of reports includes JOLTS job openings on Tuesday, the ADP employment report on Wednesday, weekly jobless claims on Thursday, and the key nonfarm payrolls (NFP) report on Friday. Each of these reports can provide clues about the state of the labor market and the Federal Reserve's future decisions.
Along with these employment data, ISM purchasing managers' indicators are also in the focus of traders' attention. The index of the production sector is published on Monday and the index of the service sector is published on Wednesday. Additionally, the University of Michigan's preliminary consumer confidence index, an important measure of economic sentiment and consumer purchasing power, will be released on Friday.
Wednesday will be a key opportunity for markets to hear comments from Federal Reserve Chairman Jerome Powell ahead of the Federal Reserve's media silence. Powell is scheduled to participate in a moderated conversation at the New York Times DealBook, an event that is likely to provide clues about the Fed's future policy.

#ETCUSDT #1D (Bybit) Descending wedge breakout & retestEthereum Classic regained 50MA support and seems to be heading towards 200MA resistance, probably after a pull-back.
⚡️⚡️ #ETC/USDT ⚡️⚡️
Exchanges: ByBit USDT
Signal Type: Regular (Long)
Leverage: Isolated (3.0X)
Amount: 4.6%
Current Price:
20.620
Entry Targets:
1) 19.256
Take-Profit Targets:
1) 24.837
Stop Targets:
1) 16.459
Published By: @Zblaba
CRYPTOCAP:ETC BYBIT:ETCUSDT.P #1D #EthereumClassic #PoW ethereumclassic.org
Risk/Reward= 1:2.0
Expected Profit= +86.9%
Possible Loss= -43.6%
Estimated Gaintime= 1-2 months

FSM Bull Major opportunityFortuna Silver Mines The chart looks amazing after recent rallies correction. Found support at the Covid break out around $4. Major value with incredible earnings especially with high metal prices that will continue higher and look to make serious gains even further as global currency devaluation accelerates. The bull story here is incredible as we slowly chop sideways building energy for a stark move to the upside. NYSE:FSM
