MKRIf Bitcoin loses its support, this currency can also test its low support.
This currency is also a good place to buy a ladder.
MKR

MKR - Potential Bullish Reversal!Hello everyone, if you like the idea, do not forget to support with a like and follow.
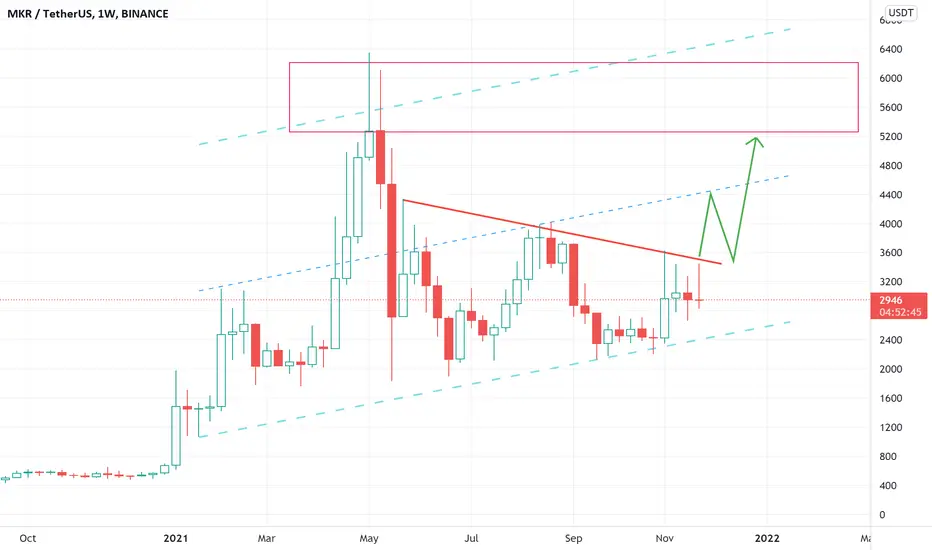
MKR is sitting around a strong support zone in green so we will be looking for buy setups.
on DAILY: MKR is forming a trendline in red but it is not valid yet, so we are waiting for a new swing high to form around it to consider it our trigger swing. (projection in purple)
Trigger => Waiting for that swing to form and then buy after a momentum candle close above it (gray zone)
Meanwhile, until the buy is activated, MKR would be overall bearish can still trade lower till the lower green support before going up.
Good luck!
All Strategies Are Good; If Managed Properly!
~Rich

MKR possible countMKR looking to have finished a 4th wave correction in the form of an ABCDE triangle. confirmation upon breaking upwards out of the triangle. invalidation if we break below swing low


Short MKRUSDTshort MKRUSDT
I will enter this trade after a breakdown of 1980 zone
Entry trigger 4H close below 2000 zone
1st target 1720 zone
2nd target 1540 zone
Invalidation daily close above 2600


MKRUSDTThis chart is very boring and as you can see move very slowly
I hope in long-term investment it can achieve the set target.
what is your opinion ?
This is a personal analysis and not an investment signal.
Thank you for your support
IF you can Follow me on other Social Media.
be happy

MKRUSDT - SETUPMKRUSDT price is breaking up the ceiling area where two resistances a zone and a trendline lies. The only hurdle is FIB LEVEL 61.8%. If bulls successfully break this level then can pull this price easily towards 3300 followed by 3350. And if this fib level works as a resistance we could see a sell-off towards 3100 followed by 3300. Good Luck!


MKRUSDT breakout is nearFellow traders.
Here is the channel MKRUSDT is moving inside. A break and close above resistance line (red one) indicates a breakout. After retest, first target could be a range near current ATH.
If you enjoyed this analysis, please share it and let me know what you think in comments bellow.
Cheers.
MAKER Price At Trend line SupportMaker price at trend line support if price make bounce from here than it will explode bigger

MKRUSDT Technical Analysis💎 MKRUSDT has broken above the major resistance and also the symmetrical triangle. After the pullback the price will continue the bullish move
🌐 Tradingview
💵 Invest Only 5% of your Portfolio
🎳 Entry/Pullback now or from 3427 - 3188
☕️ TP1 3631
🍺 TP2 3968
🍻 TP3 4327
🍾 TP4 4672
🍷 TP5 5000
🚫 SL 3188- 2945
Good Luck 🎲
Check the Links in Description and if you LIKE this analysis, please support our page and Ideas by hitting the LIKE 👍 button. ❤️ Your Support is really appreciated! ❤️
Traders, if you have your own opinion about it, please write your own in the comment box. We will be glad for this.
Feel free to request any pair/instrument analysis or ask any questions in the comment section below.
We will have more FREE forecasts in TradingView soon
Have a profitable day 😊👍🏻

💡Don't miss the great buy opportunity in MKRUSD @makerdao
Trading suggestion:
". There is a possibility of temporary retracement to the suggested support line (3146).
. if so, traders can set orders based on Price Action and expect to reach short-term targets."
Technical analysis:
. MKRUSD is in a range bound, and the beginning of an uptrend is expected.
. The price is above the 21-Day WEMA, which acts as a dynamic support.
. The RSI is at 74
Take Profits:
TP1= @ 3439
TP2= @ 3732
TP3= @ 3990
TP4= @ 4244
TP5= @ 4956
SL= Break below S2
❤️ If you find this helpful and want more FREE forecasts in TradingView
. . . . . Please show your support back,
. . . . . . . . Hit the 👍 LIKE button,
. . . . . . . . . . Drop some feedback below in the comment!
❤️ Your support is very much 🙏 appreciated! ❤️
💎 Want us to help you become a better Forex / Crypto trader ?
Now, It's your turn !
Be sure to leave a comment; let us know how you see this opportunity and forecast.
Trade well, ❤️
ForecastCity English Support Team ❤️

MKR - Bullish Takeover 🔥From our last analysis on MKR, we had a really nice breakout and then created a bullish correction for a move higher.
The play here it to wait for the next bullish correction which will likely come back to the ascending trendline and then entry with stops below the trendline. However, if you want to enter now, you can look for lower timeframe pullback and then enter with stops below 61.8 fibonacci.
There's enough room for MKR to move up and we're targeting atleast 6000.


MKRUSDTHello Crypto Lovers,
Mars Signals team wishes you high profits.
We are in a 4-hour time frame.
As you can see, the price has started to move upwards after hitting the support line and is fluctuating below the resistance line.
If the resistance line breaks and the price stabilizes above it, then it can touch our target.
Warning: This is just a suggestion and we do not guarantee profits. We advise you analyze the chart before opening any position.
Wish you luck

💡Don't miss the great buy opportunity in MKRUSD @MakerDAOTrading suggestion:
". There is a possibility of temporary retracement to the suggested support line (2796).
. if so, traders can set orders based on Price Action and expect to reach short-term targets."
Technical analysis:
. MKRUSD is in a range bound, and the beginning of an uptrend is expected.
. The price is above the 21-Day WEMA, which acts as a dynamic support.
. The RSI is at 52.
Take Profits:
TP1= @ 3109
TP2= @ 3286
TP3= @ 3448
TP4= @ 3625
TP5= @ 3796
SL= Break below S2
❤️ If you find this helpful and want more FREE forecasts in TradingView
. . . . . Please show your support back,
. . . . . . . . Hit the 👍 LIKE button,
. . . . . . . . . . Drop some feedback below in the comment!
❤️ Your support is very much 🙏 appreciated!❤️
💎 Want us to help you become a better Forex / Crypto trader?
Now, It's your turn!
Be sure to leave a comment; let us know how you see this opportunity and forecast.
Trade well, ❤️
ForecastCity English Support Team ❤️

💡Don't miss the great buy opportunity in MKRUSD @MakerDAOTrading suggestion:
". There is a possibility of temporary retracement to the suggested support line (2796).
. if so, traders can set orders based on Price Action and expect to reach short-term targets."
Technical analysis:
. MKRUSD is in a range bound, and the beginning of an uptrend is expected.
. The price is above the 21-Day WEMA, which acts as a dynamic support.
. The RSI is at 52.
Take Profits:
TP1= @ 3109
TP2= @ 3286
TP3= @ 3448
TP4= @ 3625
TP5= @ 3796
SL= Break below S2
❤️ If you find this helpful and want more FREE forecasts in TradingView
. . . . . Please show your support back,
. . . . . . . . Hit the 👍 LIKE button,
. . . . . . . . . . Drop some feedback below in the comment!
❤️ Your support is very much 🙏 appreciated! ❤️
💎 Want us to help you become a better Forex / Crypto trader ?
Now, It's your turn !
Be sure to leave a comment; let us know how you see this opportunity and forecast.
Trade well, ❤️
ForecastCity English Support Team ❤️

MKRBTC Technical Analysis⏳ Spot
💎 MKRBTC has formed a symmetrical triangle and after breaking above the resistance the price ranged. It might go lower for a pullback then continues the Bullish move
🌐 Tradingview
💵 Invest Only 5% of your Portfolio
🎳 Entry/Pullback now or from 0.05024 to 0.04525
☕️ TP1 0.05450
🍺 TP2 0.06339
🍻 TP3 0.07401
🍾 TP4 0.08480
🍷 TP5 0.09500
🍸 TP6
🍹 TP7
🎁 TP8
🚫 SL 0.04525 to 0.04072
Good Luck 🎲
Check the Links in Description and if you LIKE this analysis, please support our page and Ideas by hitting the LIKE 👍 button. ❤️ Your Support is really appreciated! ❤️
Traders, if you have your own opinion about it, please write your own in the comment box. We will be glad for this.
Feel free to request any pair/instrument analysis or ask any questions in the comment section below.
We will have more FREE forecasts in TradingView soon
Have a profitable day 😊👍🏻

MKRUSDT Technical Analysis
⏳ Spot
💎 MKRUSDT has formed a symmetrical and descending triangle. After several rejections at the bottom at the support line we need to wait for the breakout and see the pump
🌐 Tradingview
💵 Invest Only 5% of your Portfolio
🎳 Entry/Pullback now or from 3092 to 2886
☕️ TP1 3226
🍺 TP2 3622
🍻 TP3 4089
🍾 TP4 4500
🍷 TP5
🍸 TP6
🍹 TP7
🎁 TP8
🚫 SL 2886 to 2710
Good Luck 🎲
Check the Links in Description and If you LIKE this analysis, Please support our page and Ideas by hitting the LIKE 👍 button. ❤️ Your Support is really appreciated! ❤️
Traders, if you have your own opinion about it, please write your own in the comment box. We will be glad for this.
Feel free to request any pair/instrument analysis or ask any questions in the comment section below.
We will have more FREE forecasts in TradingView soon
Have a profitable day 😊👍🏻

MKRUSDT (1D) OUTLOOKEDUCATIONAL PURPOSE ONLY 🤬🤬🤬
MKR has been trading between 3986 and 1893 range since June 2021. Having broken out of a prevailing structure within this range, i want to see price drop to 2633 -2200 range before i make a move to buy the coin for a quick target at 3986 area.
Remember that price have tested this 3986 (EQH) level for 3x hence i expect a quick drop from there to 1900/1750 area which will the best point to buy in for a long term holding.
I will update here is price structure changes.
PLEASE LIKE, COMMENT AND FOLLOW ME TO ENCOURGAE MORE INSIGHTS

mkr bullish zone!!!See what we have here :)
mkr was able to break and stabilize the downtrend line.
It is in a low risk area. And can see the targets.

₿ MKRUSDT 1D ₿ : 12.Nov.2021#MKR has reached a good support range again ... Keep an eye on MKR ...
Follow our other analysis & Feel free to ask any questions you have, we are here to help.
⚠️ This Analysis will be updated ...
👤 Arman Shaban : @Ar_M_An_4
📅 12.Nov.2021
⚠️(DYOR)
