Gold LongsFollowing last weeks bias. Looking for REQH target.
Want to pair longs with a weekly profile. Ideally Monday or Tuesday creates the low of week. Will look to get onside with longs once theres a clear intraweek reversal. Trade the continuation higher. A close below 3320 is invalidation. Expecting previous week low to be protected and expansion to the upside
Mmxm

Euro LongsI've been waiting for euro to reach discount of its daily range and deliver into a daily BISI.
Mon - Wed trade lower into key arrays. Intraweek reversal confirmed with 4h and 1h CISD. Paired with Pound SMT at the daily lows.
LRLR built up from last weeks pullback. That bsl looks too obvious to me.
Entering off 1h cisd at 1.16650. Stop at Wednesday low. Targeting manipulation leg STD levels and relative equal highs at 1.19045
If the weekly draw on liquidity is to the upside, this intraweek reversal will hold. I know im wrong on direction if Wednesday low doesnt hold. The framework and logic line up with what I look for. Midweek Reversal daily profile. Thursday continuation in play.

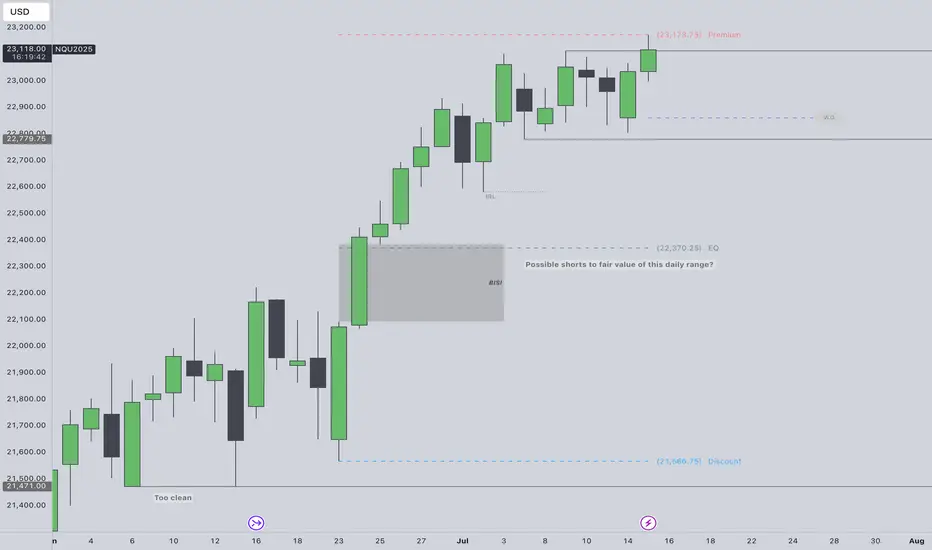
To fade all time highs or not?Not trying to fade ATH run but the SSL in this daily range looks too obvious to me. Super premium.
Price was in a consolidation July 7th - 14th. Took external range high today. I really could see shorts playing out if theres a intraweek reversal confirmed after purging the ERH.
Would need to see 1h CISD confirm intraweek reversal to the downside then trade the daily continuation lower targeting 22,779, 22,578 & EQ of the range at 22,370. Also, the daily BISI that needs sellside delivery.
CPI scheduled this week. PPI following.
Gold LongsSolid daily structure for Gold heading into the holiday weekend. Bullish going into next week if price closes bullish on the week.
Daily discount SSL swept and closed back inside the range on Monday. Daily OB confirmed on Tuesday. FVG created and inversion fvg confirmed on Wednesday.
Anticipating Thursday to possibly pull back and offer a prime continuation to the upside. I'd like to see the inversion be respected. Price can wick into the BISI but I don't want to see price close below the BISI. That's a red flag.
Targeting Equal Highs.

Copper LongsBullish Bias for copper. Looking for daily BPR target, then possibly relative equal highs.
Ideally would like to pair a bullish weekly profile with longs. If the week opens lower first and delivers to a key level, thats favoring longs. So looking for Monday, Tuesday or Wednesday to create the low of the week.
I see a daily MMBM in play. Price expanded off the breaker block. If bsl is the dol, price should expand hard of EQ of the range.

Gold LongsBullish weekly bias for Gold.
Classic Expansion Weekly profile in play. Price opened lower first, Im treating this as the possible manipulation for the week. Tuesday swept key ssl and closed back inside the range.
Drop to a 4h and OB is confirmed. 1h CISD aligned with 4h. Execution off 4h OB with stop at OB Low / Tuesday low. If BSL is the draw, I would like to see Tuesday low be protected.
LRLR is first low hanging fruit objective. 3420 roughly, with equal highs at 3476 being final target.

OIL Bullish BiasCurrently sitting on my hands but closely watching oil, especially after Iran & Israel
Consolidation Protocol active. Need to see external range taken. I will not trade inside this range. Favoring longs.
Think accumulation, manipulation, distribution. Right now its in the accumulation phase. Manipulation phase is next. Preferably sweeping external low first then distribution higher to bsl.
Relative equal highs / LRLR at 114.29 first long term target.
Final target are the inefficiencies at 130 - 150.

Nasdaq Bullish Speed is expected.Nasdaq (and indexes) are expected to rally with speed after FED release and perform towards the target 22,250.00.
We're going to allow for potential wicks lower on FED release though.


NQ! Short Idea (MMXM, Quarterly Theory) LONDON REVERSALHello everyone, today you will see my current Short Idea on the Nasdaq. I want to see the reaction of the 15M OB that we are sitting in, if we show Disrespect of that Area, I will be looking for Shorts.
Praise be to God
-T-

$XAUUSD IdeaWhen analyzing gold, we observe a monthly chart with a bullish structure. However, the monthly candle left a low without an apparent wick, which may indicate a region to be liquidated in the future.
On the weekly chart, the asset confirmed a break in structure, reinforcing the continuation of the bullish movement. On the daily timeframe, we identify a possible CRT formation, suggesting that the price might correct to seek liquidity in a discounted region before resuming its bullish trend.
Based on this analysis, our main Draw on Liquidity are the PDL and the CRT low, which coincide with an FVG in the discounted zone. This could be the region where the price finds support to continue its upward movement.
On the 1H chart, we identify a formed range and are focusing on a key level in the premium region. On the 15M timeframe, we observe an order pairing that aligns with the 1H key level, making it a potential reaction point for a sell-off. This could be the ideal area to look for short trades. For stronger confirmation, it would be ideal to see an SMT with silver during this mitigation.
It is important to note that this is only an initial projection. The true confirmation that the price will hold in this FVG will depend on the market’s reaction upon reaching this zone.

$DXY IdeaFor the DXY, on the monthly chart, we remain in a consolidation bias, as the price is trapped within a range formed by two FVGs. However, when analyzing the yearly candles, we notice a macro bearish bias, since the 2025 candle has swept the 2024 high and is now targeting the annual lows.
Since we trade intraday, it is essential to analyze other timeframes to confirm a trading bias. On the weekly chart, we observe that last week's candle swept the previous week's low and closed within the range, indicating a potential correction. This makes sense, as the DXY has extended significantly in recent weeks and is currently discounted, which may lead the price to a premium zone before resuming its downtrend, in line with our macro bias.
Additionally, based on the economic calendar, there is a possibility that the weekly low will be formed on Monday, which could create an opportunity for a counter-trend trade at the beginning of the week. However, this type of trade carries high risk, requiring caution and confirmation before entry.
For this week, we are looking for bullish opportunities up to equilibrium or until the price shows resistance to continue rising. However, this initial outlook will only be confirmed as price action develops throughout the week.
It is also important to note that this will be a challenging week, due to a lack of significant news events and a Federal Reserve speech on interest rates, which could significantly impact the market and increase volatility.

| ETHUSDT | Short term counter trend moveThis setup presents itself with a higher timeframe bearish framework on a higher timeframe bullish trend. So I would like to see the price reach the range equilibrium to liquidate sell stops from long holders' trailing stops.

$MSTR Time to Buy?Hello Friends,
For those of you looking to capitalize on Microstrategy NASDAQ:MSTR you may want to add to your position, or start accumulating for the first time.
After an impressive move to the upside, we can now feel confident to look for entries after that retracement.
Keeping with the Bullish narrative of CRYPTOCAP:BTC we can assume NASDAQ:MSTR will once again see another projection higher back to its ATH (All Time High) of $543.

ETHUSDT | Midweek AnalysisAt the beginning of the week, the price failed to take higher timeframe buyside liquidity and made a run to the low of the previous week.
Market Maker buy model framework.
I would expect the price to reach target 1, perhaps tomorrow with the PPI.
Next week we have Federal Funds Rate, so we could also see some consolidation the day before.The analysis is valid until then.

ADAUSDT Market Maker Buy ModelMarket maker buy model framework 12h. We'll see what happens tomorrow with the NFP volatility injection.

long idea
Long swing trade idea. From the lows several weeks to materialize. pulled off the low with speed

Bitcoin viewcrypto always pull some goofy moves to us, and we either open our eyes to these candles or our a$ to the market :skull:
I don't post much cuz i'm research on my new model, hope this cup and handle(:skull) model can help you guys form your bias about btcusd(t)
peace

EURNZD: Buy Opportunity
Well, as you can see, the price hit the daily bullish FVG in deep discount and cleared the sell-side liquidity. Here in the hourly chart, we know the market structure shifted and we are bullish now.
Now we are on the buy side of the curve so we expect the price to stay above the key level and respect the bullish PD Arrays, like Order block and FVG that you can see on the chart.
We need LTF confirmation for entry.
💌It is my honor to share your comments with me💌
🔎 DYOR
🗓️06/06/2024
💡Wait for the update!

ICT's Market Maker Model - An Easy to Understand GuideIn this video I try to explain ICT's Market Maker Model as simply as I can.
This model basically depicts how smart money efficiently facilitates their positions in the marketplace. It is important to understand some concepts beforehand, such as liquidity, AMD/PO3, market efficiency, crowd mentality, and the fractal nature of price.
I hope you find the video insightful and that it helps you utilize Market Maker Models in your trading.
- R2F

GBPUSD POTENTIAL SHORTHi Traders, Looking on a GBPUSD we can see price respects our monthly IRL, then shoots down leaving an imbalance on our daily time frame, as it takes out our ERL and giving us a clear MSS, so we will look for entry properties on our H1 time frame on the daily FVG/IRL.
Best Of Luck
CharlesFX

NZDJPY Market Insight as of April 14, 2024- IRL to ERL
- Expecting a Bullish move to Mitigate SIBI and then overall I am seeing a Bearish Price action
- If one pair either NJ or AJ will not mitigate this SIBI , I will expected an Intermediate SMT will form which also signals a higher probability Bearish Condition
- HTF and LTF MMSM
- SMT w/ AJ

AUDJPY Market Insight as of April 14, 2024- IRL to ERL
- Expecting a Bullish move to Mitigate SIBI and then overall I am seeing a Bearish Price action
- If one pair either NJ or AJ will not mitigate this SIBI , I will expect an Intermediate SMT to form which also signals a higher probability Bearish Condition
- HTF and LTF MMSM
- SMT w/ NJ
