BERA Defies Market Trends, Eyes 160% Surge Amid Bullish MomentumIn a market facing significant volatility, BIST:BERA has emerged as a top-performing Layer 1 (L1) blockchain coin, surging 13% in 24 hours and inching closer to its all-time high (ATH) of $15.20. With a resurgence in buying pressure, increased spot inflows, and a strong technical outlook, BIST:BERA is positioning itself for a remarkable recovery.
Why is BIST:BERA Pumping?
- Strong Buying Pressure: The Chaikin Money Flow (CMF) indicator stands at 0.04, signaling bullish inflows.
- Capital Movement: After witnessing $2.6 million in outflows, BIST:BERA has now recorded $316K in fresh spot inflows, indicating renewed investor interest.
- Investor Sentiment: Holders are choosing to accumulate rather than sell, reinforcing long-term confidence in the asset’s value.
Moby Expands to Berachain, Strengthening Its DeFi Ecosystem
A pivotal development for the Berachain ecosystem is the launch of Moby, the No.1 options protocol on Arbitrum, on the Berachain Mainnet. Moby has facilitated over $3.5 billion in total trading volume and is now set to transform on-chain derivatives trading within the Berachain network.
Berachain distinguishes itself as an EVM-identical Layer 1 blockchain that operates on the revolutionary Proof of Liquidity (PoL) consensus mechanism. Unlike traditional Proof-of-Stake (PoS) networks, PoL embeds liquidity provisioning directly into the security model, ensuring that validators, applications, and users benefit from a seamless and capital-efficient ecosystem.
Moby’s selection for Berachain’s prestigious Request for Application (RFA) program signals its critical role in the ecosystem. The protocol has also forged key partnerships with Kodiak, Infrared, PumpBTC, and GMX, further expanding its influence in DeFi.
Technical Outlook: BIST:BERA ’s Bullish Setup
At the time of writing, BIST:BERA is up 4%, ranking among the top-performing altcoins of the week. Despite a 65% decline from its listing price, key indicators suggest that BIST:BERA could be on the verge of a substantial breakout:
- Relative Strength Index (RSI) at 65: Holding strong, indicating sustained momentum without being overbought.
- Falling Wedge Pattern: A classic bullish reversal pattern, hinting at an imminent uptrend.
- Potential 160% Surge: BIST:BERA could aim to reclaim its previous ATH of $15.20, presenting a significant upside opportunity.
Conclusion
With a combination of **strong technical indicators, surging capital inflows, and an expanding DeFi ecosystem**, BIST:BERA is well-positioned for a significant rally. As the asset gains traction, traders and investors should closely monitor its price action, as the next leg up could be the most explosive yet.
Will BIST:BERA reclaim its ATH and set new records? The market is watching, and the momentum is undeniable.
MOBIL

XOM has shown a consolidation patternXOM has shown a consolidation pattern
This chart shows the weekly candle chart of ExxonMobil's stock in the past 4 years. The graph overlays the bottom to top golden section at the beginning of 2020. As shown in the figure, ExxonMobil's stock has shown a consolidation pattern of high to strong overall after completing a small level double top at the beginning of this year! The small double top of ExxonMobil's stock at the beginning of this year was suppressed by the 3.618 level of the gold split at the bottom of the graph, and did not touch any strong support level for the low point of the pullback thereafter! So, in the future, the stock market of ExxonMobil is likely to weaken and continue to retreat towards the downside!

Exxon Mobil Analysis 28.12.2022Hello Traders,
welcome to this free and educational analysis.
I am going to explain where I think this asset is going to go over the next few days and weeks and where I would look for trading opportunities.
If you have any questions or suggestions which asset I should analyse tomorrow, please leave a comment below.
I will personally reply to every single comment!
If you enjoyed this analysis, I would definitely appreciate it, if you smash that like button and maybe consider following my channel.
Thank you for watching and I will see you tomorrow!
You can also check out my previous analysis of this asset:

Exxon Mobil Analysis 10.12.2022Hello Traders,
welcome to this free and educational analysis.
I am going to explain where I think this asset is going to go over the next few days and weeks and where I would look for trading opportunities.
If you have any questions or suggestions which asset I should analyse tomorrow, please leave a comment below.
I will personally reply to every single comment!
If you enjoyed this analysis, I would definitely appreciate it, if you smash that like button and maybe consider following my channel.
Thank you for watching and I will see you tomorrow!

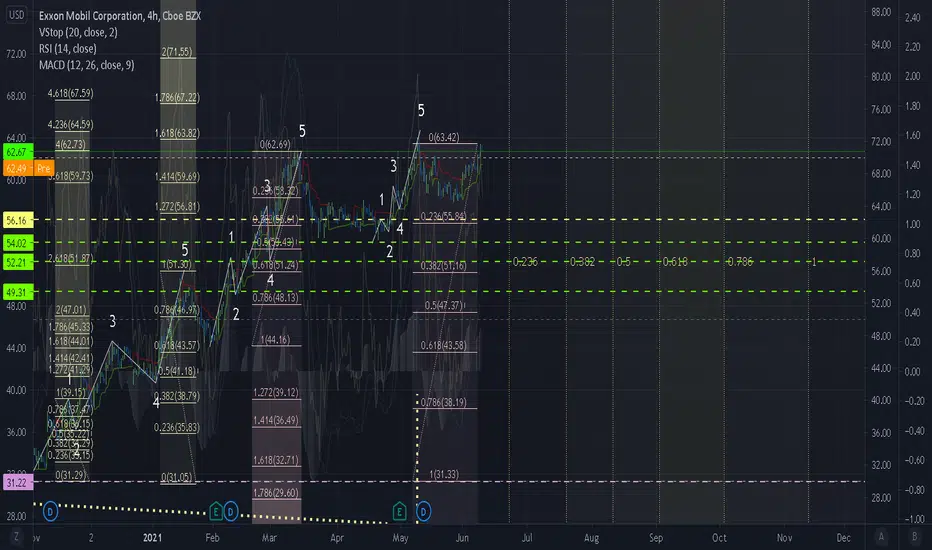
Exxon Mobil at the end of Impulse? XOMThe picture is not 100% clear, but we are query if this might be it for XOM. It is possible at this stage to have a relatively shallow pullback, to only start rising again. At this stage, it is looking quite likely that we might be meandering locally for a period of time. Markets cannot be timed.
Remember that this is not financial advice and that we are not responsible for your portfolio. Only you are. You must do your own research and remember to act in accordance to your own research. That aside, Fibonacci goals are as ever in green and invalidation is in red. Take care of yourselves out there.
Mobile Telecom Strog BuyAfter first false retest of resistence in the red arrow, you can see two strong bullish candle broke the resitence to go up and find the 13.2 level
