First Wave BioPharma $40 PT Upside potentialBefore the close of the year the Bio Pharma Sector started running wild. It doesn't surprise me why i'm drawn to this company with all the catalysts coming out. Recently with a PT 40 From Roth MKM.
The more you read about the news that comes from this company between CEO investor relations, Merger Deal with Immunogen and entering their phase 3 trial there is so much Upside potential.
Although short term there's a lot of turbulence in the 5.00-5.38 range if it can break and hold strong this stock can get there pretty quick.
Currently holding a Long position.
Trade Responsible,
#TradeTheWave 🏄🏽♂️🌊
Momentumstrategy

BWXT: added to our 'Momentum, Growth & Innovation'-PortfolioBWXT has been added as a new trade to our 'Momentum, Growth & Innovation'-Portfolio with 10% of total equity.
Here is a detailed analysis of the trade:
Technical Observations:
BWXT is fluctuating above its 50-day and 200-day moving averages, which suggests an overall bullish trend. The Bollinger Bands indicate a range where the stock has been trading, with recent price action closer to the lower band, potentially offering a good entry point as per Minervini's strategy.
Volume and Price Action:
The volume seems to be lower on down days, which could indicate a lack of seller conviction. This can be seen as a positive sign if you're looking for a potential upward movement.
Relative Strength Index (RSI):
The RSI is not in the overbought territory, which means there could be room for upside before the stock is considered overbought.
Fundamental Factors: The market capitalization of $7.04B and a dividend yield of 1.19% suggest a stable company. A P/E ratio of 31.74 is on the higher side, indicating investors may expect higher earnings growth. The earnings per share (EPS) of $2.43 is a critical figure for evaluating the company's profitability.
Growth and Profitability: The fundamental slide indicates the company’s performance in terms of revenue, net income, and net margin percentage. It appears there has been some volatility in net income margins, which could be a risk factor.
Here is a link to the fundamental data of this trade:
www.tradingview.com
Position Sizing:
Using 10% of your equity for this trade aligns with the concept of position sizing, which is critical in Minervini's strategy. It's essential to manage this position carefully and be ready to cut losses if the trade goes against the expected trend.
2) Summary of Minervini Trading Strategy
Trend Template: Minervini emphasizes stocks in a strong uptrend, above key moving averages, and showing outperformance against the market.
Volatility Contraction Pattern (VCP): He looks for stocks that have gone through periods of price contraction on lower volume, indicating potential for a breakout.
Relative Strength: The stock should be one of the market leaders, with a high relative strength rating.
Risk Management: Minervini is strict about cutting losses quickly to preserve capital. He advises setting a stop loss at the point where the original trade thesis is invalidated.
Entry and Exit Points: He advocates for entering trades as they break out from sound base patterns on higher volume, and exiting based on specific sell rules to capture the bulk of a stock’s advance without giving back significant gains.
Fundamental Analysis: While Minervini is a technical trader, he also considers strong fundamentals as a backbone for a stock's potential to succeed, looking for companies with strong earnings growth, return on equity, and profit margins.

StrongBuy #SKFINDIA#StrongBuy #SKFINDIA.
Don't miss this Opportunity.
StrongBuy Candidate. #Stock made Higher high in Monthly and Weekly Timeframe. Now in Best #Retracement point with Strong #Priceaction confirming Reversal.
Buy and Hold for Swing and Shortterm targets.
Follow Risk reward and Stoploss 🛑

+15.6% in November: Harnessing the Power of Minervini's StrategyThis November, my 'Growth, Innovation & Momentum' portfolio is up by more than 15%.
I embarked on a fascinating journey in the world of stock trading, closely following Mark Minervini's esteemed trading strategies. Minervini, a renowned stock market wizard, is famous for his SEPA (Specific Entry Point Analysis) methodology, a combination of technical analysis and risk management. As I navigated through the dynamic landscape of the stock market, I applied these principles, aiming to optimize my swing trading approach. Today, I'm excited to share with you a detailed analysis of my portfolio's performance.
The Core of Minervini's Strategy
Mark Minervini's strategy revolves around identifying stocks with strong potential before they make their significant upward moves. The key elements of his approach include:
Trend Template: Minervini focuses on stocks in a strong uptrend.
Risk Management: He emphasizes strict stop-loss orders to minimize losses.
Volume Analysis: Volume spikes on up days are a positive sign.
Entry Points: Entering at specific points to maximize gains while minimizing risks.
My Portfolio Performance: A Deep Dive
Overview
Overall Performance: +15.6%
Total Winners: 27 trades
Total Losers: 13 trades]
Batting Average: 67.5%
Key Takeaways
Winning Edge: A batting average of 67.5% signifies a robust strategy in picking winners, aligning with Minervini's emphasis on stock selection.
Entry and Exit Strategies
Following Minervini, I aimed for precision in entry and exit points. I sought stocks showing signs of breakout with high trading volumes, entering positions during their early upward trend phases. For exits, I set strict stop-loss levels, though I'm looking to refine these further.
Risk Management
Risk control is a cornerstone of Minervini's method. I maintained a disciplined approach to stop-loss orders, though my average loss suggests a need for tighter control. Moving forward, I plan to implement more stringent risk assessment techniques.
Stock of the Month: Vertex
On Dec 13th, Vertex jumped by a whopping +13.2% following encouraging news regarding the Opinion for Sickle Cell Disease Therapy From European Committee for Medicinal Products for Human Use.
Here is the link to my current portfolio:
www.tradingview.com

GMTUSDT LONG 1HTHIS IS NOT A FINANCIAL ADVICE
Conditions
1.Fibonacci level:✅
2.Bollinger band:✅
3.Momentum:✅
4.Price action:✅
5.Volume:✅
6.1h tf:✅
7.4h tf:✅
8.1d tf:✅

Buy Ptc Industries @6200. Best buy @ 6200-6300.
target 15000 -30k in a year.
a bottom has completed and high volume bounce can be seen on chart today.

Rinse and Repeat Simple Intraday Momentum Trading StrategyI illustrate my simple short term USA session strategy and also talk about the importance of the USA session when it comes to trend changes and daily bias changes
As always, these are the main steps:
Identify an intraday directional bias
Identify the key levels
Identify trade entry triggers
Manage the trade with attention to "Actual Risk"

Weekly Momentum Scalping Strategy RECAP | Nov 27 - Dec 1Hey guys, join me for a refresher of last week's trading.
The goal of this video is to reaffirm our simple and effective US session scalping strategy with the following steps:
Identify an intraday directional bias
Identify the key levels
Identify trade entry triggers
Manage the trade with attention to "Actual Risk"
Additionally, how to avoid bad setups with the strategy
Thanks for watching

The Power of the 30 MIN Chart for Intra-day ScalpingIn this to-the-point walk-through I'm letting you guys in on this super simple scalping strategy which took me years to boil things down to. Let's dive in!

Infy - Retest, Basing, Momentum- Restest of 1st Trendline
- 0.5 retracement of the first wave
- Strong Momentum
- Enter Between 1500-1520, SL- 1420, T1- 1670, T2- 1820
- Major Resistance - Related to the event, Breakdown from base & Gap Down

Momentum, Growth and Innovation: RHMWe have just added a new position (RHM) to our 'Growth, Momentum and Innovation' portfolio with 11% of total equity.
Here is the link to our updated portfolio, which is up > 18% in the last month:
www.tradingview.com
Technical Analysis According to Minervini’s Principles
Trend: Rheinmetall's stock should be evaluated against the major moving averages. Minervini looks for stocks trading above their 50-day and 200-day moving averages to indicate an overall uptrend. If RHM is above these averages and they are sloped upwards, it aligns with Minervini’s criteria for a bullish trend.
Price Action: Minervini favors tight price action and volatility contraction. It's key to look for lower volatility and tighter price consolidation before the breakout. This can be seen in the narrowing of the Bollinger Bands or a decrease in daily price range. If your entry corresponds with a breakout from such a consolidation with a definitive move above resistance, this is in line with Minervini’s strategy.
Volume: Volume is critical in confirming breakouts. For Minervini, an ideal entry is accompanied by a significant increase in volume, indicating strong institutional buying. If the entry day shows higher volume compared to previous days, particularly if it is 40-50% above the average, it validates the trade entry.
Relative Strength: Minervini often emphasizes the importance of relative strength, especially in a weak market. If RHM is outperforming the market and its peers, that would be a positive sign.
Entry Point: A proper entry is at the breakout from a sound base pattern. If RHM is breaking out from such a base, ideally after a period of price contraction, and doing so on higher volume, it would be considered a good entry point.
Risk Management: Setting a stop loss is crucial. Minervini typically sets stop losses just below the breakout point or a recent swing low to minimize potential losses.
Background Information on Rheinmetall AG
Rheinmetall AG is a significant player in the automotive and defense industries. They are known for:
Defense: Producing military vehicles, weapons, ammunition, and electronics. They are often involved in large contracts with governments around the world.
Automotive: Supplying engine systems, pumps, pistons, and other automotive parts to the commercial vehicle and passenger car markets.
Market Position: As a leading defense contractor and automotive supplier, Rheinmetall has a strong market position in Europe and significant international presence.

Momentum, Growth and Innovation: NVDAWe have just added a new position (NVDA) to our 'Growth, Momentum and Innovation' portfolio with 11% of total equity.
Here is the link to our updated portfolio, which is up > 20% in the last month:
www.tradingview.com
Here is a more detailed analysis of this trade:
Technical Analysis
Trend: NVDA has been in a general uptrend, as indicated by the price being above the major moving averages (50-day, 100-day, 200-day), which are also sloping upwards.
Moving Averages: The stock is currently trading above its short-term moving average (50-day) but there appears to be a slight pullback, which could be seen as a buying opportunity in an uptrend, as per Minervini's trend following strategies.
Volume: There's been increased trading volume on up days, suggesting strong buying interest. According to Minervini, higher volume accompanying price advances is a positive sign.
Relative Strength Index (RSI): The RSI is not in an overbought territory (below 70), which could indicate that there is still room for upside before the stock becomes overextended.
Moving Average Convergence Divergence (MACD): The MACD line is above the signal line but starting to converge, indicating potential for a change in momentum. However, as long as the MACD remains above the signal line, it is typically considered bullish.
Support/Resistance: The stock has recently bounced off a support level and is making its way towards a potential resistance area. The pullback to the support could be part of a "high tight flag" pattern, which Minervini finds favorable.
Price Action: The recent price action has formed what appears to be a consolidation pattern after a strong uptrend, which may be indicative of a pause before a continuation of the trend.
Background Analysis
Market Conditions: Mark Minervini advocates trading in sync with the overall market. If the market indices are in a confirmed uptrend, individual stock trades like NVDA are more likely to succeed.
Earnings and Fundamentals: NVDA is known for its strong market position in graphics processing units (GPUs) and its expansion into areas like artificial intelligence, autonomous driving, and data centers.
Sector Performance: NVDA is part of the technology sector, and its performance is often tied to the tech industry's overall health. A bullish sentiment in the tech sector can contribute to individual stock success.
Risk Management: Following Minervini's risk management rules, it's essential to have a predetermined stop loss to protect capital. The trade should also be sized appropriately, not risking more than a small percentage of the trading capital on any single trade.
Entry Point: According to Minervini's strategy, this entry is considered a pullback entry which further reduces the risk of this trade.

MOMENTUM, GROWTH & INNOVATIONUpdated Watchlist:
www.tradingview.com
Our Strategy:
🔍 Cathy Wood and Mark Minervni - Combining the BEST of both WORLD's.
Ever wondered what happens when you marry the visionary investment approach of Cathie Wood with the precision of Mark Minervini's swing-trading techniques? Look no further. We've crafted a strategy that brings together the best of both worlds, ensuring you're not only prepared for the future but also poised to capitalize on the present.
Our new methodology guarantees:
🔍 Vision Meets Execution: Invest in tomorrow's giants and capitalize on today's trends.
📊 Research & Precision: Dive deep into potential industry-changers, then swing trade with impeccable timing.
⚖ Balance Growth & Quick Wins: Maximize profit potential, diversify risks, and navigate the market with confidence.
📢 "A revolutionary blend of long-term vision and short-term precision. The best of both worlds!" – Top Trader Testimonial.
Selection Criteria:
Introducing our cutting-edge trading strategy, a synergy of Cathy Wood's keen fundamental analysis and Mark Minervini's acclaimed trend template criteria.
Imagine having the foresight to identify high-potential technology stocks that are not just promising on paper but are actively demonstrating robust performance in the market. That's the core of our approach. We meticulously select stocks that Cathy Wood's methodology identifies as leaders in technological innovation, ensuring that each company has a solid foundation for growth. But we don't stop there.
We apply Mark Minervini's trend template to verify that these stocks are not only fundamentally sound but are also in a confirmed stage 2 uptrend. This dual-layered strategy ensures that you're investing in companies that are both revolutionizing their industries and are currently capturing the market's momentum.
With our trading strategy, you're not just betting on potential; you're investing in technology stocks that are set to soar, backed by the analytical prowess of two of the most respected names in the trading world. Join us, and be part of a select group of traders who demand the best of both worlds: groundbreaking innovation and proven market trends.

USD/JPY 💱 Moving in the Path of Least Resistance UsdJpy heading into Q4 23' . Interesting time because the USD may be over-extended but is it? What is the call for Q4 here Kingpin USD. Little weary to Sell UJ just because it is nearing the highs of structure.. Very likely we could continue highertimeframe momentum because wicks get filled in momentum. Taking a moment to look to the left, we may observe 152 is a range that we can go fill as the market moves to the upside with momentum. The Monthly timeframe is pushing up into the close of the Yearly candle. Next target that may occur for Q1 2024 is 155. What're your thoughts about medium term UsdJpy?

Opened new position: NUNU has been added as a new position to our portfolio (8.5% of equity).
The trade has been opened as the price took out Friday's high. This is a pullback entry and a low risk trade. The SL can be set at the 50d MA or at Friday's low for swing traders.
NU shows a strong relative IBD strength and the stock hass been recently oversold.
NU is a holding of Cathy Wood's ARK portfolio.
Here is the link to our updated portfolio which is up > 16% in November:
www.tradingview.com

VRTX: opened a new 10% positionWe have added a new position and here is a link to the updated portfolio:
www.tradingview.com
VRTX had a positive earnings surprise on Nov 6th which pushed the price up to new highs. These new highs have been followed by a natural pullback which occured under low trading volume.
The new position has been added as the price broke through yesterdays high - a classical low risk pullback entry.
VRTX shows an exceptional RS according to IBD criteria which makes this trade a high momentum play.
General Selection Criteria:
Introducing our cutting-edge trading strategy, a synergy of Cathy Wood's keen fundamental analysis and Mark Minervini's acclaimed trend template criteria.
Imagine having the foresight to identify high-potential technology stocks that are not just promising on paper but are actively demonstrating robust performance in the market. That's the core of our approach. We meticulously select stocks that Cathy Wood's methodology identifies as leaders in technological innovation, ensuring that each company has a solid foundation for growth. But we don't stop there.
We apply Mark Minervini's trend template to verify that these stocks are not only fundamentally sound but are also in a confirmed stage 2 uptrend. This dual-layered strategy ensures that you're investing in companies that are both revolutionizing their industries and are currently capturing the market's momentum.
With our trading strategy, you're not just betting on potential; you're investing in technology stocks that are set to soar, backed by the analytical prowess of two of the most respected names in the trading world. Join us, and be part of a select group of traders who demand the best of both worlds: groundbreaking innovation and proven market trends.

Momentum, Growth & InnovationUpated Portolio:
Here is the link to our updated portfolio which has been up by ca. 10% in November:
www.tradingview.com
Selection Criteria:
Introducing our cutting-edge trading strategy, a synergy of Cathy Wood's keen fundamental analysis and Mark Minervini's acclaimed trend template criteria.
Imagine having the foresight to identify high-potential technology stocks that are not just promising on paper but are actively demonstrating robust performance in the market. That's the core of our approach. We meticulously select stocks that Cathy Wood's methodology identifies as leaders in technological innovation, ensuring that each company has a solid foundation for growth. But we don't stop there.
We apply Mark Minervini's trend template to verify that these stocks are not only fundamentally sound but are also in a confirmed stage 2 uptrend. This dual-layered strategy ensures that you're investing in companies that are both revolutionizing their industries and are currently capturing the market's momentum.
With our trading strategy, you're not just betting on potential; you're investing in technology stocks that are set to soar, backed by the analytical prowess of two of the most respected names in the trading world. Join us, and be part of a select group of traders who demand the best of both worlds: groundbreaking innovation and proven market trends.

MOMENTUM, GROWTH & INNOVATIONUpdated Watchlist:
www.tradingview.com
Selection Criteria:
Introducing our cutting-edge trading strategy, a synergy of Cathy Wood's keen fundamental analysis and Mark Minervini's acclaimed trend template criteria.
Imagine having the foresight to identify high-potential technology stocks that are not just promising on paper but are actively demonstrating robust performance in the market. That's the core of our approach. We meticulously select stocks that Cathy Wood's methodology identifies as leaders in technological innovation, ensuring that each company has a solid foundation for growth. But we don't stop there.
We apply Mark Minervini's trend template to verify that these stocks are not only fundamentally sound but are also in a confirmed stage 2 uptrend. This dual-layered strategy ensures that you're investing in companies that are both revolutionizing their industries and are currently capturing the market's momentum.
With our trading strategy, you're not just betting on potential; you're investing in technology stocks that are set to soar, backed by the analytical prowess of two of the most respected names in the trading world. Join us, and be part of a select group of traders who demand the best of both worlds: groundbreaking innovation and proven market trends.

Chambal Fertilizers - Tringle BreakoutTriangle Breakout with Strong Volume & Momentum
SL - 287
Nearest resistance- 350 to 365

NASDAQ Heatmap Last WeekOverall Market Movement: The heatmap shows a wide array of colors, indicating varied performance among the companies. The majority of the companies appear to be in the green, suggesting a generally positive week for the Nasdaq 100.
Sector Performance:
Technology Services: Microsoft (MSFT) and Google (GOOGL) show significant gains of +6.85% and +6.01% respectively.
Electronic Technology: Notably, Apple (AAPL) has a +6.77% increase, indicating a strong performance for the week.
Retail Trade: Amazon (AMZN) stands out with a +5.99% gain.
Top Performers:
NVIDIA (NVDA) shows an exceptional increase of +14.14%, making it one of the top performers.
Advanced Micro Devices (AMD) also shows a substantial gain of +15.28%.
Adobe (ADBE) has a significant rise of +9.33%.
Contrasting Performances: While most technology-related companies are in green, there are some companies like AstraZeneca (AZN) in health technology with a slight decrease of -0.09%.
Consumer Services and Goods:
A mix of performances is seen with some companies like Comcast (CMCSA) showing no change (0.00%), while others like Tesla (TSLA) have a considerable increase of +8.10%.
Indicators: The top bar shows a market cap indicator with varying sizes of squares, representing the relative market capitalization of the companies.
From this heatmap, we can deduce that the week was positive for the majority of tech companies, with exceptional performances from semiconductor manufacturers like NVIDIA and AMD. The retail trade sector also performed well, with Amazon showing strong gains. The heatmap suggests investor confidence in the technology sector, especially in established companies with large market capitalizations. However, the slight negative performance in health technology indicates that the positive sentiment was not uniform across all sectors.
Our Momentum, Growth & Innovation portfolio is up >12% over last week, significantly outperforming the major market indices. Here is the link to the updated portfolio:
www.tradingview.com

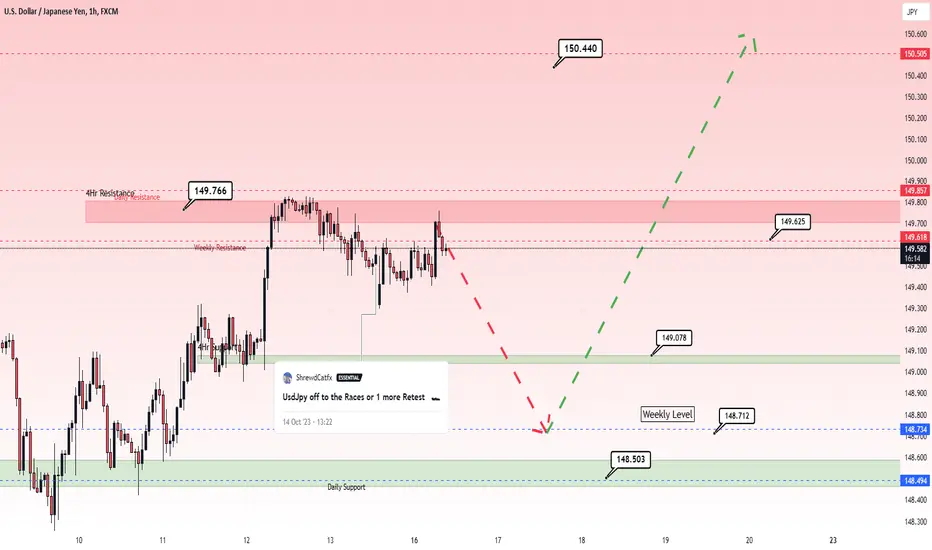
Too Early in week UsdJpy? 🚦UsdJpy , the Yen is testing the highs for liquidity preceding a decrease. It is early in the week and probabilities are not there for the kind of upside volume that we want to observe .
150.5 Bullish Weekly target
152 2nd Bullish Weekly Target
148.71 Bearish Weekly target
148.23 Bearish weekly target #2
Bitcoin ($BTC) Safeguarding The UptrendBitcoin continues to trade above the $34,000 mark, with the overall trend remaining bullish. Formally speaking, BTC is currently experiencing a sideways movement between the buyer's level at $33,400 and the seller’s level at $35,100, indicative of a temporary equilibrium in force.
Considering the upward trend apparent in BTC’s chart, growth continuation is presently the main focus. Potential next targets for buyers could be the levels at $36,100 and $36,900.
Simultaneously, it is crucial to acknowledge that Bitcoin has been on an upward trajectory without undergoing any corrections for over two weeks now. A course correction before a continuation of the growth would be entirely reasonable and could even serve as a strategic advantage for accumulating long positions in BTC. In this scenario, the asset could retreat to the support levels of $30,700 and $29,900, which remain within the boundaries of the prevailing upward trend.
For buyers, any market corrections will remain safe as long as the long-term support level at $27,000, safeguarding the uptrend, remains unbreached.
However, the candlesticks are depicting the Hammer-like shape indicating signs of a Bullish trend incoming.

NSE:Lupin -trend change on card???
NSE:LUPIN
Lupin Limited is an India-based pharmaceutical company. The Company develops and commercializes a range of branded and generic formulations, biotechnology products, and active pharmaceutical ingredients (APIs) in over 100 markets in the United States, India, South Africa, and across the Asia Pacific, Latin America, and others. It offers vitamins, minerals, supplements and neurological products. It has presence in the cardiovascular, dialectology, asthma, paediatrics, central nervous system, gastro-intestinal, anti-infectives and nonsteroidal anti-inflammatory drug therapy segments. Its complex generics portfolio includes Filgrastim, Peg-Filgrastim, Etanercept and Albuterol, and others. Its biosimilar products include Filgrastim, Peg-Filgrastim and Etanercept. Its specialty products consist of Solosec and NaMuscla. Its over-the-counter products include Softovac, Lupizyme, Aptivate, Lupisafe, Be One, V-Bath, and others. It supplies APIs for anti-retroviral, anti-malarial and others.
Disc: Invested, please do you own research
