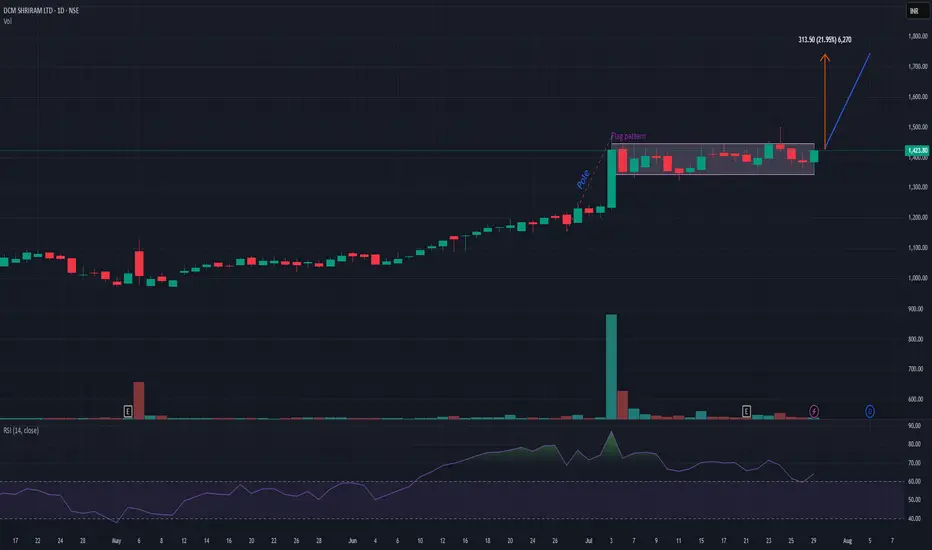
DCMSHRIRAMDCMSHRIRAM is on verge of flag pattern breakout provided that it closes above 1440 level. It has a potential to add up to 20-22% from this level. My view may change if it closes below 1350. Risk-reward is quite in favor. Keep it on radar.
Momentumtrading
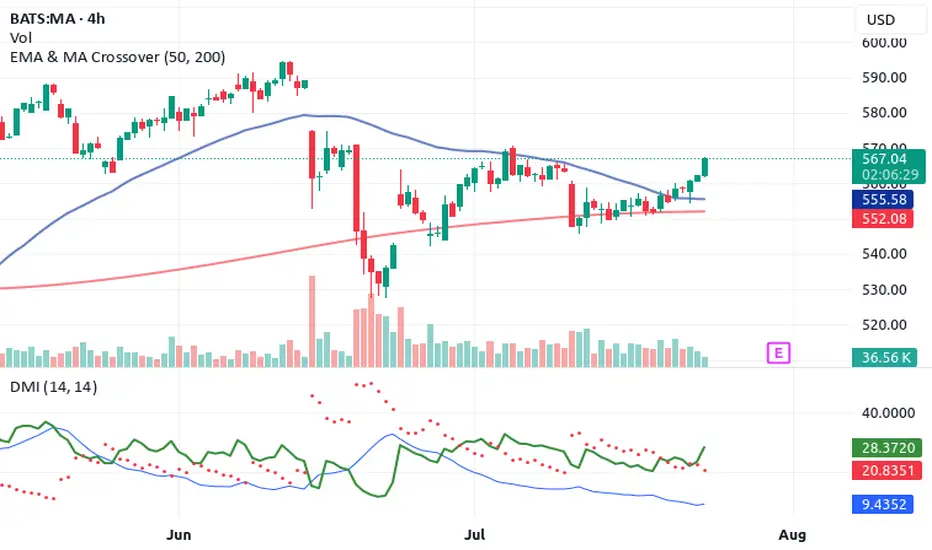
Top 4 Buy Signals Lighting Up Mastercard (MA) 🚀 Top 4 Buy Signals Lighting Up Mastercard (MA) | Rocket Booster Strategy
Mastercard Inc. (MA) is showing explosive potential, and it’s not just one signal—it’s a whole confluence of confirmations. When
you align this much market momentum, you don’t ignore it. Let’s break down how Rocket Booster Strategy gives us a powerful buy indication on the daily chart.
🔍 The Confluence Setup
✅ 1. DMI Buy Signal
The Directional Movement Index (DMI) is in bull mode. ADX is
rising and the +DI is firmly above -DI. This shows the trend is not just alive—it’s gaining strength.
🔻 2. Volume Oscillator Pullback
While Volume Oscillator is down, this is seen as constructive and not bearish. It suggests a quiet zone before the thrust—just like fuel loading before a rocket launch.
Smart traders know: momentum can build silently.
💥 3. Awesome Oscillator = Strong Buy
The Awesome Oscillator is green and firing hard. We’ve seen a clear twin-peak bullish formation followed by a break above zero
—classic acceleration sign.
🕯️ 4. Rising Window (Japanese Candlestick Pattern)
A Rising Window—a bullish continuation gap—has formed. This is one of Steve Nison’s top continuation patterns. It signals strong
institutional conviction in this trend.
📈 What Does This Mean?
When DMI, AO, candlestick patterns, and our own Rocket Booster Strategy all point up, it’s time to pay attention. This setup is rare—and high-probability.
🧠 Rocket Booster Strategy Recap
This strategy uses 3 momentum alignment points:
High Momentum Indicator (like AO) in Buy Mode
Pattern Confirmation (Rising Window or Engulfing)
Volume Correction Before Breakout (Fuel Before Fire)
When all 3 click into place, we have ignition.
🎯 Final Thoughts
Mastercard is looking primed for takeoff on the daily timeframe. Whether you’re an investor or a swing trader, this chart is
speaking loud and clear. But as always, risk management is your co-pilot.
✅ Add it to your watchlist.
🚀 Simulate entries.
🧠 Trust the confluence.
Rocket Boost This Content To Learn More
Disclaimer: This is not financial advice. Always use a simulation/demo account before committing real capital. Trade responsibly.
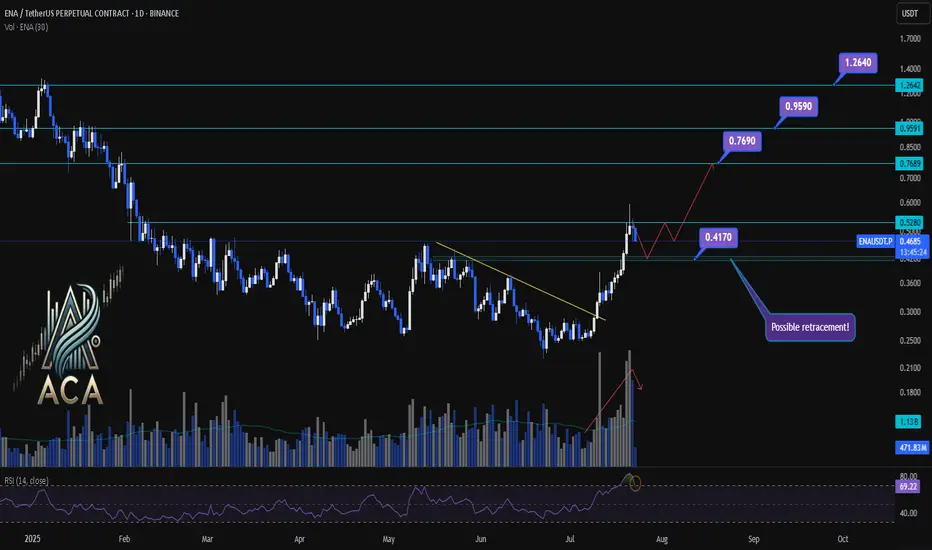
ENA/USDT Chart Analysis | Volatility Signals & Bullish TriggersENA/USDT Chart Analysis | Volatility Signals & Bullish Triggers
🔍 Let’s dive into the ENA/USDT perpetual contract and analyze recent price action, focusing on momentum shifts and key breakout scenarios.
⏳ Daily Overview
The daily chart shows that ENA recently reentered the overbought zone on the RSI, which can serve as a potential trigger for traders watching momentum shifts. Earlier, price action broke decisively above a long-standing descending trendline, resulting in a rapid, nearly 100% surge, a classic RR2 move off the trendline. This breakout coincided with a visible uptick in trading volume, confirming strong demand behind the move.
Now, during the ensuing rest or correction phase, trading volume is decreasing—often a constructive sign suggesting either profit-taking or a healthy pullback rather than panic selling.
🔺 Bullish Trigger & Setup:
- RSI Signal: Reentry into the RSI overbought zone is a potential long trigger, especially if confirmed by price action.
- Confirmation Level: A daily close with strong volume above $0.528 would add conviction to a bullish setup.
- Trendline Reference: The break above the recent trendline fueled the rapid advance, showing the importance of watching such key resistance levels.
📊 Key Targets (on further bullish confirmation):
- $0.769 — First upside resistance.
- $0.959 — Next bullish target.
- $1.264 — Extension target if momentum continues and broader market sentiment remains supportive.
🚨 Conclusion:
Eyes are on the $0.528 level—closing above it with volume, especially while RSI holds in the overbought zone, could provide the next strong entry signal. Current declining volume during pullbacks suggests this is likely a profit-taking phase or standard correction, not bearish capitulation. Keep monitoring RSI, volume profile, and price closes for the next actionable opportunity.
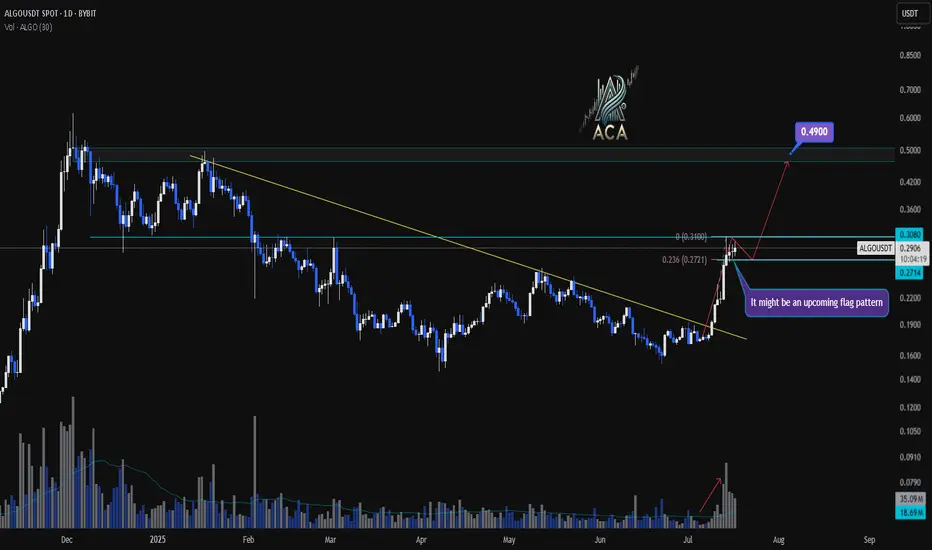
ALGOUSDT Daily Chart Analysis | Continuational patternsALGOUSDT Daily Chart Analysis | Momentum Picks Up on Higher Timeframe
🔍 Let’s break down the latest ALGO/USDT daily chart, highlighting a shift in market structure and key bullish signals.
⏳ Daily Overview
A decisive breakout above the long-standing descending trendline has flipped the narrative for ALGOUSDT. Increased volume during the breakout points to robust bullish momentum, suggesting buyers are regaining control at this multi-month inflection point.
🔔 Flag Pattern & Chart Structure
- Bullish flag pattern is emerging after the recent breakout, as price consolidates in a tight range—a classic continuation formation.
- Former trendline resistance is now acting as support, confirming a notable shift on the higher timeframe.
📐 Fibonacci & Target Levels
- The 0.236 Fibonacci retracement at $0.2771 is providing immediate support, with price consolidating above this anchor level.
- Upside targets:
- First resistance at $0.3080, which aligns with horizontal supply and previous pivot highs.
- If the flag pattern resolves upward, the next Fibonacci extension points to $0.4900, marking a significant confluence and potential for further gains.
📊 Key Highlights
- Strong daily candle and surging volume confirm momentum shift.
- Watch the developing flag pattern for breakout confirmation.
- Major trendline break on the daily signals structural reversal.
- $0.3080 is the immediate target; $0.4900 is the extended objective from the flag/Fibonacci alignment.
🚨 Conclusion
ALGOUSDT is setting up a compelling bullish scenario—keep a close eye on price behavior at the flag and $0.3080 level. A breakout may trigger the next impulsive move toward $0.4900.
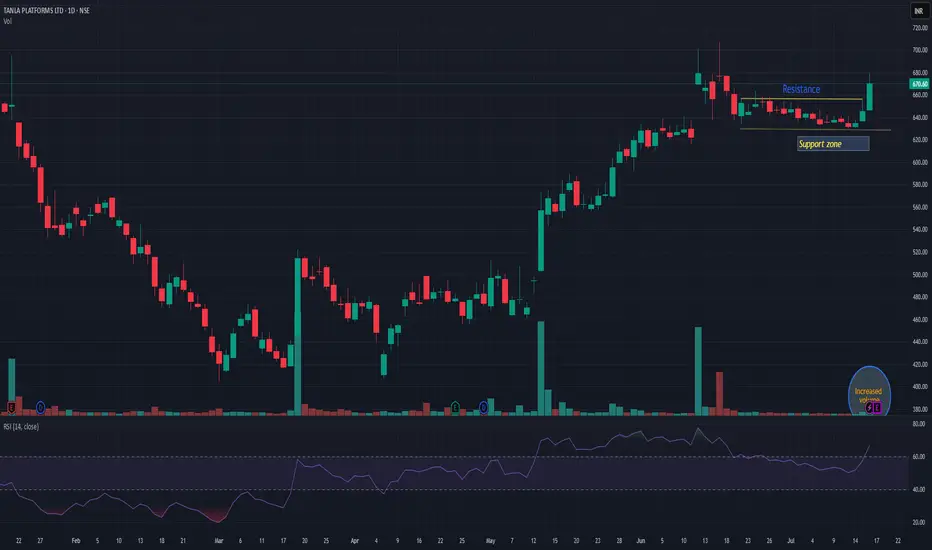
TANLATANLA giving resistance breakout with decent volume. Seems it may start momentum from here. 625-30 is strong support zone. below this my view may be changed. Risk-reward is quite in favor.
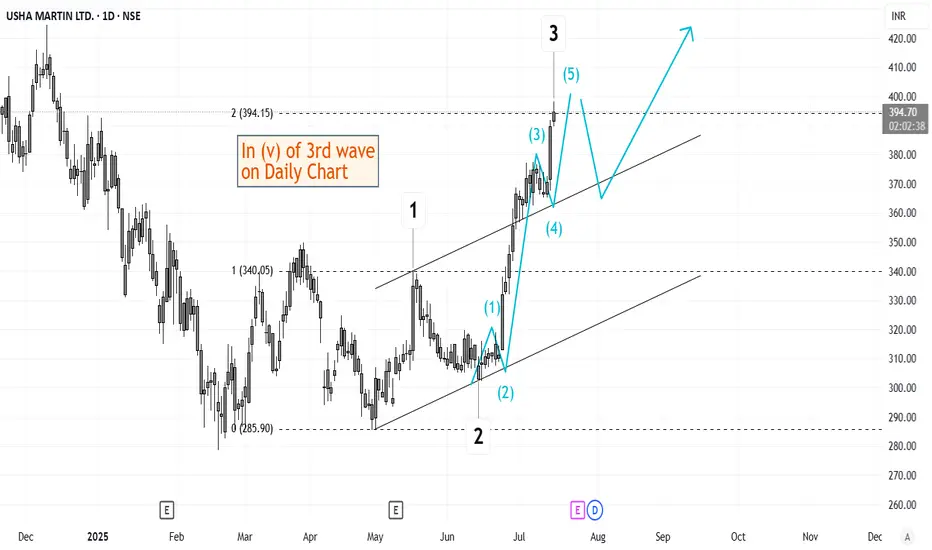
Elliott Wave Analysis of Usha Martin USHAMARTThe script is currently in (v) of 3rd wave on daily time frame. This should be followed by a short retracement and then a 5th wave up. Will keep updating this chart as it progresses.
Elliott Wave Analysis of Kirloskar Brothers KIRLOSBROSThe script is currently in 4th wave of hourly chart. The 4th wave seems to be ending, which means a 5th wave will start from here. The wave patters and patterns, retracements and analysis have been highlighted on the chart. Will update this as it progresses.

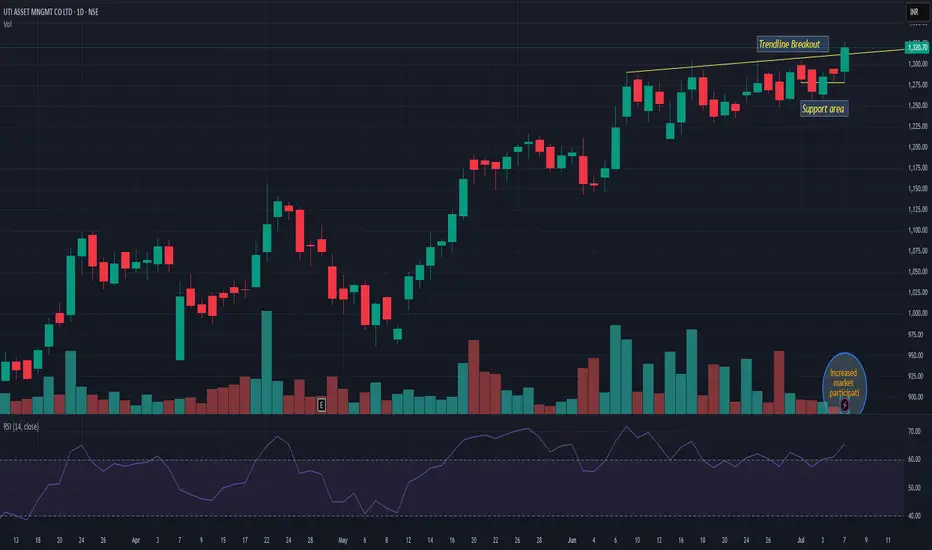
UTIAMCUTIAMC giving trend-line breakout with increased volume. It is trending just 5=7% away from ATH. 1250 seems strong support and on upper side it may trade above 12-15%. Keep it on radar
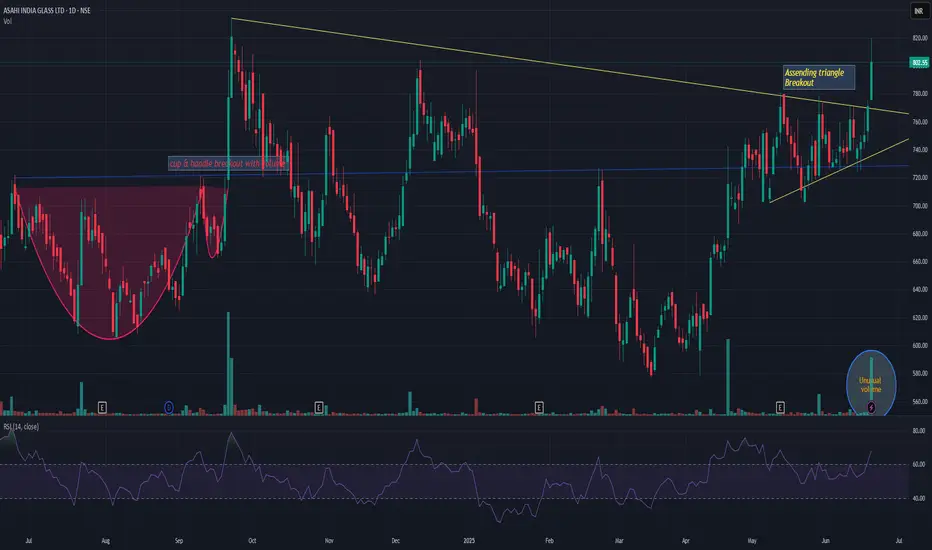
ASAHIINDIAASAHIINDIA has given symmetrical triangle breakout with unusual volume. Already took a momentum. Now as long as it is above upper channel line, i believe the momentum will continue till 980-1000 levels. Keep it on radar.
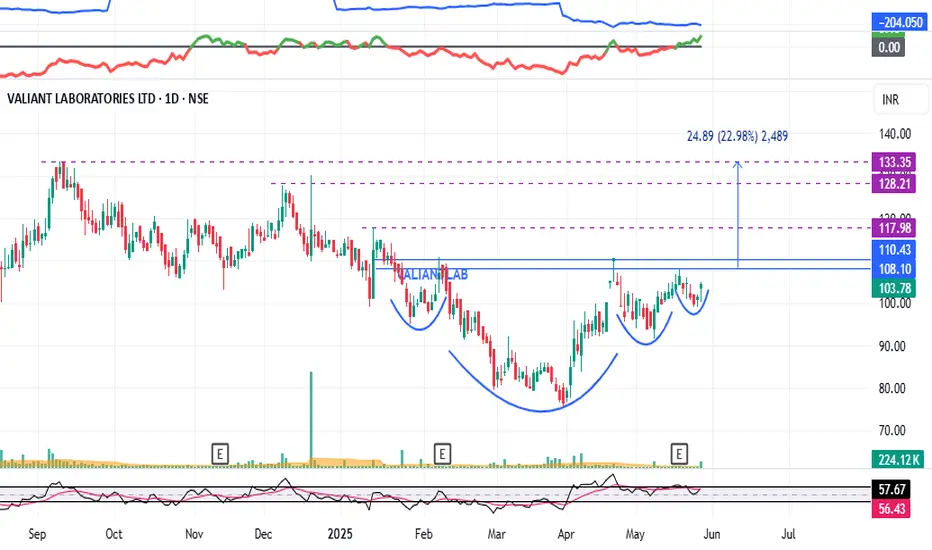
VALIANTLAB : Breakout Candidate (Swing Pick)#VALIANTLAB #swingtrading #breakoutstock #momentumstock
VALIANT LAB : Swing Trade
>> Cup & Handle Formation Visible
>> VCP Structure also Visible
>> Good Strength in stock
>> Volume Contraction seen, Expansion imminent
>> Potential Upside 23%
Swing Traders can lock 10% profit and keep trailing.
Disc : Stock chart shared for Learning Purpose and not a Trade recommendation.
GBP/USD Daily Chart – Explosive Move Building in Wave 3?The GBP/USD daily chart is setting up for what could be one of the most powerful bullish phases in an Elliott Wave sequence: a third wave.
🔥 What This Means:
Elliott Wave theory identifies the 3rd wave as the strongest and fastest part of a trend.
Price action suggests that GBP/USD is just starting this move, which means we could see sharp momentum to the upside in the coming days and weeks.
🎯 Key Target:
The first key level to watch is around 1.5315, which is the 1.618 Fibonacci projection of Wave 1.
This is a common and high-probability target for a Wave 3 rally.
🧠 For Beginners:
In Elliott Wave theory, markets often move in impulses of 5 waves. The 3rd wave is typically the strongest. When that third wave itself breaks down into another 5-wave structure, the middle wave of that sequence (the "3 of 3") tends to produce the most aggressive movement.
📌 Summary:
GBP/USD appears to be starting the 3rd wave, a powerful bullish signal.
Near-term resistance to watch is at 1.4200, with potential for further upside if momentum continues.
This could be the early stages of a high-probability swing trade setup. Keep an eye on the smaller timeframes for intraday confirmation!

Momentum Trade in Dam Capital1. Resistance breakout
2. Positive Divergence on RSI
3. Volume pop up
4. MACD signal turning green
5. RSI near 70

Weekly Market Wrap: Nifty Surges Past 25,000 – What's Next? The Nifty 50 index closed the week at 25,019, posting an impressive 1,000-point rally from the previous week’s close. The index made a high of 25,116 and a low of 24,378. The rally was driven by short covering and a surprise truce between India and Pakistan, which injected a wave of optimism into the market.
More importantly, Nifty broke out of the consolidation range of 23,200–24,600, closing strong above the psychologically significant 25,000 mark – a clear sign of bullish sentiment.
What to Expect Next Week (Outlook May 20–24)
Expected Range: 24,450 – 25,600
A breakout above 25,600 could open the doors for a retest of the all-time high (ATH) at 26,277.
As long as Nifty trades above 23,800, the broader trend remains intact.
Monthly Chart Patterns to Watch
A bullish "W" pattern could be forming, which ideally would require a pullback from current levels before resuming upward.
On the flip side, a bearish "M" pattern may emerge if the index tests ATH and faces rejection, which could trigger a sharp correction of 2,500–2,600 points.
For now, I remain cautious until the monthly time frame confirms a clear bullish breakout.
Global Markets Check: S&P 500 Eyes Key Resistance
The S&P 500 closed at 5,958, gaining 300 points week-on-week. As anticipated, a breakout above 5,770 propelled the index to meet all short-term targets of 5,821 / 5,850 / 5,900.
Key Level to Watch: 6,013
This is a major Fibonacci resistance — the same level where the market started correcting back on March 3, 2025.
A weekly close above 6,013 would be bullish, potentially triggering rallies toward 6,091 / 6,142 / 6,225.
However, a breakdown below this week’s low of 5,786 would confirm a failed breakout, with downside targets at 5,637 / 5,551 / 5,458.
Momentum traders, get ready – sharp moves are coming either way!

XRP/USDT — Structure-Driven Strategy (1H Chart)Just price, structure, and volume — tracked in real time.
🧠 Chart Breakdown:
✅ Reversal Buy — Price flushed, then snapped back into the range with follow-through. That became the base structure for everything that followed.
⛔ Top Exhaustion / Rejection — Clean reversal after a strong rally. Volume dropped off, candles showed hesitation, and sellers stepped in.
⚠️ Small Rejection Mid-Range — Structure failed to push higher. This area marked a trap — no volume confirmation, no continuation.
🚨 Major Breakdown & Recovery Setup — Price dropped hard but reclaimed key levels quickly. The recovery candle and volume spike were the first clues buyers were stepping in again.
👀 Current Watch Point — Price is now pressing back into that same resistance zone. The structure here is everything — a clean reclaim could mean trend continuation. But hesitation again? Fade it.
Always happy to be helpful.

Lighten Up! After a rounding bottom where it looked as though the bulls were forming a base, we now see a long bearish red candle hinting at the bears denying a bullish breakout. I wouldn't close positions here, but I would lighten up on longs. Follow me for more simple to understand expert analysis. Thank you for reading. Now get out there and trade! :)

ONE POINT ONE SOL LTD bullish reversal pattern✅ Trade Setup (Swing Trade)
📌 CMP: ₹62.21
🟢 Entry (Buy Zone): ₹60–₹63
🎯 Targets:
Target 1: ₹69.80 (Fibo 0.382)
Target 2: ₹78.50 (Fibo 0.5)
Target 3: ₹87.30 (Fibo 0.618)
🛑 Stoploss: ₹55 (below wedge breakout and recent support)
⚖️ Risk-Reward Ratio:
Entry: ₹62 | SL: ₹55 | Target 1: ₹70 → ~1:1
For higher targets, risk-reward improves to 2:1 or more.
for educational purposes only

Eternal : Swing / Momentum Pick#eternal #chartpattern #breakout #swingtrading #momentumstocks
Eternal : Swing/Momentum Pick
>> Good Clean Breakout
>> Buy at CMP or if it comes near Safe Entry Zone u can add more
>> Good Strength in Stock
>> High Probability Chart Pattern
>> min 12% upside Visible
Swing Traders can Book or lock Profit at 10% and keep Trailing
Disclaimer : This is not a Trade recommendation, Do your own Analysis and consult your Financial advisor before taking position in the stock. Charts Shared are for Educational Purpose only, Pls note i may or may not have position in it.

What Is Momentum – And Why It’s Not Just a Trend IndicatorMost traders follow price — candles, trendlines, support/resistance. But there’s another layer that often tells the story before the price moves: momentum.
⸻
🔍 In this post, you’ll learn:
• What momentum really measures
• Why it’s not the same as price direction
• How momentum can signal a shift before the chart confirms it
• Why combining momentum with structure improves timing
⸻
📈 Momentum ≠ Direction
Price can be rising while momentum is fading. That’s often a clue of an upcoming slowdown or reversal — long before the price turns. Similarly, price can be flat, while momentum builds in one direction. That’s tension… and tension leads to moves.
⸻
🔥 Why Momentum Matters:
• It reveals intensity, not just direction
• It can act as a leading indicator — not lagging
• Momentum divergences often hint at hidden accumulation or distribution
• Tracking it helps you avoid late entries or false breakouts
⸻
🔧 Takeaway for traders:
If you’re only watching price, you’re only seeing half the picture.
Momentum shows what’s driving the move, and when that drive starts weakening.
⸻
💬 What’s your favorite momentum indicator? RSI, %R, CCI, or something else?

Trend Changing Pattern (TCP) ExplainedIntroduction
One of the most important skills in forex trading is learning how to read price action and understand what the market is telling you. Price is not just numbers — it’s the collective perception of traders, making it the most reliable leading indicator available.
Today, I want to explain a powerful concept known as the Trend Changing Pattern (TCP) — a crucial tool for identifying potential market reversals and shifts in trend direction.
📈 What Is a Trend Changing Pattern?
In any trending market, whether it's an uptrend or downtrend, the trend won’t change easily. The strength of the trend and the timeframe you're trading on will determine how long it takes for a true reversal to occur.
One key signal of a trend change is a shift in momentum:
In an uptrend, when a momentum low forms during a pullback, it can be a sign that the trend is beginning to reverse.
In a downtrend, a momentum high during a pullback can signal a potential bullish reversal.
These are what we refer to as Trend Changing Patterns (TCPs) — moments where the structure of the market starts to shift.
⚠️ Watch for Manipulation After the TCP
After a TCP appears, it's common to see price manipulation before the new trend fully takes hold:
In an uptrend, price may return to manipulate the previous high before continuing down.
In a downtrend, price often dips to manipulate the previous low before reversing higher.
Being aware of this common liquidity grab helps traders avoid being trapped and instead position themselves in alignment with the new trend.
🧠 Final Thoughts
Understanding how to spot and interpret a Trend Changing Pattern gives you a major edge in forex trading. It helps you stay ahead of the market and make informed decisions based on price action, not emotion.
🎥 In the video, I go into more detail about momentum highs and lows, and how to recognize these key patterns in real time. Be sure to check it out if you want to sharpen your trend reversal strategy.
Wishing you success on your trading journey! 🚀

5 Most Popular Momentum Indicators to Use in Trading in 20255 Most Popular Momentum Indicators to Use in Trading in 2025
Want to master the art of momentum trading? Look no further. In this FXOpen article, we’ll explore how to use momentum indicators, the signals they generate, and five most popular momentum indicators for trading in 2025.
What Is a Momentum Indicator?
Momentum in technical analysis refers to the rate at which an asset's price accelerates or decelerates, helping traders identify potential trend continuations or reversals.
A momentum indicator is a tool used in technical analysis to measure the speed and strength of an asset’s price movements. By analysing changes in price over a specific period, these indicators provide insights into the underlying force driving market trends.
Momentum indicators do not focus on the direction of the price movement itself, but rather the strength behind it. Traders use these tools to gauge whether the market is overbought, oversold, or losing momentum, which helps determine entry or exit points. A stock momentum indicator like the Relative Strength Index (RSI), for instance, may indicate that stocks are currently bought or sold too heavily and their price is due for a reversal.
The Significance of Momentum Technical Indicators
Momentum indicators do not focus on the direction of the price movement, but rather on the strength behind it. They’re able to quantify and represent hidden clues about the future market direction in an easily interpretable way. By learning to read momentum indicators, traders can develop effective trading strategies, identify potential opportunities, and manage risk more efficiently.
Momentum tools produce a range of signals that offer traders an edge over the markets. Let’s take a look at some of the most common momentum signals.
Overbought and Oversold Conditions
These signals indicate when an asset's price has moved too far in one direction without sufficient support from fundamental or technical factors and is likely to reverse. For example, RSI generates overbought signals when the reading rises above 70 and signals oversold conditions when the reading falls below 30.
Divergence
Divergence occurs when the price of an asset moves in the opposite direction of the indicator, suggesting an upcoming reversal. For instance, when the price is making higher highs, but RSI is making lower highs, this indicates a bearish divergence that increases the likelihood of a downward move.
Crossover
These signals are generated when the indicator's lines cross each other or a certain threshold. A common example is the MACD, where traders look for crossovers between the fast MACD line and the slower signal line to spot potential entry and exit points.
Top Five List of Momentum Indicators for Technical Analysis
Now that we understand the types of signals that momentum tools produce, let’s break down five of the most popular with a momentum indicators list.
1. Relative Strength Index (RSI)
The RSI is one of the most popular and well-documented momentum indicators. It measures the speed and change of price movements by comparing the average gain to the average loss over a specified period, usually 14.
RSI is an oscillator, moving between 0 and 100. Values above 70 reflect overbought conditions, while values below 30 indicate oversold conditions. When the RSI moves out of overbought or oversold territory, many traders interpret this as a reversal confirmation. Sustained movements above or below the midpoint (50) can also be used to confirm a bullish or bearish trend, respectively. Moreover, traders look for divergence between the RSI and price to identify weakening trends and possible reversals.
2. Average Directional Index (ADX)
The ADX is a momentum indicator used to determine a trend’s strength. Unlike most other tools, its reading doesn’t move according to the direction of price action, i.e. it doesn’t move up if bullish or down when bearish. Instead, it ranges from 0 to 100, with values above 25 indicating a strong trend and below 25 suggesting a weak or non-trending market.
ADX is commonly used in combination with other tools, as it simply confirms the trendiness of a market. For example, traders might use a leading indicator like RSI to anticipate bullishness and confirm the trend when ADX crosses over 25.
3. Commodity Channel Index (CCI)
The CCI is a versatile momentum indicator. It uses a constant in its calculation to ensure that 75% of values fall between +/- 100, with moves outside of the range generally indicating a trend breakout or continuation. It can also show extreme overbought or oversold conditions when its value exceeds +/- 200.
The CCI requires a more nuanced approach than other tools and is typically used to confirm a trader’s directional bias and to identify potential opportunities. For instance, a visually identifiable bullish trend can be confirmed by looking at the CCI. If its value is skewed toward 100+, traders can be confident in their observation. When the market cools off, CCI will fall below 100. Traders can then confirm a pullback entry with a move back into the +/- 100 range.
4. Moving Average Convergence Divergence (MACD)
The MACD is a highly regarded trend-following momentum indicator that shows the relationship between two moving averages of an asset's price. It’s used in technical analysis to identify the relationship between two moving averages of a security’s price. It helps traders understand the trend’s strength, direction, and duration, as well as possible reversal points.
Traders use crossovers between the MACD and signal lines as potential entry and exit signals. Additionally, when the MACD histogram crosses above or below the zero line, it can indicate bullish or bearish momentum in the market. Lastly, it’s also possible to spot divergences between price and the indicator’s peaks and troughs, similar to how divergences are identified with RSI.
5. Momentum (Mom)
The Momentum indicator is a simple yet potentially effective tool that measures the rate of change in an asset's price over a specific period. The value of the Momentum depends on the market it’s applied to. For example, using the Momentum indicator in stocks will result in a fluctuating value typically between +/- 20, depending on the stock’s price. For forex pairs, its range may look more like +/- 0.02.
The common feature across all markets, however, is the zero line. Generally speaking, positive Momentum values indicate upward price movement, while negative values suggest downward movement. It can also show overbought and oversold conditions, but its lack of defined boundaries means this can be tricky. However, Momentum is especially useful for identifying divergences.
Advantages of Momentum Indicators
Momentum indicators are valuable tools in technical analysis, helping traders assess the strength and speed of price movements. They offer several benefits that enhance trading strategies and decision-making:
- Identify Trends Early: Market momentum indicators can reveal the start of a new trend and the end of the old trend, allowing traders to enter trades at opportune moments.
- Objective Analysis: They provide quantifiable data, reducing reliance on subjective analysis and emotional decision-making.
- Spot Overbought and Oversold Conditions: Momentum tools help traders identify when an asset is overbought or oversold, signalling potential reversals and exit points.
- Confirm Trade Signals: Combining momentum indicators with other technical tools enhances the accuracy of trade signals, providing stronger confirmation for trading decisions.
- Adaptable Across Markets: They can be applied to various assets, including stocks, forex, and commodities, making them versatile tools for traders.
Things to Consider When Trading Momentum Indicators
While momentum indicators can be an effective addition to any trader’s arsenal, there are a few things to be aware of:
- Trade with the Trend: Trends often last longer than you may think, and constantly looking for trend reversals will only end in frustration. Look for bullish signals during an uptrend and bearish signals in a downtrend.
- Use Multiple Indicators: Relying on a single tool can lead to false signals. Many traders combine a lagging indicator, like MACD, with a leading indicator, like RSI. Combining two or three tools can help confirm signals and improve trade accuracy.
- Beware of False Signals: Momentum indicators can sometimes generate false signals, especially in sideways or choppy markets. Being patient and waiting for confirmation before entering a trade is vital.
- Don’t Rely Too Heavily on Indicators: While momentum indicators can be helpful, relying solely on them without considering price action, market structure, or fundamental aspects can lead to poor trading decisions. Use these indicators alongside other tools for a momentum indicator strategy.
Final Thoughts
Now that you have a comprehensive overview of momentum indicators and the signals they produce, it’s time to put your knowledge into practice. After experimenting with a few tools and settling on your favourites, you can open an FXOpen account. You’ll be able to trade over 600+ markets with low costs and ultra-fast execution speeds while partnering with one of the world’s fastest-growing forex brokers. Good luck!
FAQ
How to Use Momentum Indicators?
With momentum indicators, traders monitor the rate of price changes to assess whether it is gaining or losing strength. Traders look for overbought or oversold conditions, divergences, and crossovers to determine potential entry and exit points.
What Is the Best Period for a Momentum Indicator?
If we are talking about the Momentum indicator, the best period depends on your trading style. For short-term traders, 7 and 10 periods are common, while long-term traders may prefer 14 and 21 periods. Testing various periods based on asset volatility can improve results.
What Is the Best Momentum Indicator for Scalping?
There is no best momentum indicator for scalping but the Relative Strength Index (RSI) is often favoured by scalpers due to its ability to quickly identify overbought or oversold conditions. Its responsiveness helps scalpers make rapid decisions in fast-moving markets.
What Is the Difference Between Momentum and Trend Indicators?
Momentum trading indicators measure the speed of price changes, while trend indicators assess the direction and persistence of price movements. To put it simply, momentum focuses on strength, while trend indicators focus on the overall direction.
Is MACD a Momentum Indicator?
Yes, the Moving Average Convergence Divergence (MACD) is one of the most popular momentum indicators, especially in stock trading. It reveals changes in momentum and helps identify potential trend reversals.
This article represents the opinion of the Companies operating under the FXOpen brand only. It is not to be construed as an offer, solicitation, or recommendation with respect to products and services provided by the Companies operating under the FXOpen brand, nor is it to be considered financial advice.

Live Trade Unfiltered: Real-Time Breakout, Strategy & Market PsyWatch me execute a live trade in COINBASE:B3USD breaking down price action, trend lines, and market psychology in real time. I also guide a fellow trader through the trade via text. Whether you're new to day trading or a seasoned pro, this is a raw look at how I navigate fast-moving markets. No financial advice—just live insights!
Key Takeaways
Trade Type: Bull flag breakout, intraday scalping, ahead of huge multi day rally.
Indicators Used: Trend lines, Bollinger Bands, price action.
Exit Strategy: Momentum signals, clearly defined criteria for price behavior.
Psychological Tip: Don’t chase trades—wait for price to come to you.
Live Trading Lesson: Limit vs. market orders for optimal exits.
I'll update this post with the trade outcome and lessons learned. Let me know in the comments if you’d like to see more live trading breakdowns!
CRYPTO:B3USD CRYPTO:BTCUSD CRYPTO:XRPUSD
As always this is not investment advice, I would never place myself in such a liable situation, and you shouldn't take advice from a stranger on the Internet, do your own research and CY your own A and trade at your own risk.

STOCK IN MOMENTUM...NSE:SUNDARMFIN trade at 4880 level. Stock trade its ALl TIME HIGH LEVEL, You can watch for an Upside movement after breakout.

Bullish XRP: Adaptive RSI & Block Support Fuel Upswing PotentialCOINBASE:XRPUSD is showing promising signs of a potential upswing, driven by a bullish flip in the Adaptive RSI on the 15-minute chart, reinforced by strong order block support above $2 and confluence from other technical indicators.
Technical Analysis:
Adaptive RSI (15-Minute): The Adaptive RSI has recently transitioned from bearish to bullish on the 15-minute chart, indicating increasing buying pressure and a potential shift in momentum. This adaptive version of the traditional RSI is designed to adjust to changing market conditions, making it a potentially more reliable indicator of momentum shifts.
ICT Killzones (Worldwide Markets): The ICT Killzones, analyzed on the worldwide market timeframe, suggest that XRPUSD may be approaching an area where volume could increase, potentially leading to a rapid move. This aligns with the bullish signal from the Adaptive RSI and adds to the potential for a quick surge in price. However, it's important to be aware that this also increases the risk of a sudden overbought condition.
Supertrend Signals (AI Aggregator): The Supertrend indicator, functioning as an AI aggregator, is currently bullish.
Smart Money Concepts (Order Blocks Above $2): A key factor supporting this bullish outlook is the presence of strong order block support above the $2 psychological level. This suggests that institutional buyers or "smart money" have been accumulating XRP in this area, creating a solid foundation for a potential upward move.
Trade Setup:
Entry: Enter a long position now that the Adaptive RSI has flipped bullish on the 10-minute chart.
Stop-Loss: Place a stop-loss order below the recent swing low or a key support level identified by your indicators on the 15-minute chart, and consider placing it below the identified order block support for added security.
Take-Profit: Identify potential take-profit targets based on previous resistance levels or areas of potential selling pressure indicated on the 15-minute timeframe. Be mindful of the potential for a quick overbought condition, and consider taking profits strategically as the price rises.
Disclaimer: This is for educational purposes only and is not financial advice. Trading involves risk, and you could lose money. Always do your own research and consult with a qualified financial advisor before making any investment decisions.
