Box range: 140.50-148.12Hello?
Hello traders!
If you "Follow" us, you can always get new information quickly.
Please also click “Boost”.
Have a good day.
-------------------------------------
(XMRUSDT chart)
(1D chart)
To continue the downward trend, it must fall below 143.43 and show resistance.
If not, it is expected to rise above 145.55-146.69.
However, since a trend is expected to be formed only when it breaks out of the 140.50-148.12 box range, I think it is better to respond briefly when trading within the box range.
(1h chart)
Support and resistance areas are formed in the 142.88-145.0 range.
Therefore, in order to maintain SHORT, it must fall below the 142.88-143.91 range.
Therefore, it is recommended to respond briefly in the 142.88-145.0 range.
If it falls below 142.88, it is expected to fall to around 137.8-139.03.
If it rises above 145.0, it is expected to rise to around 147.15-147.55.
--------------------------------------------------
To sum up, since it is within the box section, short section trading using the top and bottom of the box section is in progress.
If you do not want to trade in a short corresponding zone, it is better to wait for a break out of the box zone on the 1D chart.
-------------------------------------------------- -------------------------------------------
** All explanations are for reference only and do not guarantee profit or loss in investment.
** Trading volume is displayed as a candle body based on 10EMA.
How to display (in order from darkest to darkest)
More than 3 times the trading volume of 10EMA > 2.5 times > 2.0 times > 1.25 times > Trading volume below 10EMA
** Even if you know other people’s know-how, it takes a considerable amount of time to make it your own.
** This chart was created using my know-how.
---------------------------------
Monero

XMR LONG SignalGot a Long signal on MONERO USDT, usually the XMR Signals do work out with a winrate of 83%.
Once the algo closes the trade i will update the idea here, stay tuned

Downward Trend and Price DynamicsMonero has experienced a consistent decline over the past month. Despite considering a support level around $158, there wasn't enough demand to maintain it. This coincided with increased selling pressure, causing Monero's price to drop to around $136. This puts the currency back into the range where its previous upward movement began, as seen in the daily timeframe. Looking at the weekly timeframe, there have been 9 consecutive bearish candles, indicating significant selling pressure. To change this negative trend, a decisive break above the $149 level is necessary, which could lead to potential price growth towards the target of $200.
In the short term, the price chart displays a channel between $150 and $135. If the lower boundary of this channel is breached, considering the overall bearish market conditions, there's a possibility of further price decline towards the $125-$120 range for Monero (XMR).

XMR: Support BreakoutMonero (XMR) technical analysis:
Trade setup : After getting rejected at $170 two- or three times (Double or Triple Top pattern), price broke below $150 support and could revisit $132 support next.
Trend : Downtrend across all time horizons (Short- Medium- and Long-Term).
Momentum is Mixed as MACD Line is above MACD Signal Line (Bullish) but RSI < 45 (Bearish).
Support and Resistance : Nearest Support Zone is $132. The nearest Resistance Zone is $150 (previous support), then $170, and $187.

Monero Money Flow Picks Up: Should We Continue Trading?The money flow within the Monero ecosystem has recently picked up, leaving me wondering whether we should continue trading this cryptocurrency.
Over the past few weeks, Monero has shown signs of increased activity and market interest. The trading volumes have surged, indicating renewed enthusiasm from investors and potentially creating new opportunities for traders like us. Monitoring the money flow within a particular market is crucial for making informed trading decisions.
The recent rise in Monero's money flow has sparked my curiosity, prompting me to evaluate whether we should consider increasing our trading activities with this digital asset. While the reasons behind this surge in money flow can vary, it is essential to delve deeper into the factors influencing this trend to determine its sustainability and potential profitability.
We must engage in an open discussion about the current state of Monero and its prospects. Together, we can analyze the market dynamics, assess the potential risks and rewards, and ultimately decide whether it is wise to continue trading Monero.
Therefore, I kindly invite you to share your insights and opinions. Your experience and expertise in the trading field would be invaluable in helping us make an informed decision. Please feel free to voice any concerns in the comments or questions regarding Monero's recent money flow surge or other factors that may influence our trading strategy.
I look forward to your response and the opportunity to continue our trading journey with Monero.

XMR/USDT possible scenario?👀 Monero(xmr) Today Analysis
💎 XMRUSDT is making a promising move as it successfully mitigates the supply zone containing the bearish OB and fills the imbalance.
💎 Currently, we observe that it has been rejected several times from a certain resistance area, indicating a loss in bullish momentum.
💎 The RSI also shows a significant downward move. If the price breaks the resistance level, it will set up bullish momentum.
💎However, if it fails to break the resistance, the price could take a downward turn to mitigate the Bullish OB
💎In the dynamic world of crypto, staying informed and adaptable is key. Stay tuned for more updates and enjoy your trading journey

XMR Investment Plans.I'm going to make an investment purchase of Monero next year.
A significant portion of the money I've been making in futures will go into a long-term buy and hold of XMR.
Ready to share my vision of how I will buy. I expect a qualitative change in attitude towards Monero in the coming years.
The number of beneficiaries of invulnerable capital is growing.
This means that bought with money that in no way can be cashed in Monero becomes an important link in the withdrawal of capital.
By the way, I also believe that in the coming years there should be platforms focused primarily on decentralized trading using Monero.
1. $97-95 - 20% of total planned budget.
2. $62 - 40% budget.
3. $40.05 - 40% budget.
Real life will begin in 2025. ;)
I expect at least $900-1000 for XMR at the peak of the market.

#XMR 23 Days in Downtrend. When to Buy?Its been 23 Days since #XMR decreases in price.
Expect continuation of the downtrend with further increase of the price, because on D TF we can see RSI almost oversold. And the price is coming to very strong support where we can see Weekly FVG, Weekly 50 ema cross and 200 ema cross on D TF
We can expect bounce from that level - 148.8$
If the price wont stay above 1st Target, that I mentioned on the chart, after the bounce from 148.8$
Then probably, coin will continue its descending move towards to Support line that you can also see on the Chart, where I will set a Limit order to buy.
You can Open:
Shorts until the levels I mentioned in the chart and set Limit orders to long when the price will reach the levels.
L ong Position invalidates only if the price will stay below the support line.

Bull Flag on daily $XMR chartThoroughly oversold on the stochastic's as well
I have mentioned the super massive all time chart that #Monero is showing
incorporating the 2017 & 2021 highs which I believe will be taken out to the upside in this coming bull cycle

Monero Also Have a very good Investment Opportunity Hi Everyone;
today we have one of the best risk to reward Investment opportunity
it is more than 165 times the risk and the chart is look very promising.
I expect breaking the previous bear market key point will clear the way to the final target

XMR SHORT PROJECTIONXMR is currently experiencing a sideways price action, with a notable strong resistance capping its price movement, preventing it from surpassing the $170 level on the daily timeframe. In light of this, we anticipate a downside momentum to act as a correction leg for the previous bullish trend. Simultaneously, we are closely observing for a potential bearish breakout to occur on the support within this market structure.

XMR: Approaching ResistanceMonero (XMR) technical analysis:
Trade setup : Price is in an Uptrend overall. But near-term, after getting rejected at $170 two- or three times, that could signal a Double or Triple Top pattern, which is negative (bearish). Now we wait for price to either 1) break above $170 to signal uptrend continuation, or 2) pullback to $150 level that could serve as an attractive entry opportunity.
Trend : Neutral on Short-Term basis and Uptrend on Medium- and Long-Term basis.
Momentum is Mixed as MACD Line is below MACD Signal Line (Bearish) but RSI ~ 50 (Neutral).
Support and Resistance : Nearest Support Zone is $163, which it broke, then $150. The nearest Resistance Zone is $170, then $187.

Moneo(XRM) Nothern Journey beginsMonero bulls defended $152 support- Is $168.8 achievable
Strategy Bullish
Profit Target 168-172
If Break above 179USD and 3days closing successfull above 179 The strategy turns to Tend Strategy Bullish
Risk Management: Proper trailing stop
XMR dropped to its previous parallel channel’s mid-level of $152 after BTC retreated to $26K on 28 March. The $152 level also coincided with the Fixed Range Volume Profile’s POC (point of control) line, which attracted increased trading volume.
The recovery blasted above the local resistance at $157.6. Bulls could push XMR to $168.8 if they clear the obstacle at $165. A strong BTC upswing into FWB:29K could tip XMR to target other key resistance levels, including $179 and $187.
A close below $157.6 could attract bears into the market. However, bears must clear the $152 hurdle to gain market leverage to sink XMR to $145 or $135.
The Relative Strength Index (RSI) dropped but rebounded and was above the 50 mark at press time, showing increased buying pressure in the past few days.
Similarly, the On Balance Volume (OBV) exhibited an uptick, showing XMR saw increased trading volumes as demand soared in the past few days.
Monero registered mixed performance in Q1, 2023. It appreciated by 40%, rising from $148 to $187 in January. In February, it consolidated before sustaining a price dump in mid-March, sinking it to $135. But XMR saw aggressive demand at the $135 level, setting it up for recovery.
Bitcoin zoomed to the FWB:29K level before retreating to $28K – indicating a bullish sentiment despite the increased U.S. regulatory pressure on the crypto industry.
If BTC reclaims the FWB:29K and surges upwards, XMR could attempt to retest or break above a crucial stiff resistance level.
In addition, XMR saw more liquidation of short positions than long positions. About $45.5K in short positions were liquidated in the past 24 hours, while only $3.7K in long positions were wrecked in the same period.
It shows short-positions were paying long-positions – an underlying bullish sentiment that could boost the uptrend.
But investors should track BTC’s price action to determine whether XMR could overcome the obstacle at $165.

XMRUSD MONERO Long Bullish can go to 190 USDAccording to our current Monero price prediction, the value of Monero is predicted to drop by -2.32% and reach $ 164.17 by July 6, 2023. According to our technical indicators, the current sentiment is Bullish while the Fear & Greed Index is showing 59 (Greed). Monero recorded 21/30 (70%) green days with 7.04% price volatility over the last 30 days. Based on our Monero forecast, it's now a good time to buy Monero.
Based on data from July 01, 2023 at 20:43, the general Monero price prediction sentiment is bullish with 25 technical analysis indicators signaling bullish signals, and 8 signaling bearish signals.
Technical Analysis Bullish
1 Monero makes 3 weeks Higher Lows and Higher Highs
2 Trend continuation Confirmation RSI
See Circles
10 Nov 2022
9th March 2022
10th June 2022
3 RSI is above 50
4 Rsi confirmation is Bullish
5 Volume is increasing Bullish
6 We have rising POCs
7 Volume Value has been shifting higher
8 Monero is currently trading above the 200-day simple moving average (SMA). The 200-day SMA has been signaling BUY for the last 8 days, since Jun 23, 2023.
The price of Monero is currently above the 50-day SMA and this indicator has been signaling BUY for the last 9 days, since Jun 22, 2023.
The most recent Death Cross in the Bitcoin market happened 30 days ago, on Jun 01, 2023. Meanwhile, a Golden Cross last occurred on Jan 09, 2023, which was 173 days ago.
Based on our technical indicators, Monero's 200-day SMA will rise in the next month and will hit $ 153.22 by Jul 31, 2023. Monero's short-term 50-Day SMA is estimated to hit $ 159.61 by Jul 31, 2023.
The Relative Strength Index (RSI) momentum oscillator is a popular indicator that signals whether a cryptocurrency is oversold (below 30) or overbought (above 70). Currently, the RSI value is at 74.32, which indicates that the XMR market is in a overbought position. The RSI indicator suggests that the price of XMR will increase.
Monero reached its highest price on Jan 9, 2018 when it was trading at its all-time high of $ 593.42, while Monero's lowest price was recorded on Jan 14, 2015 when it was trading at its all-time low of $ 0.212967. The lowest price since it's ATH was $ 26.23 (cycle low). The highest XMR price since the last cycle low was $ 514.43 (cycle high). The Monero price prediction sentiment is currently bullish, while Fear & Greed Index is showing 59 (Greed).
Monero's current circulating supply is 18.30M XMR out of max supply of 18.20M XMR. The current yearly supply inflation rate is 0.86% meaning 156,872 XMR were created in the last year. In terms of market cap, Monero is currently ranked #5 in the Proof-of-Work Coins sector, ranked #1 in the Privacy Coins sector and ranked #15 in the Layer 1 sector.
Highlights
Price has increased by 48% in the last 1 year
Outperformed 79% of the top 100 crypto assets in 1 year
Trading above the 200-day simple moving average
21 green days in the last 30 days (70%)
Trading on Binance
Trading with Euro
Yearly inflation rate is 0.86%
Monero price in US Dollar has increased by 13.08% in the last 1 month. XMR is up 10.29% against Ethereum and down -0.47% against Bitcoin in the last 1 month.
The top-performing year for Monero was 2016 when the price of XMR increased by 2,830.22% from $ 0.470402 to $ 13.78. The worst performing year for Monero was 2018 when the price dropped by -86.72% from $ 349.16 to $ 46.38. The average yearly growth of Monero over the last 10 years is 595.55% per year. Usually, Monero performs best in Q3 with an average of 59.43% gain and worst in Q2 with 11.17% gain.
Risk Analysis
Outperformed by Bitcoin and Ethereum
Down -72% from all-time high
Has medium liquidity based on its market cap
How is the price positioned in comparison to the all-time high?
The price is currently down -72% from the all-time high.
How is the price positioned in comparison to the cycle high/low?
Monero is currently trading at -67.40% below cycle high and 539.17% above cycle low.
Is the price highly volatile?
The 30-day volatility is above 30% and is currently at null%
Does it have enough liquidity based on market cap to volume ratio?
Has medium liquidity with 0.0282 volume to market cap ratio. The current market cap is $ 3.07B while the 24-hour volume is $ 86.46M
Is the total supply high in comparison with the circulating supply?
Over 101% of the total supply is in circulation.
Is the current inflation below 2% per year?
The yearly inflation rate is 0.86% meaning there were 156,872 coins generated in the last 1 year.
According to our current Monero price prediction, the value of Monero is predicted to drop by -2.32% and reach $ 164.17 by July 6, 2023. According to our technical indicators, the current sentiment is Bullish while the Fear & Greed Index is showing 59 (Greed). Monero recorded 21/30 (70%) green days with 7.04% price volatility over the last 30 days. Based on our Monero forecast, it's now a good time to buy Monero.
Comparing Monero against other important technological innovations and trends is one way of predicting where the Monero price could head over the long term. The table above shows what the Monero price would be by end of year 2024, 2025, and 2026 if its growth trajectory followed the growth of the internet, or large tech companies like Google and Facebook in their growth phase.
In the best case scenario, XMR price prediction for year 2026 is $ 3,836.33 if it follows Facebook growth. In case Monero would follow Internet growth the prediction for 2026 would be $ 440.09.
Monero Key Price Levels
Based on today's classical pivot point (P1) with the value of $ 166.97, Monero has support levels of $ 164.34, $ 160.29, and the strongest at $ 157.66. Similarly, Monero resistance levels are at $ 171.02, $ 173.65, and $ 177.70..
Monero Correlation
Over the past 7 days, Monero price was most positively correlated with the price of TRON (TRX), Stellar (XLM), Bitcoin Cash (BCH), Zcash (ZEC) and Bitcoin SV (BSV) and most negatively correlated with the price of XRP (XRP), OKB (OKB), Cardano (ADA), NEM (XEM) and Binance Coin (BNB).
Monero price is positively correlated with the top 10 coins by marketcap with a value of 0.119, excluding Tether (USDT) and positively correlated with the top 100 coins by marketcap excluding all stablecoins with a value of 0.107.
Currencies that are positively correlated with Monero indicate that the movement of one has a statistically significant weight to lead the other in the same direction. For currencies that are negatively correlated with Monero, a move in one direction for Monero would translate into a move in the opposite direction for the negatively correlated coin.
Monero Price Forecast(Probability 69%) This is just a mathematical methode to trade my own accont, Okease note that it is for educational and informative issue, and you should use stops and proper risk and money mangemnt to protect your capital.
Date Price Change
Jul 2, 2023 $ 168.17 0.06%
Jul 3, 2023 $ 169.11 0.62%
Jul 4, 2023 $ 171.83 2.24%
Jul 5, 2023 $ 170.25 1.30%
Jul 6, 2023 $ 164.17 -2.32%
Jul 7, 2023 $ 170.84 1.65%
Jul 8, 2023 $ 166.89 -0.70%
Jul 9, 2023 $ 165.08 -1.78%
Jul 10, 2023 $ 151.52 -9.85%
Jul 11, 2023 $ 158.89 -5.46%
Jul 12, 2023 $ 157.76 -6.13%
Jul 13, 2023 $ 160.38 -4.57%
Jul 14, 2023 $ 155.57 -7.43%
Jul 15, 2023 $ 151.87 -9.63%
Jul 16, 2023 $ 156.14 -7.10%
Jul 17, 2023 $ 155.08 -7.73%
Jul 18, 2023 $ 155.62 -7.40%
Jul 19, 2023 $ 157.16 -6.49%
Jul 20, 2023 $ 156.53 -6.86%
Jul 21, 2023 $ 164.10 -2.36%
Jul 22, 2023 $ 165.61 -1.46%
Jul 23, 2023 $ 169.10 0.62%
Jul 24, 2023 $ 175.47 4.41%
Jul 25, 2023 $ 176.17 4.83%
Jul 26, 2023 $ 179.92 7.06%
Jul 27, 2023 $ 185.74 10.52%
Jul 28, 2023 $ 190.11 13.12%
Jul 29, 2023 $ 183.07 8.93%
Jul 30, 2023 $ 187.35 11.48%
Jul 31, 2023 $ 187.86 11.78%

Downing to Support at $155 | LONG BiasDaily Chart
Monero's ( BINANCE:XMRUSDT ) pulling back to Support Zone around $155
I expect Monero will go up Swing High at $172 and further at $212
Wait and see the next move

XMR, ancient coin | $212On weekly chart,
Monero BINANCE:XMRUSDT is in consolidation phrase.
It's trading at $164.8 now
I expect Monero will move up to $212 to complete 1.0 Fib Ex and 119.5% from $96.7
Wait and see

SELL Monero, Not Quite, Not YetSince monero broke it's 164.60 support level on Feb 9th 2023, it has attempted to break this level in March and April and failed. Monero then retested the support level of 137.60 which was formed on December 28th 2022 and has been testing and holding multiple times.
Fast forward -for the last 6 days Monero has reformed and has been consolidating and holding the now reformed support level for the first time in 5 months
Once monero continues holding 164.60 or 151.90 it will pump. Keep the hodl bag

XMR Appears to be in a Cup and Handle Continuation patternThere is a lot of bullishness in the XMR chart despite everything that is going along globally with politics and economics. For a long time I have watched XMR with the assumption that it may be forming a massive double top but so far that has not materialized
A zoom in onto the handle shows a clear falling wedge which has a bullish bias. There is a double bottom that has been forming late since late January and it seems that the inverse head and shoulders is beginning to perform. I hope for this to proceed rather impulsively in short order and I have my entry at the neckline of the pattern. Price action can squirt right out of the wedge or price may flip the wedge resistance to support with a retest.
The main chart shows some of the other targets in red on the fib or at the full flag pole performance. There is chance that we get a throwback to the height of the cup at about $515 once we reach some intermittent targets.
Price action has found support on both the 200SMA and the 200EMA as shown below. Candle bodies on the EMA and wicks to the SMA. Finding support on such long term moving averages is bullish but also opens price action to test it repeatedly as support before really taking off.
The moving averages are under a weekly death cross so I expect to see some activity at the 50 SMA. Hopefully a nice flag continuation pattern but I can address that in due time.
The main noise in my head about this trade is my intense long term bearishness on equities and how crypto has generally moved in sync with with equities. We don't have the same data with crypto and equities running in opposite directions that we do with say equities and gold or silver. But bullish chart patterns are bullish chart patterns and I am going to trade this bullishly.

✴️ Monero Year Long Consolidation Phase | Think Long-TermSince June 2022 Monero (XMRUSD) has been moving within a sideways channel with a bullish bias, that is, printing higher lows.
A year is a very long time in Crypto and what will happen next is something big.
This long-term consolidation phase can continue, believe it or not, but it can also break anytime.
Once the massive bullish action start, you will wonder "Why didn't I jump in in 2023?".
You will be thinking, "I saw it, it was trading at bottom prices forever and I just ignored it...", not only about Monero but about most Cryptos, that's how market psychology works.
When the time to buy is right, we tend to detach and feel not interested.
Once everything starts to move and euphoria shows up, the prices are bad as they become too high but that is when people want to get involved.
There are many opportunities now but we need to focus on the long-term.
Think long-term!
That should be the mantra when buying, when reading, when planning... Think long-term and success is guaranteed.
Namaste.

Downward Trend and Key Support LevelsOver the past month, XMR has been trending downwards, experiencing a moderate level of selling pressure. This led to the breach of its initial support level around $147, and the price subsequently hit the second support level at approximately $136. As anticipated, there was a positive reaction at the second support level, resulting in a 6% increase in XMR's price. However, the buying power was not sufficient to break through the resistance at the $147 range, indicating a pullback in the ongoing downward trend.
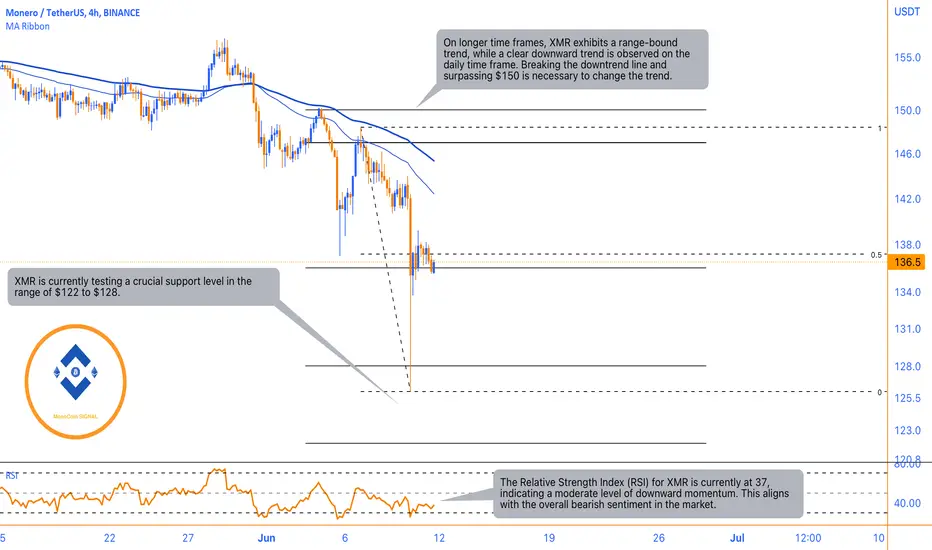
The RSI level for XMR is currently at 37, indicating a moderate level of downward momentum. This suggests that there is still some selling pressure on XMR, but it is not yet in an oversold condition. The RSI level of 37 aligns with the overall analysis, confirming the presence of bearish sentiment in the market.
As the selling pressure persists, XMR lost support at the $136 range and is now testing an important support level situated between $122 and $128. This support level corresponds to the starting range of the last upward movement observed on a weekly basis. It is crucial for XMR to hold above this support range to avoid further downward movement.
Taking a broader perspective, on longer time frames, XMR is currently in a range-bound trend, while on a daily time frame, a clear downward trend is evident. To change the trend and reverse the downward movement, XMR would need to break the downtrend line and rise above the resistance level of $150.
Considering the combined analysis of the price action, support and resistance levels, and the RSI, it suggests that the market sentiment for XMR remains bearish, with selling pressure continuing to influence the cryptocurrency's price. Traders and investors should closely monitor the support level around $122 to $128, as a significant break below that range could potentially lead to further downside movement for XMR.
XMR Potential Ban of anonymous crypto projects !If you haven`t sold XMR here:
Then i will remind you that Monero (XMR) has gained popularity for its capacity to enhance user anonymity, making transactions challenging to trace through the utilization of stealth addresses. However, this aligns with a goal that regulators do not necessarily support in the cryptocurrency space.
A leaked version of a US draft bill has surfaced, suggesting the elimination of anonymous crypto projects. The proposal also mandates that DAOs, DeFi platforms, and exchanges register legally in the United States. This development indicates a potential shift towards greater regulation and oversight within the industry.
My price target for XMR is $96.50.
Looking forward to read your opinion about it!

Monero (XMRUSDT) an 80% rise I won't be talking too much about how bullish XMR is currently. But we just went along quite aggressively considering multiple technical aspects of the current price action. The most important is obviously the weekly break and close above the long-term downtrend trendline. Secondly, we have the price hoovering above the 61.8% Fibonacci level for quite some time now. It is either to go big now or....
We are going in now!

Monero's $130 Threshold: The Make-or-Break for an 80% Upswing💎 Since #XMRUSDT's bounce and rejection of the 78.6% Fibonacci support, coupled with the uptrend trendline, we're seeing the price gravitate towards that trendline once more. This suggests that buying pressure could be ramping up, opening the door to a significant upside potential.
💎 However, this bullish scenario will hold water only if the $130 psychological and technical support level remains unbreached. If this condition is met, we could be looking at a nearly 80% price increase, with #Monero potentially setting its sights on the double Fibonacci resistance at $258.
💎 Our ParadiseClub members should also keep an eye on the nearest resistance at $196, where the 23.6% Fibs intersects with the downtrend trendline.
💎 While less likely, we must also consider the scenario where OMXSTO:XMR breaks below the $130 level. Such a move would be a major red flag for the bulls.
