Monetha (MTH) Breaking Above Resistance (+159% In 7 Days)Here we have Monetha (MTHBTC) which clearly formed a low last week.
We can see a very strong reversal candle in the form of a Doji on the 25-Jan.
We can clearly see a "V bottom" pattern marked on the chart.
The black line on the chart stands for MA200 and MTHBTC is trading above it.
Closing above this level today would send out a strong bullish signal, especially since we have the MACD and RSI entering the bullish/strong zone.
This is only getting started.
We are bullish above EMA10 (0.00000054).
Bearish below.
Namaste.
Monetha

Monetha Is Peaking Up Speed (Can Move Fast!)Many Altcoins are looking bullish right now and growing fast, within days, in two and three digits.
Here is Monetha (MTHBTC) already above all the local resistance we normally take into consideration.
There can be a bullish continuation and prices grow in the range of 67% and 98%, or more.
We don't buy here.
We don't trade here.
We buy when prices are low/near support BEFORE prices start moving up.
Less risk, higher potential reward.
Let's see how it goes.
We are bullish on the Altcoins.
Namaste.

Monetha Price Prediction 10/09/2021Highlighted a couple dif scenarios, Monetha needs to maintain momentum if it will ever reach these heights. Target is .10 cents then .16 and so on Untill.46. My last monetha idea was spot on and this is a very similar setup to how it was setup last time.

Monetha Support Holds, Can Do 200%+ Above MA200 (+Trading Tips)The black line on this chart is for the MA200 indicator... This is a strong indicator for the altcoins market.
When a pair, like MTHBTC, is trading above this line, we are strongly bullish .
When below this line we go bearish .
We focus mainly on the daily (D) timeframe.
We had really good bullish action from January until April and then the correction came... No big deal, we simply sit back and we wait.
Now, prices stopped dropping at the MA200 support.
Above this line, and a higher low, MTHBTC can resume its growth.
We have 200% potential...
This is not financial advice.
Remember to build/have a plan BEFORE buying/trading.
Thanks a lot for your support.
P.S. Remember to always use a stop-loss, the chart signals can always change.
Namaste.

Monetha at the beginning of the rallyshark harmonic pattern:
AB=0.38 XA
BC=1.6 AB
tp1=0.88 XA=$0.43
tp2=1.6 BC=$0.61
tp3=1.13 XA=$1.1
tp4=2.24 BC=$4.7

POA trading opportunityIf bitcoin stays on these levels POA could see the same price action as monetha did yesterday. Goals are marked.

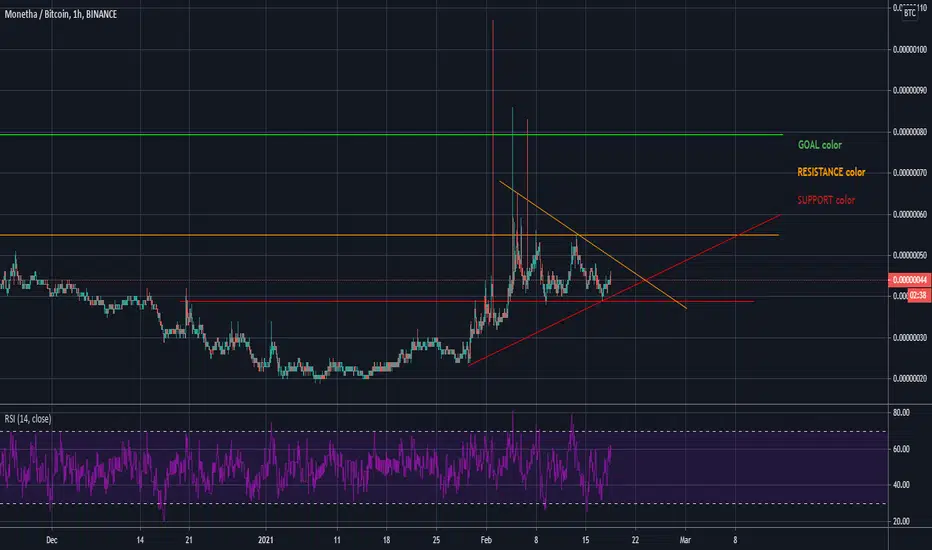
MTH trading idea (short term)Does #Monetha $mth have any additional buying strength to reach first goal line?... is it going to fall to support line? Next time on The Young and the Restless

MTH - going further up or downMTH's pumps gave us some real gains for the last few weeks, but lately MONETHA is pretty much boring token to trade. Are we going up or down? Waiting for resistance line to break.
MTH trading opportunity Smallest market cap coin on binance. Still hasn't been delisted, so I guess nothing is wrong with it :) Goals are marked. trade carefully


Monetha Jumps, Let Me Show You Something... They All Do The SameHere we have Monetha (MTHBTC) printing a huge jump today... Please, allow me to show you something... They all do the same.
Let's see how this chart goes.
We have a low 5-Nov., I mentioned that altcoins vs bitcoin hit a low around this date, from the 3rd to the 6th November, most of them.
We get the first reversal and a bullish wave starts to form...
Then prices start to drop and everybody starts panicking and tells me that I am a joke.
But just yesterday, 18-Nov. MTHBTC ended in a higher low... That is exactly what I keep on saying. Nothing moves straight up, it goes up and down, up and down... Down and up.
After the higher low... Comes the price jump.
Now, I look at dozens of these charts daily and I know that many don't have the time or desire to do the same... So I made it my job to tell you what I see coming from the information that I get.
Many of the altcoins that I keep on seeing daily have a similar chart like this one.
First, they hit a low in early Nov. and now a higher low...
What comes next?
...
THANKS A LOT FOR YOUR SUPPORT!
Namaste.

Monetha (MthBtc) Short Term Trade, Mthshs has occurred and is happening. I think the decline will be up to 70 satoshi. I expect a drop in shs height. then I wait until 110 satoshi. this is an amateur work. it is not an investment recommendation. I wish you good luck to everyone.

Monetha (MTH) Patterns | Next Target Mapped! Here we have multiple patterns showing up on the Monetha (MTHBTC) chart.
We have the "cup" pattern.
A "Falling wedge".
The "fake breakdown".
And also what we call the "ascending channel".
All these patterns have something in common, they are all bullish in nature.
We also have increasing volume showing up on this chart, as well as a bullish MACD and RSI.
MTHBTC is likely to continue growing.
We remain bullish above EMA50.
Remember to always do your own research and build a strategy before you decide to trade.
Thanks a lot for your continued support.
This is not financial advice.
Namaste.

MTH/BTC - a lot of talk about the coin.a lot of talk about coin in different chat rooms.
I used to be able to get a good profit percentage.
Split 1% on the deal.
buy after level breakage

Monetha Good Volume, Can Start GrowingGood Tuesday my beloved cryptocurrency trader, here we have MTHBTC (Monetha), this altcoin pair likes to move strong.
Right now prices for MTHBTC are moving above EMA10, but the stronger signal is the high volume.
We are seeing really good volume today and a long-wick that almost hit MA200... Monetha is getting ready to grow.
Namaste.

MTH/BTC longWe have a good support level of about 100sat. also if you look at the long timeframe, then we see something on the likeness of the 2nd bottom. I think that soon we will see how the price touches the 50th moving average on a weekly schedule. And this will be approximately 100% growth. If we do not keep support at current levels and go below the global bottom by BTC, then we can expect a decrease by 70-80sat. What I think in the near future is unlikely since the market has come to life a bit and is ready for altcoins to catch up a bit with BTC. Also, if you analyze this asset for cyclical growth, then you will see a certain pattern that is in the number of days between the pumps and correction. But this argument is so-so. I'm waiting for x2

MTHBTC formed bullish Butterfly | Upto 59% bullish move expectedPriceline of Monetha / Bitcoin cryptocurrency has formed a bullish Butterfly pattern and entered in potential reversal zone.
This PRZ area should be used as stop loss in case of complete candle stick closes below this zone.
I have used Fibonacci sequence to set the targets:
Buy between: 0.00000125 to 0.00000108
Sell between: 0.00000139 to 0.00000172
Regards,
Atif Akbar (moon333)


Monetha High Volume Break Of Resistance | 100%+ PossibleMonetha (MTHBTC) just produced a high volume break of EMA10, EMA50, and EMA100, all together in one candlestick.
This can be a very strong signal if prices can remain above EMA100... Last time MTHBTC was above EMA100 it produced massive growth (left side of the chart).
The way the chart is looking now, the potential if the bulls follow up is much higher... We can see a move of 100%+...
Namaste.

Monethabuy:
0,00000152-0,00000200
sell:
0,00000268
0,00000427
0,00000550
0,00000692
0,00000820
0,00000984
free

Today`s ALT!!! MTHBTCBINANCE:MTHBTC
Exchange : Binance
Coin: MTHBTC
Buy Zone: 0.0000019~0.0000018
Target Point: 0.00000202/ 0.00000218/ 0.00000228/ 0.0000024/ 0.0000027
S/L: 0.00000165
Risk: HIGH
Term: Midlle - Short
It broke Hard Trending Line, but there wasn`t Big Pumping
It kept Symmetrical Triangle in spite of Bitcoin`s movement
The Volume is almost down
It`s time to Pumping !!!
Be careful in purchasing because there is wide gap between BuyZone and S/L
=====================================================================
Today`s ALT is that information is raised regardless of the Coin market situation
So sometimes there`s a high risk trading
Investment is your responsibility.
I'm just providing about coin`s information
=====================================================================

Today`s ALT!!! MTHBTCBINANCE:MTHBTC
Exchange : Binance
Coin: MTHBTC
Buy Zone: 0.0000019~0.0000018
Target Point: 0.00000203/ 0.00000217/ 0.00000229/ 0.00000241/ 0.0000027/
S/L: 0.0000017
Risk: MIDDLE - HIGH
Term: Middle
It had borken Hard Down Trending Line and Big Symmetrical Triangle
But there isn`t big pumping
If it`ll break Small Symmetrical Triangle, it`ll start big pumping !!
=====================================================================
Today`s ALT is that information is raised regardless of the Coin market situation
So sometimes there`s a high risk trading
Investment is your responsibility.
I'm just providing about coin`s information
=====================================================================

MTHBTC (Monetha) Daily Breakout | Updatei uploaded chart earlier mistakenly i uploaded chart with wrong title mftbtc .. i apologize for this
our stop loss didn't hit so we are holding this coin with our previous stop loss
1) Just because of weekend out coin become much more stronger with support
2) RSI Taking Support
now our entry changed
Buy : 182 - 187
Stop : 175 ( Old Stop loss)
Target : 5% to 40%
