100M per btc in 2030-35 I think that if bitcoin reaches 100M+ in 2030-2035 range it is something that will not surprise you.
Moon

Bitcoin i think this makes sense? Saved for later, i think this makes sense. I think we will go around $200-400k this cycle top and next bear bottom could be around $30-60k.

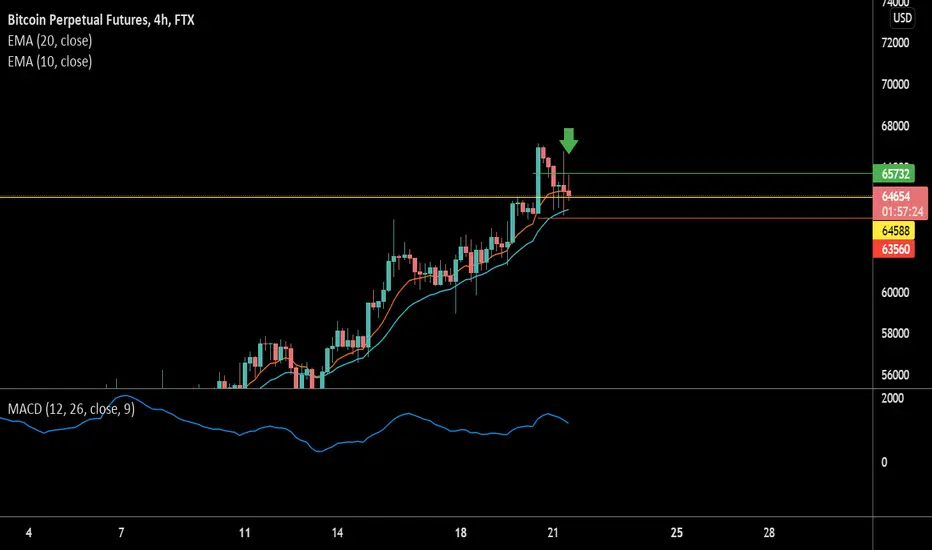
Potential Entry Into Bitcoin! 🍹If this candle closes green, I will be looking to enter into BTC when the price strikes my green line with a stop loss on the red....
Manage your risk 😉
Gala Next Axis infinty ........... to the mars Disclaimer : It is not a financial advice am not a professional I don't take responsibility for your loss
Just for educational purposes.......
Here we are back on Gala Next axie infinity........
Congratulation to those who bought the dip ..................
He fellas What's Up I hope You Are having a Nice day ALTS Turn Green I hope Your Bags are Full Because Santa is coming this time with real gifts riding on bulls
This is your host k9100............................ back at your service
We have been tested with blood, but we believe in project we hold it we support it we nurtured it soon 1-3 usd it's you Guys who believe in project it's you guys Who hold gala in difficult time soon you will be rewarded handsomely
Buy zone along the yellow line
take profit zone on red lines 15-25% only on red lines
thanks for love and support, we will reach our destination this season
Money is flowing into alts take a good sleep tonight you have done well
red resistance zones green support zone Stop loss where 90% don't expect
always remember to take profits
................................................................................................................................... har har mahadev

GME TO THE MOON SOON! 🚀🚀🔮 LFGThe long term consolidation is fucking insane. It is wedging at a very nice form.
A breakout could happen before November 15th.
The SEC report stated that barely any shorts have covered...even after January's rally. (Only a few small shorts covered but not the big ones) Shorts never covered because brokers took away the buy button. Thus shorts didn't need to cover because everyone could only sell and they'd be stupid to cover.
What is different about this time? People are buying actual shares in their own name... now leaving it in the hands of retailers rather than brokers. Meaning if prices go as high as 400 again, shorts WILL cover and skyrocket a shit ton even if brokers restrict trading again.
What's more is that we saw a massive cup in the middle of the wedge. I may be grasping straws here but we are in on overextended handle the just needs to break the resistance for it to fly. While this is a slight stretch, on cannot deny the wedge formation is looking good.
GME to 1k🚀
APES NEED TO GATHER. LETS GET THIS BREAKOUT AND FLYYYY


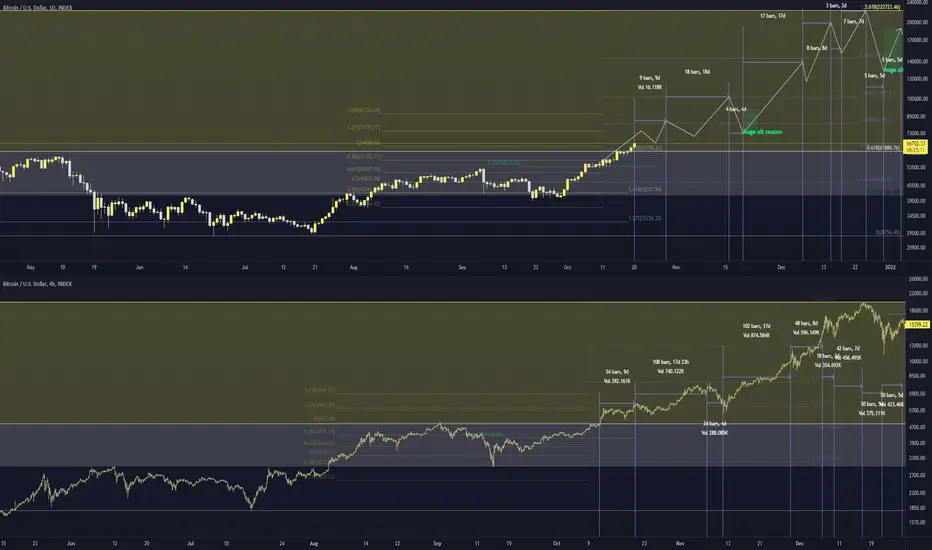
If 2017 were to repeatI'd rather not go into depth again how I've gotten 222k as a target, just see my related ideas.
The idea here is that we've been following past cycles pretty closely. Beyond a certain point in 2013, there's really no clear path apart from UP. There is one hiccup in the first week of 2013's Nov. and also in 2017's Nov. Keeping the timing to scale, this would be Nov 16th where we see a 25% retrace. Past that, 2017 shows some more hiccups that I've drawn out for us to watch for if we reach 222k.
Don't take these hiccups to the bank as they're all determined by a top that is at 222k, and I have targets anywhere from 207k to 300k, which would change all of those projections. I don't have a crystal ball, so don't play these things as if I do.
If you're not in yet, don't fret. We seem to retest 67k once more before continuing further up - that's when I'd suggest getting in.
My current target before a 13% retrace is roughly 75k or so. See you there.
But if you'd like to see this chart in more detail, just click the megaphone icon and 'make it mine' so you can manipulate the chart yourself & see the prices and times to the T.
👏 This 👏 time 👏 is 👏 no 👏 differentEvery cycle finds a local top from the 1.618 log previous cycle based fib and capitulates afterwards. That marks the top of the range.
Every cycle finds a local bottom at the 0.5 log cycle based fib. That marks the bottom of the range.
2013 & 2017 Show reversals at the same milestones: These milestones being the 1.618, 0.5 log cycle based fib, July reversal, Sept. reversal, and an October 1.618 log fib crossing.
2021 doesn't appear to be any different...
✔️ We've struck the 1.618 log previous cycle based fib and capitulated
✔️ We've reversed at the local bottom (0.5 is hindsight but there's a number of other ways to determine this see related ideas)
✔️ We've reversed in July
✔️ We've capitulated and are showing signs of a reversal in September
So... is the bottom of September in?
Do we cross the 1.618 sometime in October?
Is this time any different?
I say this time is no different.
See related ideas.

BTC GOING UPWhile everyone on here is just drawing a bunch of random squiggly lines with a paintbrush and drawing big green up arrows right beside big red down arrows... and saying, "the price is either going to break out and go way up, or it's going to break down and go way down," I figure that I would add my own randomly generated "dice throw" of an analysis based on absolutely nothing but my hopes and fears and emotions.
THE PRICE IS GOING UP, YOU FOOLS! BUY!
You will be the same thing about a year or two from now when the price drops down to $50k-$60k from $350,000 anyway. So why not buy it now and watch the ride up. You know you're going to miss the big sell opportunity at the top because you will all be full of hoping and endorphins and dreams of many Lamborghinis by that time... But hey... At least you'll get to enjoy the ride up.
From a technical perspective, the 1 week RSI has not reached even 70 yet. While the daily RSI is at 70 already, that only confirms a strong uptrend on the daily chart. The first major resistance past the ATH is at about $85. It will most likely get rejected there since it appears we will NOT be rejected at this $64k level.
I predict a bounce back to $64k after reaching $85k. So undoubtedly you will get another chance to buy at this level ONE MORE TIME before the fun ride to $350k.

Still disbelief before biggest pump Looks for closing Wave 2 around $85-95k before next and last dip before full send to 200k and above. Still on track

Bitcoin is primed and ready for some action As you can see. Btc was shut down last time a similar structure was formed. I don't expect a 50% but I do expect a proper 30% at least. That brings us all the way down to 38. This could hold here around 40s, but the way it shot up today was too fast and it will come right back down to 40, 41k at least. Depending on how we bounce we may go lower. 43k is crucial as its the 20 week MA. We have flipped it from support to resistance so we could actually go back to bear market status IF we lose it. The golden cross is another thing i want to discuss. It is going to fail. It will death cross. Then it will re cross golden in oct or nov. This has happened many times in BTC past. I expect a bull run later this year.

~300k Bitcoin Blowoff Top Price Prediction 🚀A 300k Bitcoin in a few months is a reasonable prediction. Aiming for 0.786 on the fib. See you all at 300k.

15 minutes short opportunity This is based on my previous weekly and daily analysis.Risk what you afford to lose.

BTC Local price targets till 2022BTC Local price targets till beginning of 2022 BTC Local price targets till beginning of 2022 BTC Local price targets till beginning of 2022

Key FIB levels for the upcomming parabolic moveThese are key fib levels which we will hit in the upcoming parabolic move.

LONG $SPCE TO THE MOON? $SPCE ENTERING BUYING ZONE.
Swing trade
- LOAD UP BAGS AT THE GREEN ZONE.
- AVERAGE DOWN if we go to the bottom of the green box.
- IF PRICE ACTION IS CONSISTENT, expect a bounce to ATH (Red Box)
- STOCH RSI HIGHER LOWS.

$BTC/USD: Moon Trading & Technical AnalysisBlessings dear traders of the Moon Trading family! I truly hope everyone is doing well and being extremely profitable! A profitable trader is the one with a great risk management and who knows to cut loses sooner than later. Be that trader for the sake of your millonaire future you!
That said, let's check what BTC has been doing! We can see that the Fibonacci retracement is amazing when applied to BTC, specially in bigger timeframes. The deepest support is at the level of the Golden Ratio which is $48.000. The much easier support to retest is at the level of the 0,236 Ratio which is $57.577.
What to expect on this powerful Aries Full Moon ? Well dear traders, usually the restest before going to the Moon is at the Golden Ratio, which personally I think is too far away by now considering all the extremelly bullish news of the coming BTC's ETFs. However, that would be a fall of just %20 ish from the current price, which is %5 less than the last Full Moon, so in theory it could easily happen.
I will be a little bit more conservative considering how bullish October usually is and I will go with a retest of the 0,236 Ratio ($57.577) and possibly the 0,382 Ratio (around $54.000) being %6,66 and %12,12 of average fall in both cases, respectively.
Remember dear family, never under any circumstances try to cheat the market or go against it, you will always lose. Instead of that, just wait for several confirmations before going short or long. It is much better to wait to the next Moon if you miss one, than to cut the trade with big loses because you didn't follow your plan or even any plan at all.
Plan the trade, and always trade that plan! Don't speculate, don't gamble, don't do spiritism with trading, this is a financial and comercial science that you must study. Set a goal, 1 hour per day, or 2 or 3 or 8 if you can, take it seriously! And you will see your profits become x10 greater that your 9-5 job. Once you are there, you keep doing the same, but now creating generational wealth and financial freedom not only for you but also for your entire family!
Peace and be safe!

kava we can see soon to 10-12$Current trend of kava
I am bullish right now and soon we can see breakout

Selling opportunity for next week 😉This is how i project Bitcoin daily chart for upcoming week.Ready for bloodbath 😎

btcusdtBitcoin has excellent conditions for climbing,
but be sure to earn in the range of 83834 to 87830 saves.
Finally let's go for 100k!!!!!!!!

A big correction and consolidation phase for days coming for NUNot a financial advice
Green line buy zone red line Resistance zones
buy zones
(1) 1.08
(2) 0.85-0.85
Set your stop loss where 90% not expecting
Don't chase the brake out
holders at top be patience, soon you see price of 3-4 usd
Hit like and comment your thoughts on this

Gala trend Hold it at the end of this year gala to the moon Not a financial advice
BTC is taking the lead soon time will come for alt coins
congratulation to those who buy the dip at 0.85 or below, still enter point shown in chart
buy at high demand zones

