Pintrest ideaBach G minor - a melodist bullish harmonically areas, we wait for the price to fall within one of these ranges and start buying upon bullish sentimental power, wax on, wax off.
Moon

ROSE TO THE MOONROSE TO THE MOON
After the BREAKOUT
Profit can be between :
50% and 100%
in the next few days
Just be ready

Cardano bullish?
looks promising to me just posting this to get your thoughts on ADA ...
as a long term target I'm looking for 3.6, maybe not that high but definitely going somewhere
still has to show more bullish behavior though
Price is stuck in a narrow area, volume getting lower and lower.. getting ready for something big
Not a financial advice at all do not listen to me

TEL/USDT 379% GAINS!!Tel/USDT
We can see this triangle tightening up, and comparing this to its previous step up its certainly not one to miss.
Buy in is anywhere in the triangle zone (green rectangle)
SL just downside of the triangle (red line)
My main target is 379% of where we are at the moment.
This is a trade that will take place over a couple months im expecting.
This is NOT financial advice, trade at your OWN risk.
Please leave a like and follow.
Take care.

Moon cycles and BTC , UpdateUpdate in this popular trend. BTC can chill for a few days before keep going.


This is it guys, Let's go to the other side of the moon!Ive got my short boots on
Here is my positon:
prnt.sc

ALCX MAJOR BUY OPPORTUNITYsolid fundamentals, tokenomics and technical setup. this coin is currently trading below the $350 initial launch price and is in my opinion one of the best R:R setups going right now in the DeFi space. a further catalyst for upside rally is the imminent new all time high on BTC, which will likely initiate face melting pumps across the market early into the new year.

Btc lets go! Next stop Mars!Lets keep it simple, Mars then Jupiter.
all started with a pizza, then traveled across the globe via the silk road, then blasted to the moon and back, next stop mars.

Just a possibility2017 played similar games. This is just a possibility, not advice.
So 65k should be the first optimistic target.
49k first realistic target.
31k first pessimistic target.
Beyond that, who tf knows

NIM - ready to start1. The first and second waves are finished, the 3rd wave is coming soon
2. Strong divergence on RSX
3. Breaking of the descending channel
4. The coin has a good fundamental and very undervalued

The time has come or DGBAfter the btc movement it s time to release DGB. I am gonna hodl it until december.

$ETH/USD: Moon Trading & Technical AnalysisWhat do you people think of this W-pattern on the 1D chart for Ether? Will it play out for you? What did it happen the last time you saw this W-pattern on a daily timeframe?

$BTC/USD: Moon Trading & Technical AnalysisWhat do you think? Cup & Handle in the 1D timeframe? If this happens, $ETH will follow and then the altcoins!

55k to 48 retest?up a ton this oct/nov but still planning on retest to 48-50k on the way up because moon phases :)

$130 entry on solanaall the L1's look heavy, complacency bounce on SOL pretty clear, hoping for $130 entry

Poly wanna cracker welp i called the pump from 30 cents.. I called the next pump back to 1$ and now I am calling it again. This is about to pamp sick within the next few days and at the very min hit 1$, but I suspect we are taking on ATH.

$BTC/USD: Moon Trading & Technical AnalaysisDoes this look like a Cupe & Handle pattern on the 1W chart of Bitcoin or is it just me? If this is so, October will be UPtober for cryptocurrencies.
What do you think? Last time I've seen this the prices reached the Moon.

AMC most probable playout structure. finalized?!You got to pump it up
Don't you know? Pump it up
You got to pump it up
Don't you know? Pump it up
You got to pump it up
Don't you know? Pump it up
You got to pump it up
Don't you know? Pump it up
You got to pump it up
Don't you know? Pump it up
You got to pump it up
Don't you know? Pump it up

shiba inuelliot wave count approximate on shiba inu
as long as BTC is bullish this is my shiba inu wave count

Holy GrailThis isn't everything, but it's still a lot to unpack. I'll try to sort it out below for you.
Let's start with any cycle beyond the 2011 since I use previous cycles for some of these fibs and 2011 doesn't have a previous cycle.
The faded red, 0.5 fib: This is the log-based, direct middle of the full bull market of each cycle. You can see each cycle goes above it and retests it to mark a distinguishable milestone identified by the green bullseye icon.
This goes without saying or even drawing it out that the 1.0 fib of this 0.5 fib trendline marks the top of that cycle seen in green.
This may beg the question 'how do you know where the 0.5 fib is before the top is in?'.
Let me explain a few ways that do just that and also reinforce the validity of that idea.
Hiding beneath that 0.5 fib from 2013 and cycles beyond that is a 'predictive 1.5 fib' in bright red that is always very close to the 0.5 cycle fib noted above.
You may be wondering how I got this predictive 1.5 fib.
1: Draw a log 0.786 fib from the cycle top to the following cycle low
2: Draw a log 1.5 fib from that cycle low to the 0.786 fib we just drew seen in white.
Based on how fib sequences work, this 1.5 fib marks incredibly close to the 0.5 fib
Based on what we know about the 0.5 fib being half the cycle and thus identifying the 1.0 fib as the cycle top, you can simply double the predictive 1.5 fib with a 3.0 fib to create a predictive 3.0 cycle top fib as marked by the faded brown line.
You can see in 2013 and 2017, you didn't need to see the cycle top to predict it.
To further reinforce the consistency of the 0.5 fib, the predictive 1.5 fib, and the cycle tops identified from those placements, you can see the faded blue 1.618 nonlog fib sitting right next to those other two 0.5 and 1.5 fibs.
This is marked by drawing from the previous cycle high to cycle low. This identifies a local bottom between all cycles including the current one.
To even further reinforce consistency of my predictive fibs, you can use the same fib drawn from previous cycle high to low but in Log to draw a 1.272 & 1.618 that I've talked A LOT about since May. This is a range that's pretty well defined by two distinguishable points of contention.
Using this same fib that identifies this range, you can draw a 2.272 fib that marks just shy of the cycle tops.
To even FURTHER reinforce consistency of my predictive fibs, I've drawn a fixed range volume profile across the cycle low to the cycle high (so far).
You can see each cycle reaches above the 1.618 fib with low volume, and we had less than a days worth above that fib so far. & the volume profiles show a pretty distinct pattern that I predict we have yet to finish.
2013 here
2021 here
This is an exhaustive way of providing evidence that could have arguably determined the 2017 top before it was in. We are currently respecting these fibs I've laid out. Is it going to change course all of a sudden?
I'll let the market decide.
There are other cyclical patterns I'm seeing that I won't dive into but you can see in my related ideas such as 'This time is no different'
With the assumption that these patterns aren't just coincidences, I've drawn a range of predictive cycle top numbers as follows:
-based on the 0.5 fib being drawn to the retest in January, the 1.0 fib sits at 243k
-based on the predictive 1.5 fib, the 3.0 fib sits at roughly 264k
-based on the 2.272 fib which was shy of the past cycle highs, this fib sits at 207k
So there you go... 3 different ways that have consistently determined cycle highs & thus why I believe we'll reach at least 200k this cycle.
This'll likely be copied by big names in the future and claim it as their own, so please help me out in crediting me when you see the unique parts of my work copied on this and other platforms.
(unique parts such as the predictive 1.5, the 0.5 retest argument, & unfinished volume profiles)
Tips are welcome <3
You can see some of this work in action by watching my related idea '259k bullmarket top & how'
Some other TA's work to appreciate:
@fikira12
@TradingShot
& My wonderful mentor
@ianrdouglas

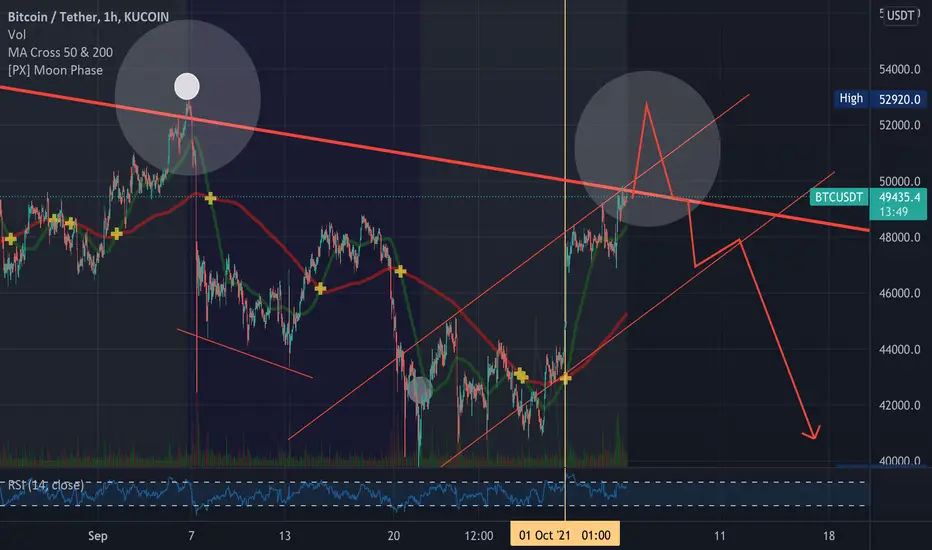
BTC to 53k on October 6 before correction?BTC almost always peaks close to the new moon and hits a low around full moon. Last new moon ,the high was hit just 2 hours after new moon and then fell sharply. This new moon is especially powerful because we have Mars exactly conjunct the new moon and Uranus very closely aspecting as well. You can see how the pattern being built last new moon is quite similar to this one.
This combination of planets seems likely to delivery significant volatility so whichever way it goes watch for the unexpected.
The doggo going out ?
After all the fomo on DOGE and SHIB this year, le price is finally in consolidation mode, if a break out has to happen, big chances it's from here.
Easy to manage the risk when price break the trendline.
+ Bullish divergence on the RSI as you can see.
Want to see more set ups like this one?
--> Join us at Subverto Trading Club !
