DCA on DOGEI'm positioned on DOGE from my DCA zone.
I'm expecting new highs for 2024/2025, be patient.
Moon

Bitcoin Bull Run Brewing? Weekly Supply & Demand Analysis!Hello Traders,
Critical Zone Breakout from Supply Zone Indicates Potential Upside Momentum, While Failure to Respect Signals Downside Pressure Ahead.
We have one Demand Zone, and 2 Supply Zones. If The Price Breaks The Supply Zone, Take Entry While Retesting OR Pullback of The Move Otherwise If It Respects The Supply Area Then Look For The Short Entries!
Please Note That The Only Purpose of The Information On This Page is Purely Educational.
I Would Welcome Your Participation And Support in the Form of Likes, Comments, And Follow us to Offer Some Encouragement.
Thank You.

UNISWAP TO 14$ ??Original entry Trade set up:
- Adam and eve double bottom at the pcz of a harmonic - noted not a formal one but still a great shape and perfect 886.
- Massive bullish divergence at the adam and eve bottom.
- Clear rounding suggesting vast accumulation.
Uniswap has been one of our favourite picks in the community, it just trades really well. We have been holding it since the Adam and Eve bottom and it hit our first major target a few days ago.
We posted a trade set up yesterday that we took and already hit our first tp on, with 10x leverage. We are looking to hold that leverage position for a few days potentially trading it up to our other targets.
This post is more of a case study as we are off our entry now.

$DASH is at 2019 LowsForgot about NASDAQ:DASH ?
Seems like a good entry for me, expecting 30$ as absolute bottom.

Winner winner Sol to pay for my Dinner!Hi All,
Sol has finally broken free from it's shackles in the $130, breaking out into the late $140's before coming back to retest.
As you can see there's a hidden divergence with the confluence of an inverse H&S.
I expect the next area of resistance to be in the $160's.
If you zoom out into the weekly you can see Sol's just broken out from a multi-month inverse H&S. If it plays out Sol' price action should move to the mid $200's without too much trouble.
Cheers
BB

Exactly the same as doge coin 2020, at least 2000% profitExactly the same as doge coin 2020, at least 2000% profit
Be ready for turbo flight
Elon Musk

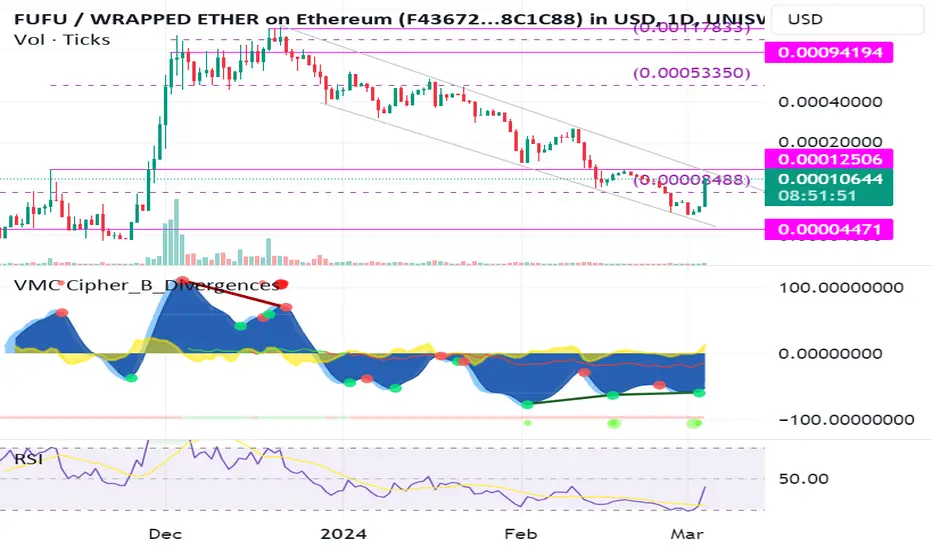
FUFU USD - PUMP IT UPBTC had a massive run up to 65k. Limited long positions have been liquidated on its way up. Profits are being taken and money starts moving to "bigcap" Alt coins. At some point, profits from these "bigcap" Alt coins will start flowing into "lowcap" Alt coins. The winners curse pushes money outside their comfort zone into projects with crazy MEME names. The potential upside is out of this world because of the "lowcap" and leverage effect from people's previous wins. I went looking for the best "lowcap" crazy MEME project to shoot to the moon and beyond and found FUFU.
VMC Cipher_B_divergences shows 2x bullish divergence on the daily timeframe. BUY signal
FUFU has been in a downward parallel channel for more than 2 months. Confirmation when breaking out to the upside (and retest).
General risk assessment:
- The rug pull risk of this project seems limited, to the extend that one can analyze the concentration of holdings by a single instance on etherscan.io.
- The project has an active and engaged team which cover all aspects you would want to see in a MEME coin project, support is shown through the open community on TG
- The coin is easily accessible via MEXC, Bitmart or Uniswap to retail traders.
- Prices below 0.00 ... are attractive because you feel like you can buy many for cheap.
+ The continuously reducing supply is an interesting MEME play, the AI buy/sell bot brings liquidity into the system.

Trade Opportunity - MOON COINMartyBoots here. I have been trading for 17 years and I am here to share my ideas with you to help the Crypto space.
QUICK will have have a nice move in very near future but watch the video to find out when it can moon . Very important information
It has very good structure and price action , it reminds me of how many other coins set up in the last Bull market before it went parabolic and of course similar to AERO and other ALTs that just mooned
Please watch the video for more information
have a great weekend

CAN TURBO GO FOR THE NEXT 100%? CYCLE TRENDTURBO seems one of the volume coins of the moment but it needs a confirmation trend after the last 50% increase.
We will follow TURBO to see if there are possibilities in trend.
It's a high risk to enter coins when it's already pumped.
It seems that turbo has an unexpectedly strong cycle trend.

🚀🚀🚀 Bitcoin is unstoppable! 🚀🚀🚀
We are witnessing history, fellow zoomers. Bitcoin will smash through 70k and it's not stopping there. This is the future of money, and we are the pioneers. 💯💯💯
Don't listen to the boomers and the fudders. They are scared of change and innovation. They don't understand the power of decentralization and cryptography. They are stuck in the past, while we are building the future. 🙌🙌🙌
Bitcoin is more than just a currency. It's a movement. It's a revolution. It's a way of life. We are not here for the short term gains. We are here for the long term vision. We are here to change the world. 🌎🌎🌎
So zoom in, zoom out, and zoom on. The moon is not the limit. The sky is not the limit. There is no limit. Bitcoin is infinite. Bitcoin is eternal. Bitcoin is everything. 🔥🔥🔥

WAXP NOT FAR FROM THE BREAK POINTThank you for reading this update.
WAXP seems to be at important level, and we will follow ifs able to break in the coming time frames, this could means high price actions if it can be done.

Last minute to buy SOL We have a beautiful wedges pattern on the Weekly and daily.
We are 130% from a time high where BTC is at 20% from ATH and ETH is at 50% from ATH. So I expect SOL to catch up.
We have 2 resistance on our way to the all-time high

PHM is going to see some massive support jump in2 massive trend lines on the bottom side of price, one of which is likely to spring the price to at least 95, and possibly even 130. Even if we drop past 63, there is still price support and a likely chance you'll see price jump from these levels. This stock is massively bullish.
These trend lines are BIG. There is potential to see the price move quickly, and there is even more potential to see it reject that top trendline.
It's close for sure, I think these next few moves likely occur over the next few days to weeks. So you could see some up and down getting ready for a bigger move to the upside.
There is so much support layered on this chart, it's hard to be a bear in the long term.
Buy zone is somewhere between like 65-54.
I draw snakes on charts.
thank you for looking.

SRM could blow you awaySRM is showing a great amount of accumulation and if this level holds then we should see significantly higher prices.
Whoever is buying this should look to accumulate at this level for the next few days/weeks, when resolution comes and the accumulation period is finished then this asset could really explode.
Having said that, it is a previous FTX token that has always been a loser and only really seen downside. The technical aspects are all there and thats why we have taken this trade in the community, however, knowing that it is high risk.
We will update over the next few days.

QREDO THE NEXT MOON COIN : IT START WITH BUILDING!Thanks for reading this update.
QREDO seems an interesting coin where data shows that this can be the bottom to new highs.
We know from more trends that whales try to increase always from the Bottom trend.
We see this coin able to break in the coming times.
Data shows that this coin can do the unexpected increase '
This coin did enter a long-term stability trend, but there seem some changes going on in the coin.
Soon more updates.
This is not trading advice.

Crazy potential coin!I shared a chart about APP some weeks ago, and today i added some more Moon App coin to my bag. The potential is crazy for this coin, it can easily 200x from this price. Community is growing, the app is getting bigger and Moon APP 2.0 is coming (CryptoForexGem), and all is based on the INJ ecosystem. Looking at the chart, we are support, i see a possible deviation, and 0.057 is the first target, but i will hold this coin for the next coin.

TNXP: Tonix Pharmaceuticals, TIME FOR PROFITS?!? ;)What's up my financial amigos and amigas! Hope all is well. Haven't posted in awhile but thought I'd share this: TNXP. Pharmaceutical company with decent history and negative earnings but continued improvement and growth. Working on approval from FDA after successful phase 3 trial of Fibromyalgia drug (among other projects).
Obviously, this is a more risky stock/company (and of course, I do enjoy a good gamble). This could certainly plummet more and/or result in being stuck in longer term position than desired. However, based on prior patterns of "mooning," coupled with my charting projections and current positive "news," I think it's time for at least a 100% pump.
We'll see...not financial advise and do your own research (and send me 10% of profits...jk, sort of).
Projection: >10 trading days for 50-100+ percent
Good luck trading

PayPal new crypto … if I were you buy it right nowNew crypto and it is a stablecoin and it’s already being launched. Just buy it for 1$ or go all out like 50$ or 100$ at least and I bought for 5$
Don’t miss it .. this is the chance to buy it now or see you later

ETH/USD POSSIBLE BEAR TRAP?!?!BITSTAMP:ETHUSD
🚀 Ethereum Update: Breaking Free from the Bear Trap! 🌕
Hey Crypto Traders! 🌐
Exciting times in the Ethereum market as we witness a breakout from the recent bear trap. 🐻 But don't fret, Hodlers – the charts are flashing some compelling bullish signals!
📈 Key Technical Indicators:
Waning Moon Bullish Signal: The waning moon is casting its bullish glow, signaling a period of consolidation before a potential upward swing. 🌙
100 Day EMA Bounce: Ethereum bounced off the 100-day EMA, showcasing strong support.
MACD Cross Confirmation: A bullish MACD cross adds weight to the positive outlook.
💡 What's Next?
Keep a keen eye on the green trend line. If Ethereum breaks above it, we might be looking at new heights. The waning moon, coupled with technical indicators, paints a promising picture.
🌐 Stay Informed, Stay Ahead!
#Ethereum #Crypto #Bullish #ToTheMoon #Breakout

MOON. Fly me to the Moon.Not only is SocialFi sector of crypto new, but MOON tokens and all of Reddit Community Points are a revolutionary concept, especially coming from a multi-billion dollar Web2 social media giant like Reddit. Reddit Community Points are their first steps into Web3 world and at a very early stage. Regarding TA, there is one very strong resistance level at $0.08 and has historically been global price support. We can go there and it will be a 26% drop... This price drop possible with a deep global Bitcoin correction and will only give a signal for averaging your bag, but not a sold out. On the other hand, price may experience a 45% rise to the moving average, which it has not touched for about three months.

Filecoin About To Propel To Mars? Please Whales, Dump It More!The filecoin chart looks incredibly sexy.
MEGA discount from ATH still applicable.
50 Weekly MA turned into support? Which also has confluence with other important horizontal levels (previous resistance).
The only DePIN coin with MEGA LIQUIDITY that has not pumped at all... yet. Personally, I hope whales will dump it more and keep it low for many more months so I can buy even more! Probably the best kept secret. Anyone with half a brain is loading up their SPOT BAGS while it is still CHEAP AF. Don't use leverage for whales may try to shake you out/liquidate you before they send this into orbit; just accumulate spot so that whales can't buy as much, put them under pressure!
LETS GO FILECOIN!!!!
THIS WILL EASILY RETURN TO ITS FORMER ATH.

Filecoin Is About To Propel To The Mars! HUGE PUMP COMING!Filecoin has the most bullish chart in all of crypto.
As we can see on this BINANCE:FILBTC chart, TSX:FIL has clearly broken out of its long-term downtrend against $BTC. For reference, this is the weekly chart of #filecoin, which is the most important #DePIN (Decentralized Physical Infrastructure Network) coin in existence, and as is common knowledge, DePIN will be the most important narrative for the coming cryptocurrency bull cycle.
Filecoin has also broken out of its long-term downtrend against the USD ( COINBASE:FILUSD ) – see my other ideas for the chart and explanation for this pair.
As we can see on this BINANCE:FILBTC chart, filecoin has not only broken out, but also retested prior resistance to establish it as support. Not only has it retested the previous diagonal downwards sloping resistance as support, but also a previously important horizontal support level (the dashed black line).
The next important resistance Filecoin faces is the 50 weekly moving average (the thick black line). Once it breaches this resistance level, which coincidentally has confluence with an important horizontal resistance level (orange dashed line), there will be no to little resistance until it reaches the first target, which is the solid horizontal black line (137% gain).
When that happens, incredible momentum will have been established and there will be a 99% chance the rally will continue until BINANCE:FILBTC reaches the 200 weekly moving average (red thick red line), which would translate to a nearly 400% increase against bitcoin valuation from its current level.
As previously mentioned, filecoin has also broken out against its AMEX:USD pair, so you have very little time to accumulate this incredibly BULLISH coin before it explodes to levels you thought were impossible. In fact, there is a high probability you will have already been left behind by the time you read this idea.
FILECOIN TO THE MOON!
