ETH 2022Great time to accumulate some Ethereum. Once eth merges into proof of stake and we get more clarity in the market eth will take the number #1 spot from bitcoin.
During the 2022-2023 Recession I can see Ethereum dropping between $350 and $700, coming back strong on early 2024. Once eth breaks above $6100 I predict eth bottom will be around $2900. For every 15 to 25% increase in price consider selling a fixed percentage and re-invest in those 20% drops. Not a financial advise.
Moonshot


SENSO. Best moment to Buy!The coin corrected quite a bit after the last run. And guess what, that was just news about the beta test of their meta-universe. 1.5 months ago they announced they were about to start a public beta, there are 100,000 registrations. Just imagine what will happen when they officially release the project, with stars like that. It's going to be super hype, you'll see.
The price is lower now than it was 1.5 years ago. And all this time a strong team worked on the project. So I think that the coin is necessary to buy and keep an eye on the project.
No war!

Trade AlertTraders,
Stepping into the waters here as BTC.D chart shows us nearing resistance, meaning that ALTS could play catch up here a bit.
Entry = 3.01
SL = 2.57
PTs = 50 day, 4.50, and 5.17
for a 4.62 R/R
Best of luck all,
Stew
P.S. - TradingView subs you missed my last video here due to TV tech difficulties.

Running of the BullsETH, BTC, and SOL bull run forming. starting to see vol pick up and orders being placed in a pattern I have seen before but can't get in to details about as it would be considered insider info. What I can say Is I think we are about to run up, I don't know when the move will be but for sure they are forming. Pay attention to SOL as I think it will outperform both BTC and ETH, it already is holding better and this is a pattern it has shown. I'm definitely going to get in on this ride. I hold ETH, BTC and SOL along with others. I have a good feeling all 3 will do well in order of performance I see SOL doing best, ETH outperforming BTC and BTC moving up 30% to 60% by years end just to give you an idea how the crypto market is looking to move. Yes we could go down, I give a 30% chance we move down, 70% chance we move up with in 7 days. Consolidation is about to end and a move will happen, just about 8 weeks now in the red, this can't hold and a big move is coming. Note that normally the longer you go flat and consolidate the better chance you have to go down, this is true in stocks, but not in Crypto, because one fact right now, Big money wheals are not in full right now, Fear is over selling everything and people want and need to make money, the fear will end and greed to the up side will start. The tide is in, The wales have been spotted. Holiday weekend in US is going to be a big factor of mood change. Hold the line and take your positions.
Never invest or trade with more money than you can afford to lose because you can and could lose it all, You could also become very rich. Never take anything anyone including myself says online or in person as investment advice unless they are certified broker and you are paying them for a legal service to do so. Now lets all go get rich. Power of positivity ! good luck and have a great weekend when you get to it.

MLN ENZYME READY FOR NEXT PUMPAm gonna try to catch the next pump on MLN/USTD. Eazy quick 2/3x short term.

LUNA the best high risk opportunity 2022I’m one of the few who predicted this pump back up , while i’m up over 10k% on my position i still see a lot of room for improvement. DYOR
I would recommend buying small portions, incase we get a dip just add a lil more. TERRA IS NOT DEAD

We haven't found the gold in PLTR!
NYSE:PLTR
Waiting, waiting, waiting...
News:
Nothing new, just waiting for earnings; not that it matters; it has failed all previous earnings.
Charts:
EMA ( Exponential Moving Average ): Well, like every other stock, the price is hanging out below the 20/50/100/200 EMA and are all pointing downwards! And yes, Nov. 19th death cross is still in action.
TTM Squeeze: Hmm... have we found the bottom? A double bottom will be nice at this point but tomorrow's interest rate hike will decide.
Fib Levels: The price is bouncing off of the 1 fib and holding a major support.
Candle Stick: Piercing or bullish engulfing pattern. Fingers crossed, we might just be at the end of this downtrend.
RSI: Didn't touch 30 but bouncing off of 32/34 range is not a bad idea. especially if TTM squeeze is stabilizing and candles are looking positive.
Pattern: Bullish rectangle and crossing fingers for a double pattern.
History: See related idea before.

Buy Tesla now or waitNASDAQ:TSLA
Are you waiting to buy Tesla like me?
Do you think you can buy Tesla in the $700s?
Are you concerned about the impact of supply chain issues on EV companies?
News: Just a few hours ago, TESLA in a securities filing said that it wouldn’t be able to file a proxy statement until sometime later this year, and did not provide a specific timeline. They missed the April 30 deadline for filing its shareholder proxy after the end of its fiscal year on Dec. 31.
Like you all, I'm waiting on details of the anticipated share-issuance vote which should “enable a stock split".
In the meantime, let's see what the charts are saying (keeping in mind that we have a major catalytic event coming up on May 3rd & 4th; increase of interest rates by 50 basis point).
EMA ( Exponential Moving Average ): Price action is below the 200 EMA (discount buying opportunity) Price is also below 20/50/100/200 EMA and are all pointing downwards! With the 20 EMA crossing the 50 EMA and both pointing downwards, this is bad news; we have a death cross in the making.
TTM Squeeze: Squeezing to the bottom; and price currently at a hidden resistance.
Fib Levels: with the price below the 1 fib and headed towards the 1.618, their is a high probability that if it fails this current resistance (support line) it would go $800 (1.618 fib level). Worst case scenario, we could get an opportunity at $733.
Candle Stick: Summary of last 5 candles equate to a bearish movement. The last pairs look like a Bearish Harami or Tweezer... weird... didn't even allow for the 3 black crow.
RSI: Not overbought or oversold. At 37, it would be nice if it comes down to 30 or lower for a good entry point
Pattern: Down by the sea ... off to the Falling Wedge
History: The stock is down about 19% so far this year... Everyone and their mama is talking about this stock (Every stock split is the poor man's gold)
Company is worth Trillions and the consumer base love Tesla to the point that the have a cult like following... hmm... I really need to be buying the bottom.

After FOMC, next BTC moonshot? I'd like some feedback. Though the chart is just a passing observation, and I haven't been trading for five years, but it seems that markets pump day of/day after FOMC. Could this be a catalyst? Get S&P 500 et al and BTC up-trending to new highs?


KT/USDT Bottom is in?Kt is an metaverse like rpg game , the game client is not launched yet (q1 2023) might be worth to load up some now at the bottom!
Always DYOR NO FINANCIAL ADVICE

DOSE/USDT Possible moonshot!Dose/usdt can make huge gains the upcoming weeks! Keep your eyes close , myself is already invested.
Always DYOR no financial advice

CAW/USDT Ready to moon! Backed by SHIBCaw/USDT is getting listed in a fast pace on many exchanges! Load up ur bagss before we takeoff. In my opinion this is a true moonshot. Always DYOR no financial advice

DTA/USDT ON HUOBI READY TO MOONPlease any updates on DTA are welcome. This token been in a downtrend and is 97% from its ATH. Last couple of days i see a lot of volume coming in. This could be a moonshot and am already invested
None of this is financial advice DYOR

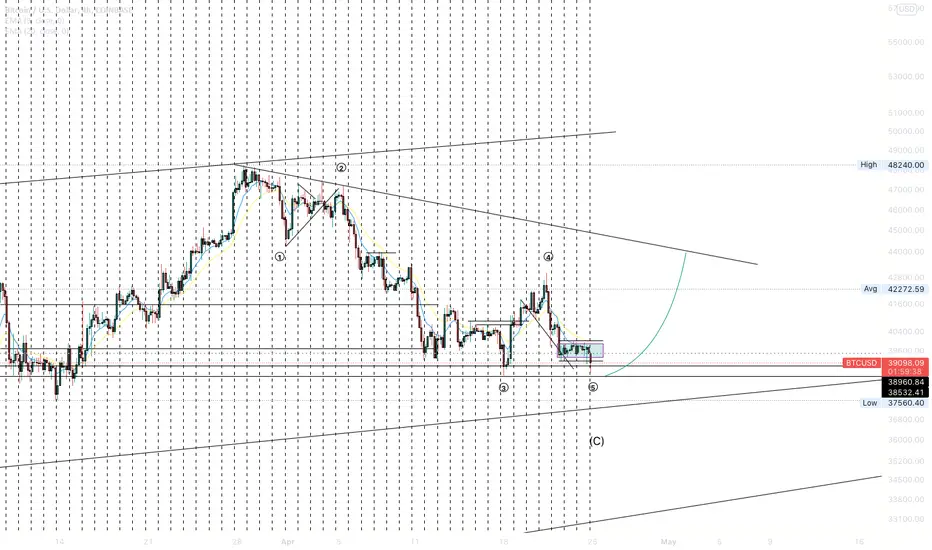
Listen to this guyNothing is certaintly, but I think too probably we are near the bottom. Listen to this guy.

BTCUSDCOINBASE:BTCUSD
After a 12345 correction is time to wait for bitcoin to choose a direction.
This will be indicated by a "Motive Wave"
Motive Waves
In Elliott Wave Theory, the traditional definition of motive wave is a 5 wave move in the same direction as the trend of one larger degree. There are three different variations of a 5 wave move which is considered a motive wave: Impulse wave, Impulse with extension, and diagonal.
EWF prefers to define motive wave in a different way. We agree that motive waves move in the same direction as the trend and we also agree that 5 waves move is a motive wave. However, we think that motive waves do not have to be in 5 waves. In today’s market, motive waves can unfold in 3 waves. For this reason, we prefer to call it motive sequence instead.
www.google.com
AMC Moon Phase Analysis MarketMoonLordNew Moon Friday, Bullish for the next two weeks for a MoonShot!

CHK BreakoutPrice is breaking out above the trendline that is dominant (up)
I wonder how high this will go
100MA has continually been tested

AABB will run like Doge/TSLA. ABCD Harmonic Pattern is in work. AABB is a gold miner and crypto company. They have developed a gold backed crypto token and an exchange. Recently acquired 3 mines.
More theorized DD linked
investorshub.advfn.com

HOW FAR CAN YOU THROW WITH SHOULDERS SO LARGESheeeeeeeiT
What have we here.
3 year long descending channel.
The largest Cup and Handle formation in crypto
Tied with Stellar Lumens.

Bitcoin/6 hour chart BULLRUNTook some time off, but I am back to get you guys back in the gains. I am happy to say this one should do just that.
In this idea I show a possible ascending triangle on Bitcoin signaling the beginning of the second leg of the bull run. I hope you got your investments because nows the time. This is where Bitcoin runs to 110k. If you agree throw me a like and follow me for more ideas that keep you in the gains.

gala/usd ride to 0.35Hey folks seems to be some GOOD looks here tonight things are finding a bottom and rebounding nicely. jump off at 3.5 hurry this one will go quick.
imageio.forbes.com
www.forbes.com
