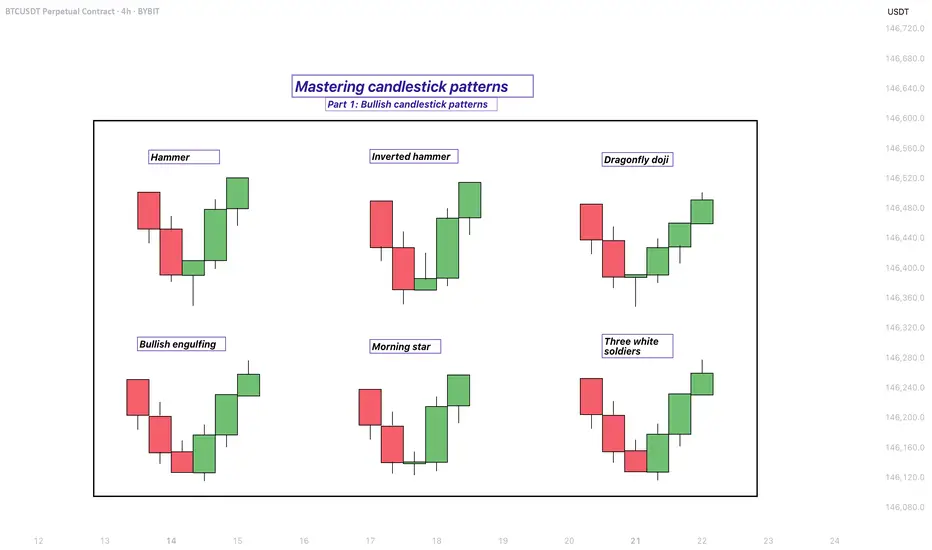
Mastering bullish candlestick patterns - How to use it!In this guide, we will explore some of the most important bullish candlestick patterns used in technical analysis. These patterns are essential tools for traders and investors who want to better understand market sentiment and identify potential reversal points where prices may start moving upward.
What will be explained:
- What are bullish candlestick patterns?
- What is the hammer?
- What is the inverted hammer?
- What is the dragonfly doji?
- What is the bullish engulfing?
- What is the morning star?
- What is the three white soldiers?
- How to use bullish candlestick patterns in trading?
What are bullish candlestick patterns?
Bullish candlestick patterns are specific formations on a candlestick chart that signal a potential reversal from a downtrend to an uptrend. These patterns are used by traders and investors to identify moments when the market sentiment may be shifting from bearish to bullish. Recognizing these patterns can help traders time their entries and make more informed decisions based on price action and market psychology. While no single pattern guarantees success, they can provide valuable clues when combined with other forms of analysis such as support and resistance, trendlines, and volume.
What is the Hammer?
The Hammer is a single-candle bullish reversal pattern that typically appears at the bottom of a downtrend. It has a small real body located at the upper end of the trading range, with a long lower shadow and little to no upper shadow. The long lower wick indicates that sellers drove the price lower during the session, but buyers stepped in strongly and pushed the price back up near the opening level by the close. This shift in momentum suggests that the downtrend could be coming to an end, and a bullish move might follow.
What is the Inverted Hammer?
The Inverted Hammer is another single-candle bullish pattern that also appears after a downtrend. It has a small body near the lower end of the candle, a long upper shadow, and little to no lower shadow. This pattern shows that buyers attempted to push the price higher, but sellers managed to bring it back down before the close. Despite the failure to hold higher levels, the buying pressure indicates a possible reversal in momentum. Traders usually look for confirmation in the next candle, such as a strong bullish candle, before acting on the signal.
What is the Dragonfly Doji?
The Dragonfly Doji is a special type of candlestick that often indicates a potential bullish reversal when it appears at the bottom of a downtrend. It forms when the open, high, and close prices are all roughly the same, and there is a long lower shadow. This pattern shows that sellers dominated early in the session, pushing prices significantly lower, but buyers regained control and drove the price back up by the end of the session. The strong recovery within a single period suggests that the selling pressure may be exhausted and a bullish reversal could be imminent.
What is the Bullish Engulfing?
The Bullish Engulfing pattern consists of two candles and is a strong indication of a reversal. The first candle is bearish, and the second is a larger bullish candle that completely engulfs the body of the first one. This pattern appears after a downtrend and reflects a shift in control from sellers to buyers. The bullish candle’s large body shows strong buying interest that overpowers the previous session’s selling. A Bullish Engulfing pattern is even more significant if it occurs near a key support level, and it often signals the beginning of a potential upward move.
What is the Morning Star?
The Morning Star is a three-candle bullish reversal pattern that occurs after a downtrend. The first candle is a long bearish one, followed by a small-bodied candle (which can be bullish, bearish, or a doji), indicating indecision in the market. The third candle is a strong bullish candle that closes well into the body of the first candle. This formation shows a transition from selling pressure to buying interest. The Morning Star is a reliable signal of a shift in momentum, especially when confirmed by high volume or a breakout from a resistance level.
What is the Three White Soldiers?
The Three White Soldiers pattern is a powerful bullish reversal signal made up of three consecutive long-bodied bullish candles. Each candle opens within the previous candle’s real body and closes near or at its high, showing consistent buying pressure. This pattern often appears after a prolonged downtrend or a period of consolidation and reflects strong and sustained buying interest. The Three White Soldiers suggest that buyers are firmly in control, and the market may continue moving upward in the near term.
How to use bullish candlestick patterns in trading?
To effectively use bullish candlestick patterns in trading, it’s important not to rely on them in isolation. While these patterns can signal potential reversals, they work best when combined with other technical tools such as support and resistance levels, moving averages, trendlines, and volume analysis. Traders should also wait for confirmation after the pattern forms, such as a strong follow-through candle or a break above a resistance level, before entering a trade. Risk management is crucial—always use stop-loss orders to protect against false signals, and consider the broader market trend to increase the probability of success. By integrating candlestick analysis into a comprehensive trading strategy, traders can improve their timing and increase their chances of making profitable decisions.
Thanks for your support. If you enjoyed this analysis, make sure to follow me so you don't miss the next one. And if you found it helpful, feel free to drop a like 👍 and leave a comment 💬, I’d love to hear your thoughts!
Morning Star
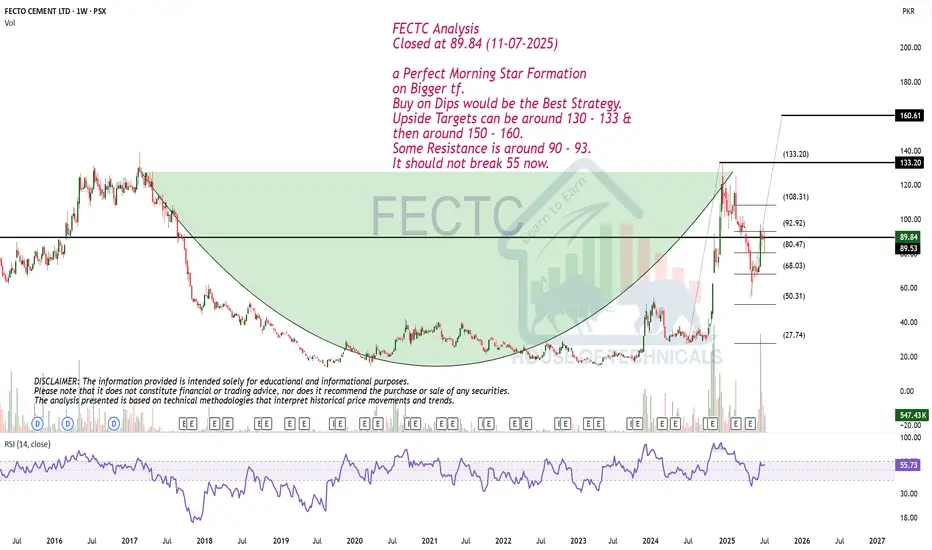
a Perfect Morning Star Formation on Bigger tf.FECTC Analysis
Closed at 89.84 (11-07-2025)
a Perfect Morning Star Formation
on Bigger tf.
Buy on Dips would be the Best Strategy.
Upside Targets can be around 130 - 133 &
then around 150 - 160.
Some Resistance is around 90 - 93.
It should not break 55 now.
What Is a Morning Star Pattern & How Can You Use It in Trading?What Is a Morning Star Pattern, and How Can You Use It in Trading?
The morning star candlestick is a popular price action pattern that technical analysts and traders use to identify potential trading opportunities. It indicates a reversal from a bearish to a bullish trend and is a valuable addition to any trader's toolkit. In this article, we will cover all the technical aspects of the morning star candlestick pattern.
What Is the Morning Star Candlestick Pattern?
The morning star in technical analysis is a reversal formation that appears at the end of a downtrend and signals a trend reversal. It consists of three candles.
To identify it on the chart, you should look for the following:
1. Downtrend: The market should be in a downtrend, and the first candle should be long and bearish.
2. Indecision: The second candle is usually expected to have a gap down, but gaps are uncommon in forex. Therefore, a small-bodied candle is considered sufficient. It's worth noting it can be either bullish or bearish, but if it’s bullish, the signal is stronger.
3. Significant increase: The third candle should be strong and bullish and close above the midpoint of the first bearish one. If it forms with a gap up, the buy signal is considered stronger.
When Morning Star Candlestick Patterns Occur
Traders can identify the morning star candlestick pattern in stocks, forex pairs, commodities, and cryptocurrencies*. It may also be observed across various timeframes, from minutes to weeks.
Generally speaking, a morning star pattern can be considered more reliable when it appears on a higher timeframe. For instance, a morning star candlestick pattern has more significance when it occurs over three days vs three minutes, given the increased amount of price action and market participation reflected over longer periods.
Psychology Behind the Pattern
The morning star reversal pattern reflects a shift in market sentiment from bearish to bullish. Initially, a strong bearish candle indicates prevailing selling pressure. The second candle, with its small body, suggests indecision as the market stabilises and neither bulls nor bears dominate. This pause indicates that sellers are losing momentum. The third morning star candle, a strong bullish one, confirms the shift as buyers take control, driving prices higher. This pattern signals that the downtrend is likely exhausted, and a potential reversal is underway due to increasing buyer confidence.
Trading with the Morning Star
Traders can use the following steps to trade this setup:
1. Identify the setup: Look for a setup on the chart formed after a solid downtrend.
2. Confirmation: After identifying the formation, traders should confirm it before entering a long position.
3. Enter a long position: Consider entering a long position once the formation is confirmed.
4. Determine a take-profit target: Although candlesticks don’t provide specific entry and exit points, traders may consider the closest resistance level to take potential profit.
5. Monitor the trade: Continuously monitor the trade and adjust the stop-loss and take-profit levels as needed based on market conditions.
What Is the Morning Star Candlestick Strategy?
The morning star trading strategy leverages the formation's ability to signal a bullish reversal after a downtrend. The formation's reliability increases when it occurs at a support level and is confirmed by a momentum indicator like the RSI or MACD.
Entry:
- Traders look for the full morning star to form at a support level.
- They then look for a confirmatory bullish signal from a momentum indicator, such as RSI showing oversold conditions, a bullish MACD crossover, or a bullish divergence in either.
- Traders may wait for additional confirmation, like RSI moving back above 30, or enter on the close of the third candle in the pattern.
Stop Loss:
- A stop loss might be set below the swing low of the setup.
- Alternatively, traders may place the stop loss beyond the lower boundary of the established support level.
Take Profit:
- Profits might be taken at a predetermined risk-reward ratio, like 2:1 or 3:1.
- Traders also often aim for an opposing resistance level where a further reversal might occur.
Morning Star and Other Formations
Traders should not confuse the morning star candle formation with other formations, such as the evening star, which is the complete opposite.
Doji Morning Star
In a traditional morning star reversal pattern, the candle that appears in the middle of the formation has a small real body, meaning there is a clear difference between the opening and closing prices.
In a morning doji star formation, the second candlestick has characteristics of a doji, where the opening and closing prices are very close to each other, resulting in a very small real body. This reflects the indecision as neither bulls nor bears can take control of the market.
The doji setup is less common than the traditional formation, but it still signals a potential upward movement after a prolonged downtrend.
Evening Star
In contrast to a morning setup, an evening star is a bearish setup occurring after an uptrend. It also consists of three candles – a long bullish one, a small-body one (it can also be a doji), and a long bearish one that closes below the midpoint of the first bullish candle. This suggests that the market is about to turn down.
Benefits and Limitations of the Morning Star Candle
The morning star is a useful tool for traders seeking to identify potential market reversals, but it does come with some benefits and limitations.
Benefits
- Strong Reversal Signal: Indicates a bullish reversal after a downtrend, helping traders anticipate upward moves.
- Broad Applicability: Effective across various financial instruments such as forex, stocks, commodities, and cryptocurrencies*.
- Timeframe Flexibility: It can be observed on different timeframes, from intraday to weekly charts.
Limitations
- False Signals: Like all patterns, it can produce false signals, especially in volatile markets.
- Confirmation Needed: A morning star pattern entry requires confirmation from additional indicators or formations to improve accuracy.
- Experience Required: Identifying the formation correctly and interpreting its signals requires experience and a good understanding of price action.
Final Thoughts
While candlestick formations such as the morning star can be useful for traders to identify potential trading opportunities, it is crucial to remember that they are not foolproof and should not be the sole choice of market participants when making their trading decisions. Traders should also incorporate technical indicators and develop risk management techniques to potentially minimise losses.
FAQ
What Is a Morning Star in Trading?
The meaning of a morning star in trading refers to a bullish reversal formation consisting of three candles. It appears at the end of a downtrend, indicating a potential shift to an uptrend. The setup includes a long bearish candle, a small-bodied candle, and a long bullish candle.
Is the Morning Star Bullish or Bearish?
It is a bullish candlestick pattern that indicates a potential reversal from a downtrend to an uptrend in the market. It suggests that the selling pressure is subsiding, and buying pressure is beginning to take over.
What Does the Morning Star Pattern Indicate?
It is a three-candle price action, often indicating a bullish reversal in the market. It suggests that selling pressure has been exhausted, and buyers are starting to gain control of the market.
How Do You Read the Morning Star Pattern?
To read the morning star formation, traders should look for the following characteristics: a long bearish candle formed in a solid downtrend and followed by a bullish or bearish candle with a small real body, which in turn is followed by a long bullish candle closing above the midpoint of the first one.
What Is the Opposite of Morning Star?
The opposite of a morning star is the evening star, a bearish reversal pattern. It appears at the end of an uptrend, signalling a potential shift to a downtrend. The morning and evening stars are similar, except the latter mirrors the former, consisting of a long bullish candle, a small-bodied candle, and a long bearish candle.
*Important: At FXOpen UK, Cryptocurrency trading via CFDs is only available to our Professional clients. They are not available for trading by Retail clients. To find out more information about how this may affect you, please get in touch with our team.
This article represents the opinion of the Companies operating under the FXOpen brand only. It is not to be construed as an offer, solicitation, or recommendation with respect to products and services provided by the Companies operating under the FXOpen brand, nor is it to be considered financial advice.

SPX week & month review 5/30/25Intrigued by today as we closed the month and week. The charts appear bullish until something changes that. Key points I noticed...
*Monthly morning star pattern
*RSI above 50 on month and week chart
*MACD over zero line and signal up on month and week chart
*Key levels holding up (21 ema, FVGs)
We are still in volatile times and narratives are being thrown all over the place. Do you see what I see? Enjoy your weekend.

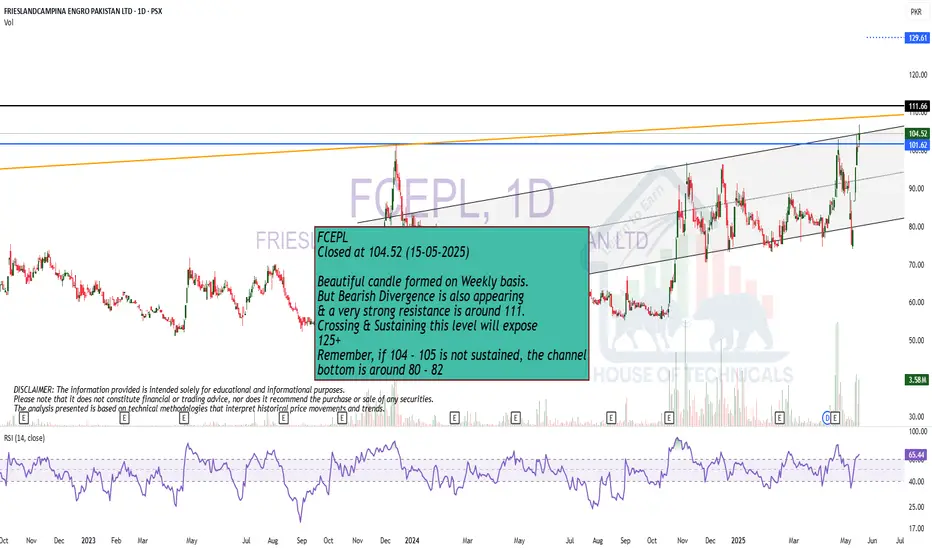
Beautiful candle but Bearish Divergence is also there..
Beautiful candle formed on Weekly basis.
But Bearish Divergence is also appearing
& a very strong resistance is around 111.
Crossing & Sustaining this level will expose
125+
Remember, if 104 - 105 is not sustained, the channel
bottom is around 80 - 82
May 6, 2025 GBPUSD Sell📉 Bias: Bearish | Risk: 0.5% | 🎯 Targets: 1:3 (take 75%), final target ~1:7
🧠 Reasoning:
Price reacted from a Daily / Weekly Orderblock with confluence from a 15m OB
Asia Low as target provides clean downside structure
Morning Star formed inside the OB → entry taken at the imbalance left behind
10 pip SL covers highs efficiently ✅

Morning Star formationMorning Star formation
Weekly Closing above 125 would be positive.
However, 143 - 144 is the resistance zone.
Crossing it with Good Volumes will move the
price towards 155 - 160.

Morning Star Formation on Bigger Tf.Morning Star Formation on Bigger Tf.
14.35 - 14.75 is a Very Important Support level.
However, 15.80 - 15.90 is a Very Strong Resistance
as of now.
If this level is Crossed & Sustained with Good Volumes,
we may witness 17.50 - 18 & then around 19.

Morning StarBeautiful Morning Star formation on Weekly basis.
Immediate Resistance is around 33 & then 36.
It should not Break 26.50 now otherwise, we may
witness More Selling Pressure.

#ZECUSDT #1D (Binance Futures) Descending channel breakoutZcash broke-out printing a morning star, looks good for recovery towards 100EMA resistance.
⚡️⚡️ #ZEC/USDT ⚡️⚡️
Exchanges: Binance Futures
Signal Type: Regular (Long)
Leverage: Isolated (2.0X)
Amount: 5.9%
Current Price:
36.12
Entry Zone:
36.05 - 33.55
Take-Profit Targets:
1) 41.83
1) 47.12
1) 52.42
Stop Targets:
1) 28.92
Published By: @Zblaba
SEED_DONKEYDAN_MARKET_CAP:ZEC BINANCE:ZECUSDT.P #1D #Zcash #Privacy z.cash
Risk/Reward= 1:1.2 | 1:2.1 | 1:3.0
Expected Profit= +40.4% | +70.8% | +101.3%
Possible Loss= -33.8%
Estimated Gaintime= 1-2 months

Bitcoin’s Bullish Patterns_Ready for a Breakout!?As I expected in the previous post , Bitcoin( BINANCE:BTCUSDT ) approached the Heavy Support zone($93,300-$90,500) and Support lines but quickly started to rise.
Bitcoin is moving in the Support zone($96,150-$94,700) . And in this increase of Bitcoin in the last few hours, we can see the Morning Star Candlestick Pattern well in the 2-hour time frame .
Educational tip : The Morning Star is a bullish reversal candlestick pattern that forms after a downtrend, consisting of three candles: a large bearish candle, a small indecisive candle, and a strong bullish candle. It signals a potential trend reversal and growing buying momentum.
In terms of Classic Technical Analysis , it seems that Bitcoin has succeeded in forming the Descending Broadening Wedge Pattern , which can be a sign of Bitcoin's increase .
According to the theory of Elliott waves , it seems that the entire corrective waves inside the descending channel were all in the form of a Zigzag Correction(ABC/5-3-5) so that it seems that Bitcoin finally completed the main wave C in the previous hours. If Bitcoin breaks the upper line of the wedge pattern, we can confirm the end of the main wave C .
I expect Bitcoin to be able to touch the Targets I specified on the chart AFTER breaking the upper line of the Descending Channel .
Note: If Bitcoin goes below $94,400, we expect more dumps.
Do you think Bitcoin can finally break out of this Descending Channel? Pump or Dump?
Please respect each other's ideas and express them politely if you agree or disagree.
Bitcoin Analyze (BTCUSDT), 2-hour time frame.
Be sure to follow the updated ideas.
Do not forget to put Stop loss for your positions (For every position you want to open).
Please follow your strategy and updates; this is just my Idea, and I will gladly see your ideas in this post.
Please do not forget the ✅' like '✅ button 🙏😊 & Share it with your friends; thanks, and Trade safe.

BHEL Bears Dominate – TP1 Hit, More Downside Expected!Technical Analysis: BHEL (Bharat Heavy Electricals Ltd) – 1D Timeframe (Short Trade)
We initiated a short trade on BHEL at 288.71 on 2nd September 2024, using the daily timeframe. The first target (TP1) at 259.89 has already been hit, and we are now looking ahead for further bearish momentum.
Key Levels
Entry: 288.71 – The trade was initiated following bearish signals and strong confirmation for a downward move.
Stop-Loss (SL): 312.03 – Positioned above the entry to manage risk and protect against reversals.
Take Profit 1 (TP1): 259.89 – Already hit, confirming the success of the initial short move.
Take Profit 2 (TP2): 213.25 – The next short target to be tested as bearish momentum builds.
Take Profit 3 (TP3): 166.62 – If selling pressure continues, this level could be achieved next.
Take Profit 4 (TP4): 137.79 – The ultimate target for this short trade setup.
Trend Analysis
BHEL is showing strong bearish signals, with price clearly below the Risological Dotted Trendline, confirming the downtrend. With TP1 already done, we expect the continuation of the bearish move towards TP2 and beyond.
BHEL has already reached its first profit target, demonstrating the strength of the bearish trend. The remaining targets are now in focus as we anticipate further downward movement in the coming days.

BOJ capitulates spectacularly Shinichi Uchida, Deputy Governor of the Bank of Japan (BOJ), says the bank won’t hike interest rates when markets are unstable, delivering a clear message on what traders need to do to prevent them doing so again: create volatility.
It’s an amazing statement, signalling the BOJ can and will be bullied by markets to avoid doing what is right for the Japanese economy. It’s an incredibly dovish admission, giving traders the green light to re-establish carry trades until the BOJ starts making noise about hiking rates again, or we see a major global economic downturn.
The Yen is tumbling understandably.
Adding to the dovish surprise, Uchida said the BOJ must maintain the degree of monetary easing for now and suggested the BOJ would not be behind the curve if it didn’t usher through rate hikes “at pace”.
It’s a capitulation of the grandest scale, undoubtedly orchestrated to restore calm to financial markets. It was only just over a week ago the BPOJ hiked more than expected and provided a hawkish outlook on the monetary policy outlook.
USD/JPY surges as carry trades established
USD/JPY has surged back above resistance at 146.50 on Uchida’s remarks, putting a potential retest of the January 2023 uptrend in play. The formation is also yet to be completed, but the three-candle pattern looks like a morning star, adding to confidence that we may have seen the cyclical bottom.
Should the price manage to remain above 146.50, consider buying with a stop below the level for protection. The intersection of the former uptrend and horizontal resistance at 148.80 is one potential trade target. Should that go, 149.70, 150.90 and 151.95 are the next upside levels of note.
The downtrend in RSI (14) has been broken, signalling downside momentum may be ebbing. It has yet to be confirmed by MACD but looks trustworthy given the speed of the rebound.
It’s not just bottoming patterns being seen in USD/JPY but also other pairs such as EUR/JPY and GBP/JPY.
-- Written by David Scutt

SWING IDEA - FINOLEX CABLESA potential swing trade in Finolex cables , a prominent figure in the cable manufacturing sector.
Reasons are listed below :
The stock bounced convincingly from the strong support level of 850, indicating solid buying interest at this price point.
A hammer candlestick on the weekly timeframe signals a potential reversal, suggesting a shift from bearish sentiment to bullish momentum.
The appearance of a morning star pattern on the daily chart adds further confirmation to the bullish bias, signaling a possible trend reversal from bearish to bullish.
The stock finds support at the 0.382 Fibonacci level, reinforcing the bullish outlook. Volume Surge: Witness a notable increase in trading volumes, reflecting growing market interest and potential accumulation by investors.
FinCables has been consistently making higher highs on larger timeframes, indicating a trend of increasing bullish momentum and reinforcing the potential for upward movement.
Target - 1020 // 1150 // 1210
Stoploss - weekly close below 805
DISCLAIMER -
Decisions to buy, sell, hold or trade in securities, commodities and other investments involve risk and are best made based on the advice of qualified financial professionals. Any trading in securities or other investments involves a risk of substantial losses. The practice of "Day Trading" involves particularly high risks and can cause you to lose substantial sums of money. Before undertaking any trading program, you should consult a qualified financial professional. Please consider carefully whether such trading is suitable for you in light of your financial condition and ability to bear financial risks. Under no circumstances shall we be liable for any loss or damage you or anyone else incurs as a result of any trading or investment activity that you or anyone else engages in based on any information or material you receive through TradingView or our services.
@visionary.growth.insights

East Pipes: Trendline support; morning star (Bullish Setup)Price is moving in uptrend and recently take a correction
Price started forming HH, HL again after taking support from golden pocket
Trendline resistance breakout and retest is observed
Morning star formation at Trendline support confluence a bullish potential
Take entry with SL below 140 (aggressive), 131 (conservative)
Trail SL and enjoy the ride

PVR MORNING STAR !Very Good Setup seen in Weekly charts.
Low Risk High Reward.
Target 1600 , 1800 ...
Do Like ,Comment , Follow for regular Updates...
Disclaimer : This is not a Buy or Sell recommendation. I am not SEBI Registered. Please consult your financial advisor before making any investments . This is for Educational purpose only.

#RVN/USDT 1W (Binance Futures) Descending wedge on supportRavencoin just printed a morning star on weekly TF, looks promising for mid/long-term recovery towards 50MA resistance.
⚡️⚡️ #RVN/USDT ⚡️⚡️
Exchanges: Binance Futures
Signal Type: Regular (Long)
Leverage: Isolated (1x)
Amount: 10.1%
Current Price:
0.01924
Entry Targets:
1) 0.01703
Take-Profit Targets:
1) 0.02713
Stop Targets:
1) 0.01198
Published By: @Zblaba
NGM:RVN #RVNUSDT #Ravencoin #PoW #P2P
Risk/Reward= 1:2
Expected Profit= +59.3%
Possible Loss= -29.7%
ravencoin.org

EURUSD - Reversal EURUSD has made its LL with morning star candle stick pattern. Exposed Divergence shows the reversal to bullish trend. Buy Entry on the previous LH will make sure that bearish trend breaks and then it will be a bullish run.

GBPJPY BUY ANALYSISFX:GBPJPY
Overall structure based o the weekly, daily, 4h and 1 h is bullish, so I am strictly looking for buys on GBPJPY. Price broke above 186.218 4H resistance area and made a retest as support, entry was based on a morning star candlestick pattern on the 15 min timeframe

#KMD/BTC 1D (Binance) Descending wedge breakout and retestKomodo bounced back on 50MA support printed two morning stars in a row, seems to be ready for another leg-up.
⚡️⚡️ #KMD/BTC ⚡️⚡️
Exchanges: Binance
Signal Type: Regular (Long)
Amount: 6.2%
Current Price:
0.00000835
Entry Targets:
1) 0.00000831
Take-Profit Targets:
1) 0.00001097
Stop Targets:
1) 0.00000698
Published By: @Zblaba
ASX:KMD BINANCE:KMDBTC #Komodo #PoW komodoplatform.com
Risk/Reward= 1:2
Expected Profit= +32%
Possible Loss= -16%
Estimated Gaintime= 3-6 weeks

FOR - breaking up soon?FOR was in a strong trend from June (pt A) till its peak on 7 Aug (pt B). It then went into 50% fib retracement over the next 2 months, hitting a possible final low on 6 Oct. A couple of bullish divergences between its price and RSI were also seen just prior to hitting this low.
What followed next was a bullish morning star pattern. Went long @ 26.35 on 10 Oct the day after this pattern was formed with initial stop loss slightly below the morning star's low @ 25.35.
Despite its long correction, the stock is still very much above its 200 day moving average.
Expecting that it will break out of it's downward trendline resistence soon.
Whether it could rise back towards its Aug's peak of 31.43 eventually remains to be seen. Will trail protective stops upwards from time to time.
Disclaimer:
Swing Trader here. This is just my own analysis and opinion for discussion and is NOT a trade advice. Kindly do your own due diligence and trade according to your own risk tolerance and don't forget that money management (ie trailing stop loss and position sizing) is (probably the most) important! Take care and Good Luck!

BluetonaFX - EURUSD Morning Star Opportunity Hi Traders!
We have a morning star opportunity here on the EURUSD 1D chart. After the impulsive wave to the downside, the market has now found support around the 1.08336 level, and a morning star candle pattern has formed, confirming to us a potential pullback or reversal of the bearish trend.
We are now looking for a retracement wave upward; we have our first target at 1.10011 and a second target at 1.10566. This is a good risk-reward opportunity, as we are trading near a strong support level. That being said, we must exercise a bit of caution as we are still under our 20 EMA. Ideally, we are looking for a push to get back above the EMA, which will give us additional confirmation of a potential pullback or reversal.
Please remember to like, follow, and comment, as your support greatly helps.
Your support is greatly appreciated.
BluetonaFX

INDIGO BREAKOUT TRADING IDEAAs we can see after a 4-month breakout with a bullish candlestick pattern
RSI 64.26 towards an upward direction
HV 26
let's retrace as per shown on the chart whereas, on 15 min chart, you'll see a shooting star and an evening star which indicates slide retracement
so plan accordingly.
enty and exit levels
2080
sl 2020 to 2000 (2.80%)
taget 2230 (8%)
RR 2.70%
educational purpose only!
