Aussie bright future ahead against greenbackI will post a visual link here later after I complete uploading the video in my channel which will be an in-depth analysis of why AUDUSD major pair will have a high probability of long bias throughout the week. Till then please give me some time and have an eye on this chart. Will comment here the link soon stay tune ;)
Morning Star

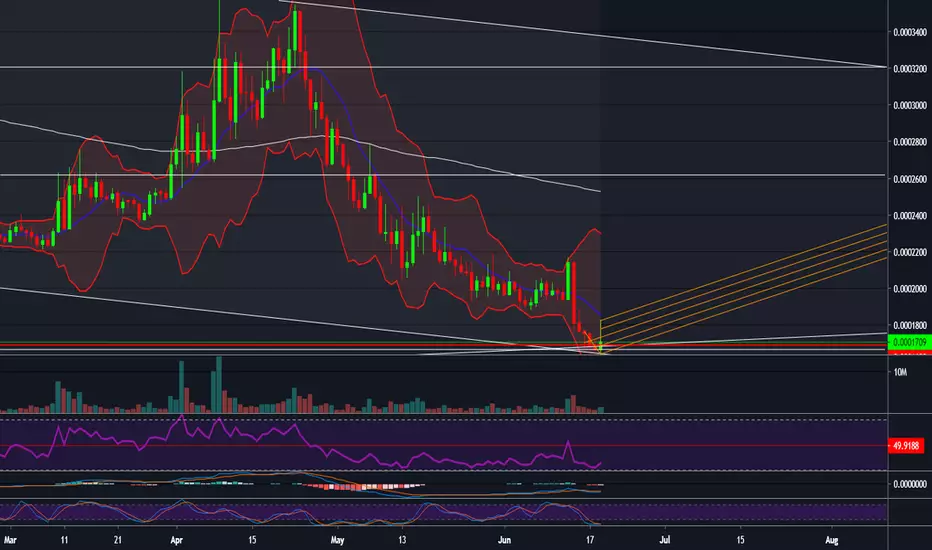
Gold H4 ConsolidationMorning star spotted on Gold as it failed to break the resistance at the top. May be back in consolidation phase.

EURUSD Forecast this Week Possible correction this week. RSI oversold, and the chart pattern confirm the forecast.
SL 1.0930

Davita - now a BULL trend Technicals analysis WEEKLY
Davita broke a downtrend channel, and is now in a consolidation above the 200SMA. (Bull)
50SMA is now crossing above the 200SMA. (Bull)
OBV and RSI show divergence, as they have moved in oposite directions since early August. (Short). However... on a daily chart , we see a decent uptrend since early June.
Headlines / Fundamental
On July 10th:
President Donald Trump on Wednesday signed an executive order reimbursing for kidney transplants and reducing the reliance on the costly treatments at dialysis clinics.
Analyst fair value target price is $79. Meaning 38% undervalued .

GBPYJPY long/ morning stargbpjpy has formed a morning star which indicates a potential reverse to the upside. MACD also shows that sellers are losing their selling power. In my opinion, now is the perfect time to go long in this market.


USD/JPY Buy after a Morning Star. Long-term!The morning star pattern is considered as a bullish reversal pattern, it
often occurs at the bottom of a downtrend and it consists of three
candlesticks:
-The first candlestick is bearish which indicates that sellers are still in
charge of the market.
-The second candle is a small one which represents that sellers are in
control, but they don’t push the market much lower and this candle
can be bullish or bearish.
-The third candle is a bullish candlestick that gapped up on the open
and closed above the midpoint of the body of the first day, this
candlestick holds a significant trend reversal signal.


BMRN ridiculous Morningstar analyst target price! Morningstar weekly highlights set Biomarin Pharmaceuticals with an amazing $119 fair price value ( 50% above current price).
Rating: 4 stars
Uncertainty rating: Medium
Moat: Narrow

AUDCAD WEEKLY, Long After a morning star pattern.The morning star pattern is considered as a bullish reversal pattern, it
often occurs at the bottom of a downtrend and it consists of three
candlesticks:
-The first candlestick is bearish which indicates that sellers are still in
charge of the market.
-The second candle is a small one which represents that sellers are in
control, but they don’t push the market much lower and this candle
can be bullish or bearish.
-The third candle is a bullish candlestick that gapped up on the open
and closed above the midpoint of the body of the first day, this
candlestick holds a significant trend reversal signal.

AUDJPY LONG WEEKLYAUDJPY goes long after a morning star pattern.
The morning star pattern is considered as a bullish reversal pattern, it
often occurs at the bottom of a downtrend and it consists of three
candlesticks:
-The first candlestick is bearish which indicates that sellers are still in
charge of the market.
-The second candle is a small one which represents that sellers are in
control, but they don’t push the market much lower and this candle
can be bullish or bearish.
-The third candle is a bullish candlestick that gapped up on the open
and closed above the midpoint of the body of the first day, this
candlestick holds a significant trend reversal signal.


Looking like it's Nano timeNot sure if it was a pump & dump group but volume came like a tidal wave and seems to be sticking around. Either way, it'll be left with a strong daily candle for a mammoth rise in the next few days
Nano is set up to boomThe fastest crypto by FAR with No Transaction Fees
Faster than an SMS text it can be sent across the world
ATH $38.00
On sale now $1.52

AEO Long - Oversold and now has some momentumThis trade does have down potential as any trade does.
AEO has just gotten past the horrible 4th quarter sales from last year, and consumer buying power has risen. I think the stock has over sold, and if you look at June 11th, that looks closely like a modified morning star (bullish).
Now- the sad truth is that the very next day the stock went back down on June 12th, and this makes not a true morning star. On June 13 +14 stock prices rose up beyond the opening price of the 12th and I jumped in.
Looking at a target between $18.50 and $20.00 as solid gains. Yes, that is a large area, but if you notice at around $19.75 is where the shake out really happens, making that a great short gains target and over $2 of profit.
Stop /Loss has been placed at $16.59, the low of the price on June 12th to reduce any horrible loss, and roughly a $1 loss.
Let me know what you think.
I am not a financial advisor, I just like to share my thoughts and trades with the community.


USDJPY moving average convergence divergenceUSDJPY moving average convergence divergence
morning star in W chart
harmonic pattern
moving average convergence divergence in D chart


Bullish Deep Crab USDJPYAll reasons are on the chart.
Double bottom not confirmed yet.
Good luck all.

GBP/JPY 1D MORNING STAR AT SUPPORT GO LONG OPPOTUNITTY GBP/JPY 1D MORNING STAR AT SUPPORT GO LONG OPPOTUNITTY

GBP/JPY Technical analysisThe counter is consolidating in a descending triangle pattern for the short term.
It bounced and tried to break the resistive trendline but its valiant effort was invain.
We expect the bearish strength to continue in the counter and so the descending triangle is set to render a bearish breakout, which can spur fresh sell off.


YETI reversal signPossible morning star pattern a few days ago. Stock looked bullish despite the market sell-off. Pattern doesn't indicate short or long-term reversal, but good bet to move towards nearest resistance (assuming market allows).
Disclaimer: This is not investment advice.
