MOVEUSDT Long-Term Downtrend Line – Breakout or Downside Ahead?📊 MOVE/USDT Chart Analysis (1D Timeframe)
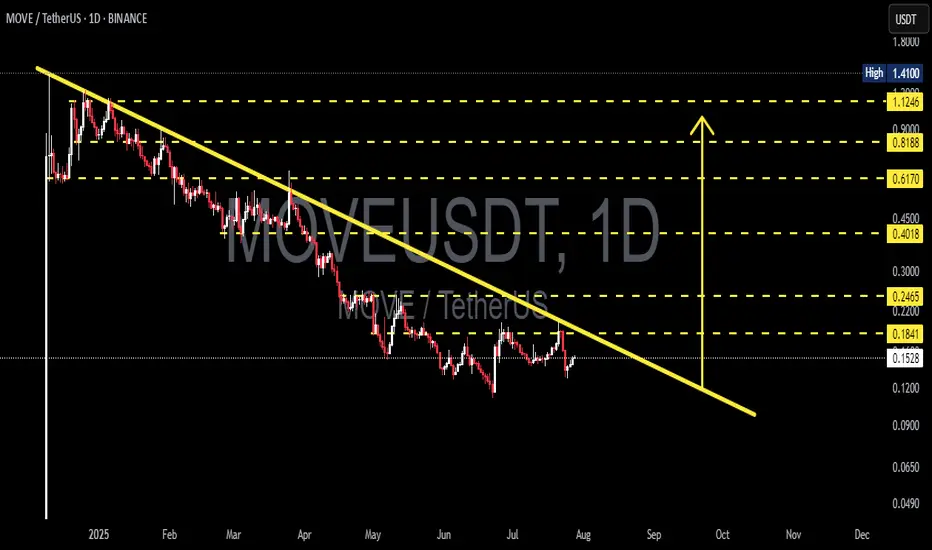
On the daily chart, MOVEUSDT has been locked in a strong downtrend since early 2025. The dominant descending trendline (yellow) clearly outlines the continuous selling pressure, with a series of lower highs and lower lows.
Price is currently trading just below this trendline and hasn’t confirmed a breakout yet. However, there are signs of accumulation in the lower zone, indicating a possible trend reversal if a breakout is confirmed.
---
📌 Identified Pattern
A descending triangle has formed in the medium term, though its bearish momentum seems to be weakening.
A potential double bottom pattern may be developing near the $0.1200–$0.1300 support area.
---
📈 Bullish Scenario
If the price manages to break above the descending trendline and close above the key resistance at $0.1841, we could see a bullish continuation toward:
Target 1: $0.2200
Target 2: $0.2465
Target 3: $0.4018
Further upside could aim for Fibonacci retracement levels like $0.6170, $0.8188, and potentially $1.1246 if volume confirms the breakout.
A strong bullish confirmation would come with high volume and a daily candle close above the trendline.
---
📉 Bearish Scenario
If the price gets rejected at the trendline again and breaks down below the $0.1200 support:
Next support levels to watch: $0.0900
Followed by $0.0650 and $0.0490 if bearish momentum increases.
A breakdown below these zones may signal a continuation of the long-term downtrend.
---
💡 Conclusion
MOVEUSDT is at a crucial decision point. A breakout from this long-standing downtrend could trigger a significant trend reversal, while another rejection might continue the bearish cycle. Watch for volume spikes and daily closes above the trendline to confirm the next move.
#MOVEUSDT #CryptoChart #TechnicalAnalysis #CryptoBreakout #AltcoinWatch #TradingStrategy #DescendingTrendline #FibonacciLevels #CryptoSupportResistance #BullishSetup #BearishSetup
Move
Debt markets at a point of complacency see green arrowsJunk bonds are at a dangerous level now of complacency. I would buy TLT sell HYG

MOVE (SPOT)BINANCE:MOVEUSDT
#MOVE/ USDT
Entry range(0.1530 - 0.1560)
SL 4H close below 0.1490
T1 0.17
T2 0.18
T3 0.20
T4 0.22
_______________________________________________________
Golden Advices.
********************
* collect the coin slowly in the entry range.
* Please calculate your losses before the entry.
* Do not enter any trade you find it not suitable for you.
* No FOMO - No Rush , it is a long journey.

MOVE : Where to buy ?Hello friends
Given the upcoming token release, the price is expected to continue to fall, so be careful.
In case of a fall, we have identified important support levels for you, where you can buy with capital and risk management.
*Trade safely with us*

MOVE INDEX I am waiting for a print below 86 to call the top The chart is that of the bond VIX The key and filter to placing the trade I am waiting on a 86 k print as we are sitting on BB bands I will be ready for now back to cash As the market futures reached the target BUT CASH FAILED OMEN!!!!

MOVE is nose diving... Do we buy the dip?TVC:MOVE price doesn't look good if one were to take the risk here; market structure needs to develop. Consider risk-to-reward ratio before considering this asset for your portfolio.
Full TA: Link in the BIO

MOVE hughe FW breakout incomming?MOVE has been dropping over 80% from it's ATH.
This looks like bearmarket scenario's. But as I did mention before in other posts. This bull cycle is different and especially for ALTCOINS. The massive growth in number of ALTS makes it hard to stand out and gain momentum. The money and social attention is widely spread over milions of coins now. The 1875 active accounts holding MOVE is reasonable for a relative new project jet it doesn't signal mass adoption.
MOVE is a Layer1 / 2 and ZK coin in the smart contracts. It's also in the World Liberty Financial portfoilio and made in the USA. These fundamentals are bullisch for MOVE. A breakout from the FW pattern could make it take off at rocket pace towards the former highs.
Allong the way we can see and identify several major S/R line that have to be broken first.
Indicators:
The rounded bottom / consolidation could mark the bottom.
Stoch indicator: The STOCH shows signs of recovery
Golden Cross: The short term MA has been crossing the Long term MA signaling recovery.
Volume: The low volume is typical for the consolidation.
CONSOLIDATION above support and below resistance
The level where we find MOVE right now looks like consolidation and bottom possibility. With support at 0,218 a small resistance at 0,34 and a major resistance at 0,56.
My trading plan for now:
I will open a new bigger SPOT position in order to lower my AVG ENTRY that has lost over 60% in the last months. A run up from this level to the S/R level 0,56 means a 177% profit.


MOVE: A Solid Chance or A Possible Fail?#MOVE is a relatively new coin with limited data, which may affect reliability. That said, a strong move toward a new ATH is possible as long as price holds above $0.0646.
Passing above $0.35 and $0.60 would confirm the bullish outlook.
#Movement

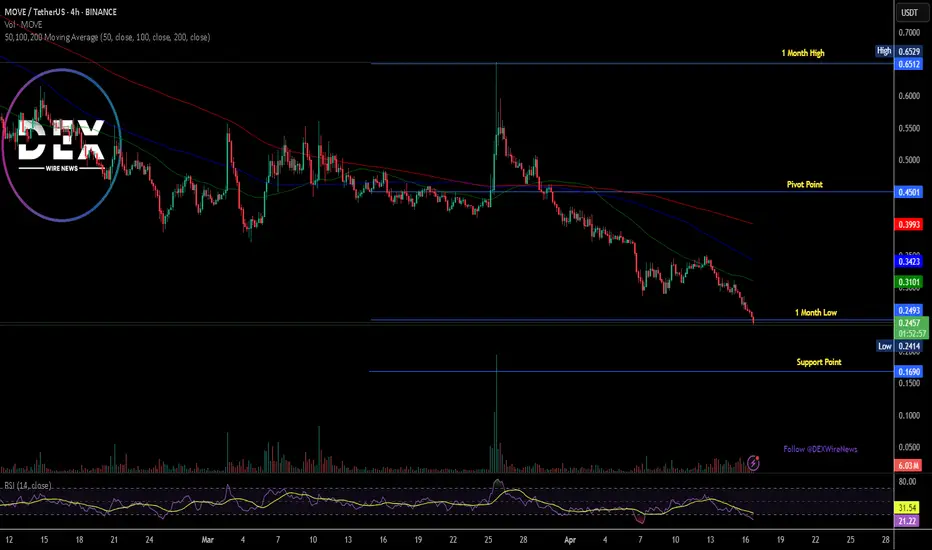
Breaking: Movement Token ($MOVE) Dips 12% TodayThe price of Movement coin ( TVC:MOVE ) nosedived 12% today, leading to a bearish pennant.
The ecosystem of Modular Move-Based Blockchains that enables developers to build secure, performant, and interoperable blockchain applications, bridging the gap between Move and EVM ecosystems has experience immense selling pressure today albeit the general crypto industry was also in a state of turmoil with CRYPTOCAP:BTC losing its $85k grip now down to $83k.
The first Move-EVM L2 for Ethereum has not being exempted, as hinted by the RSI at 20.64, TVC:MOVE has long being oversold with the asset moving around the 1-month low axis and a break below that axis could be dire for TVC:MOVE token.
Similarly, a break above the 50% Fibonacci retracement point could resort to a bullish reversal for Movement token ( TVC:MOVE ).
Movement Price Data
The Movement price today is $0.251764 USD with a 24-hour trading volume of $104,973,849 USD. Movement is down 10.27% in the last 24 hours. The current CoinMarketCap ranking is #87, with a live market cap of $616,822,310 USD. It has a circulating supply of 2,450,000,000 TVC:MOVE coins and a max. supply of 10,000,000,000 MOVE coins.
Path to 100 VIXI wrote this note on TVC:VIX a few days ago:
www.tradingview.com
And am now expanding it a bit more.
As someone who was working middle office during the original 2016 Trump Election, Brexit, during the Taper Tantrum and a few other major events - I want to lay out my principles on trading the VIX because spikes like this bring a lot of "first time" VIX traders to something that trades like NOTHING ELSE in the market.
This is not a stock in a short squeeze, this is not a generic index.
This is like nothing you've ever traded before. In fact, I'd encourage you to take advantage of TradingView's chart options and instead look at the chart of -1*$TVC:VIX.
That alone should give you pause.
----------------------------------
So - let's start with the principles of the finance business as laid out in the masterclass which was the movie "Margin Call" .
"John Tuld: There are three ways to make a living in this business: be first, be smarter, or cheat."
1. Be First.
You are not first if you are buying above the historic average of VIX 20-21.
If you were buying CBOE:UVXY since Jan 2025, you'd be up 175% right now and likely looking to re-balance into your desired long term asset positions.
2. Be Smarter.
* Are you taking into consideration the VIXEX Cycle?
* Do you know the effect of VIXEX before or after monthly OpEx?
* Do you know the current implied volatility curve of options ON the VIX?
* Do you know that of the last 4 times the VIX has hit 50, it went on to 80+ 50% of the time after that?
* Yes, I've seen the charts going around about forward S&P X year returns but did you know that after the VIX spike to 80 in October 2008, the market (in a decreasing volatility environment) went on a further 35% decline in the next 4-5 months?
* Where is the MOVE? What are the bond indexes & bond volatility measures doing? And if you don't yet understand that equities ALWAYS reacts to what is going on in the rates / yield world... you'll find out eventually. I hope.
3. Cheat
When things start going wrong, everyone wants an easy solution.
That's why its called a relief rally. It feels like relief - the bottom is in, the worst part is over.
But that is what the really big players have the biggest opportunity to play with the day to day environment.
They know our heuristics. They encourage the formation of cargo cult style investing whether that's HODL in the cryptocurrencies or Bogleheads in the vanguard ETFs.
It's all the same and encourages you to forgot first principles thinking about things like:
1. Is this actually a good price or is it just relatively cheap to recent history?
2. Who's going to have to dilute to survive the next period of tighter lending, import costs from tariffs, or whatever the problem of the day is.
3. VIX correlation - volatility is just a description of the markets. Its not a description of the direction. There is periods where volatility is positively correlated to the price movement (like during earnings beats). Know about this and know when it changes.
4. Etc.
Some have pointed out that is more appropriately a measure of liquidity in the SPX.
When VIX is low, that means there is lots of "friction" to price movement. It means that there is tons of orders on the L2 book keeping the current price from moving in any direction too quickly.
When VIX is high, that means there is very low "friction" to price movement. It means there are very few orders on the L2 book and market makers can "cheat" by appearing to create a low volume rally and then rug pull that price movement very quickly (not via spoofing, more just dynamic management of gamma & delta hedging requirements).
Additionally - volume itself becomes deceptive. Volume is just indicating that a trade happened.
Its not telling you to what degree the spread between the bid and ask has blown out to 1x, 2x, or 5x normal and that trades are executing only at the highest slippage prices in that spread.
All of these things are considerations that the market makers can use to make a "buy the dip" situation that works heavily to their advantage.
TLDR: "If you can't spot the sucker in your first half hour at the table, then you are the sucker"
----------------------------------
So - why / when would VIX go to 100?
In 2020, its easy to forget that a culmination of things stopped the crash at -35%.
* March 17, 2020 VIXEX wiped out a significant amount of long volatility positions.
* March 20, 2020 Opex wiped out a significant proportion of the short term put positions
* March 20, 2020 Fed Reserve announced to provide "enhanced" (i.e. unlimited) liquidity to the
markets starting Monday March 23, 2020.
* April 6th, 2020 Peak of Implied Volatility (point where options "most expensive") - which meant that buyers / sellers started providing more & more liquidity following this point.
In 2025, we have yet to see:
* Any motion towards intervention from the Fed for liquidity.
* Any motion from the significant fundamental investors (we're not close to an attractive P/S or P/E on most stocks for Buffett & Co to start buying)
* Any significant motion from companies on indicating strategies about capital raises, layoffs, or other company level liquidity reactions.
* Any "reset" of options in either volatility or hedging. Numbers below as of April 9, 2025:
- SPY 2.8M Put OI for April 17
- VIX 3.5M Call OI for April 16
Just an example but maybe IF we see those clear and NOT get re-bought for May Opex... we might be ready to call a top here at 50 VIX.
Otherwise.... we're just at another stop on the path to 100.

MOVEUSDT – High-Probability Setup, Stay Sharp📌 Key Levels Mapped Out – Now It’s About Execution.
🟢 Green Box = Strong Support – Buyers are showing interest, but confirmation is key.
🔴 Red Box = Major Resistance – A reaction here could lead to a solid rejection.
How We Approach This:
Support Holds? → We wait. LTF breakouts + CDV confirmation = high-confidence long. No guessing, just data.
Resistance Rejected? → No blind shorts. LTF shift bearish + CDV confirmation = strong setup.
Breakout? → We don’t chase. Retest + volume confirmation = real trade opportunity.
Most traders get caught in emotions—we don’t. We move with structure, volume, and confirmation.
Stay disciplined, execute the plan, and let the market do the work.
✅I keep my charts clean and simple because I believe clarity leads to better decisions.
✅My approach is built on years of experience and a solid track record. I don’t claim to know it all but I’m confident in my ability to spot high-probability setups.
✅If you would like to learn how to use the heatmap, cumulative volume delta and volume footprint techniques that I use below to determine very accurate demand regions, you can send me a private message. I help anyone who wants it completely free of charge.
🔑I have a long list of my proven technique below:
🎯 ZENUSDT.P: Patience & Profitability | %230 Reaction from the Sniper Entry
🐶 DOGEUSDT.P: Next Move
🎨 RENDERUSDT.P: Opportunity of the Month
💎 ETHUSDT.P: Where to Retrace
🟢 BNBUSDT.P: Potential Surge
📊 BTC Dominance: Reaction Zone
🌊 WAVESUSDT.P: Demand Zone Potential
🟣 UNIUSDT.P: Long-Term Trade
🔵 XRPUSDT.P: Entry Zones
🔗 LINKUSDT.P: Follow The River
📈 BTCUSDT.P: Two Key Demand Zones
🟩 POLUSDT: Bullish Momentum
🌟 PENDLEUSDT.P: Where Opportunity Meets Precision
🔥 BTCUSDT.P: Liquidation of Highly Leveraged Longs
🌊 SOLUSDT.P: SOL's Dip - Your Opportunity
🐸 1000PEPEUSDT.P: Prime Bounce Zone Unlocked
🚀 ETHUSDT.P: Set to Explode - Don't Miss This Game Changer
🤖 IQUSDT: Smart Plan
⚡️ PONDUSDT: A Trade Not Taken Is Better Than a Losing One
💼 STMXUSDT: 2 Buying Areas
🐢 TURBOUSDT: Buy Zones and Buyer Presence
🌍 ICPUSDT.P: Massive Upside Potential | Check the Trade Update For Seeing Results
🟠 IDEXUSDT: Spot Buy Area | %26 Profit if You Trade with MSB
📌 USUALUSDT: Buyers Are Active + %70 Profit in Total
🌟 FORTHUSDT: Sniper Entry +%26 Reaction
🐳 QKCUSDT: Sniper Entry +%57 Reaction
📊 BTC.D: Retest of Key Area Highly Likely
📊 XNOUSDT %80 Reaction with a Simple Blue Box!
I stopped adding to the list because it's kinda tiring to add 5-10 charts in every move but you can check my profile and see that it goes on..

Movement [MOVE] is at horizontal support, will it bounce?MOVE is holding horizontal support. The most important aspect of this level is RR. These levels offer a great opportunity to be both offensive and defensive. this is what I call a trading moment.
Full TA: Link in the BIO

MOVEUSDT(Movement) Updated till 25-03-25MOVEUSDT(Movement) Daily timeframe range. fairly new PA here. as of that it got good opportunity for right setups. for now recent resistance at 0.6182 breaking that can push it toward 0.8622. local support at 0.4038.

$MOVE Surge 35% Today Amidst a Falling Wedge PatternMovement Network Native token ( TVC:MOVE ) saw its value rise sporadically gaining about
37% today albeit the general crypto landscape saw notable uptick with Solana reclaiming the $140 zone.
As of the time of writing, TVC:MOVE is up 38% trading within a bullish engulfing pattern after breaking past a falling trend channel. With the RSI at 66, this hint at a possible 200% surge in sight- a level that aligns with the token's ATH.
Movement Network is an ecosystem of Modular Move-Based Blockchains that enables developers to build secure, performant, and interoperable blockchain applications, bridging the gap between Move and EVM ecosystems.
Movement Price Live Data
The live Movement price today is $0.586188 USD with a 24-hour trading volume of $447,749,157 USD. Movement is up 35.13% in the last 24 hours, with a live market cap of $1,436,160,695 USD. It has a circulating supply of 2,450,000,000 MOVE coins and a max. supply of 10,000,000,000 MOVE coins.

Trading opportunity for MOVEUSDTBased on technical factors there is a Buy position in :
📊 MOVEUSDT
🔵 Buy Now or by Breakout
🪫Stop loss 0.3680
🔋Target 0.5500
📏 R/R 2
💸RISK : 1%
We hope it is profitable for you ❤️
Please support our activity with your likes👍 and comments📝

MOVEUSDT 12HMOVE ~ 12H Analysis
#MOVE This trade is very high risk. Buy gradually after successfully penetrating this resistant line with a short -term target of at least 10%+.

MOVE Price Analysis: Key Levels & Potential ScenariosCurrent Market Structure
Since mid-February, MOVE has been consolidating, with a critical support level forming around $0.4371.
This level aligns with a bullish daily gap and the midpoint of a previous candle tail, making it a key area to watch for a potential retest.
Following the mainnet launch, a "sell the news" reaction may test this support level before determining the next directional move.
Downside Risk: Key Support Levels
If $0.4371 support fails, there is minimal historical support below, making a drop more probable.
Possible profit-taking zones include:
$0.3705 (near bulls' stop levels)
$0.3500 (a major psychological support level)
Upside Potential: Resistance Levels to Watch
If MOVE rebounds off support and breaks above $0.4980 (previous rejection zone), the next bullish targets include:
$0.5573 (first major resistance level)
$0.5820 (historical rejection zone)
Conclusion & Strategy
Bullish Scenario: A strong bounce from $0.4371 could lead to a push toward $0.4980 and potentially $0.5573 if buying pressure sustains.
Bearish Scenario: A break below $0.4371 could accelerate losses toward $0.3705-$0.3500, where buyers may attempt to step in.
Key Watchpoint: How the price reacts at $0.4371 will dictate the next significant move. If it holds, bulls regain control; if it fails, further downside is likely.

Movement MOVE price analysisFor more than 3 months, #MOVE price has been steadily falling to the Buy Zone of $0.38-0.47 - did you buy it?
1️⃣ Well, now the first and foremost task is for #MOVEUSDT to confidently gain a foothold above $0.60
2️⃣ And then you can start dreaming about a rapid x3 growth to $1.80 per #Movement coin
Or is it too optimistic, don't you think?
_____________________
Did you like our analysis? Leave a comment, like, and follow to get more

MOVE is testing the blue support levelAnalysis 🚨
TVC:MOVE is testing the blue support level 🔵. If it breaks down, the next target will be the green line level 🟩.
🎯 Next Target: Green line level (if breakout occurs)

MOVE Jumps 12% as Trump-Linked World Liberty Financial Buys InLayer-2 token MOVE has surged 12% in the past 24 hours, making it the market’s top gainer. The rally follows news that World Liberty Financial, a Trump-backed DeFi platform, purchased $2 million worth of MOVE tokens on Tuesday.
Arkham Intelligence reports that the purchase was made in multiple batches, with the first transaction settling at 14:22 UTC. Just minutes later, at 14:48 UTC, a crypto account on X, DB, claimed that Movement is in discussions with Elon Musk’s Department of Government Efficiency (D.O.G.E). However, Movement’s co-founder Rushi Manche denied any official communication.
Despite the surge, bearish sentiment remains strong. MOVE’s funding rate has plummeted to -0.084%, its lowest since January 7, signaling increased short positions. Additionally, the token has seen consecutive spot outflows totaling $19 million, with another $440,470 exiting the market on Wednesday.
Profit-taking could erase MOVE’s gains, pushing it down to $0.71 or even $0.55 if support fails. Conversely, if demand surges, MOVE could break past $0.87 and head toward $1.08.
The question now: is this just a hype-driven pump, or can MOVE sustain its momentum?

Movement #MOVE Price / Crypto / Technical Analysis StudyThe transparency in the graphics in this image is quite clear, I am sharing the example for educational purposes, I have been trading in these farms many times. You can make it a classic, the red horizontal line is a strong resistance area that has been tried many times, it is the first area that must be crossed in order to say that the price is rising. The green horizontal line is the current movement support of the price and its closing below the level reduces the price to the test of the yellow line, the main important demand area, and when it cannot find sufficient demand in the yellow line, the price continues its downward movement for exploration and the price tags in the round circle become the minimum target areas.

MOVE BUYhello friends
Considering the failure of our resistance and the strength of the trend, we can enter a buying position.
Capital management should be observed.
Be successful and profitable.
