$NVDA Pullback$NVDA to pull back to the slow-moving average (purple highlighted area), using it as support, then potentially move higher as shown by the bullish Ichimoku cloud. There is clear disequilibrium between the fast and slow-moving averages (base and conversion lines) and price action has already started moving towards the base line at roughly $569.63 and my analysis shows that it will continue to close the gap between the moving averages before a continuation of an uptrend. Thoughts on this analysis?
Moving

Trade of the day - GBPJPY 15M SHORT ~ 70 PIPS WITH FULL BREAKDOWTrade of the day - GBPJPY Sells with risk management along the way to secure profits #tradeoftheday #Trading #tradeandgetpaid #Forex #Markets #gbpjpy #bearishmarket

Gbpjpy Short Signal In Monthly Time FrameGbpjpy Short Signal In Monthly Time Frame
in monthly tf gbpjpy near to touch monthly descending trend line and we can aspect a bearish movement + 200 ema also at that place and there is also a resistance area wait for conformation

Honda Motors - Probable trend reversalIn the chart you will find everything that i found important to the current price of the stock.
I think we will see a trend reversal if the price draws a good uptrend after the spike up.
On Tuesday(today) I expect the price to suffer from correction but this is healthy for the long term price movement.
I would wait out the correction and there will be a better entry for LONG position.
I am not financial expert nor advisor, please make your own decisions and do your own analysis!


BTC Short - Can 50K become the new 20K?I've stacked 150 average's to see where twists happen, Blue is golden cross, orange is Death cross.

SPY daily - Why I love the 21EMAMy entry for scalping SPY/QQQ contracts is a 8/21 EMA crossover. Here is an example of how well the SPY responds to the 21EMA.

"BUY Signal" :-"NSE:ADANIPORTS" 1 hr Chart ("Solved Signal 1")-BUY signal generated by Solved Signal 1(SS1) in 1 hr Chart of NSE:ADANIPORTS
-NSE:ADANIPORTS 1 hr chart
-Indicator used "Solved Signal 1(SS1)"
-"Solved Signal 1" NSE:ADANIPORTS generates buy signal(by default: text:- SS1, color= green ,shape=triangleup)
on 1 hr chart of NSE:ADANIPORTS .It means NSE:ADANIPORTS can go up.
-Solved Signal uses "NSE:ADANIPORTS" Price data for Solving the Market(See description of Indicator).
-Like and Comment.
-Thankyou NSE:NIFTY BSE:SENSEX

Possible long opportunity EURUSDPrice has crossed my 30 EMA, trendline and support. However, it's still below my 200 SMA. Risk is high.

Always Wait For Confirmations 📚 Those who win at the Forex game are those who are able to build on their case to take a trade, whether it be fibonacci, moving average, patterns etc. The more confluence, the better. This is why it is important to always wait for your confluences to line up before taking a trade.
For this particular trade, those who were waiting for the third touch of the upper resistance of the pattern, would've been stopped out if they had a tight stop loss. It would've been better to wait for more of your confirmations to line up so you can execute the trade knowing that there are more things on your side (other than chance!)
See below for the current GBPNZD set up.


$OXBR, riding to $5.00This does not seem to be stopping. It's toward the bottom of the trend so we are entering here. The RSI is staying steady above its support and the trend is well above the EMA 30. We are hoping to $5.00 but we'll take anything over $4.00.

APHA LongAPHA looks to respect the 10 ema pretty well. Might consolidate down a bit, but overall I'm thinking more bullish momentum.

FTM bullish bounce off the 200 moving averagehere you can clearly see it was a nice buy signal off the bounce on the 200ma on the hourly chart, bullish imo

ZRX looks to have broken out the falling wedgehi guys, keep checking on this, its broke out the falling wedge, also above the 21 moving average and pushing above 50 on the rsi if we stay above 50 on rsi uptrend confirmed

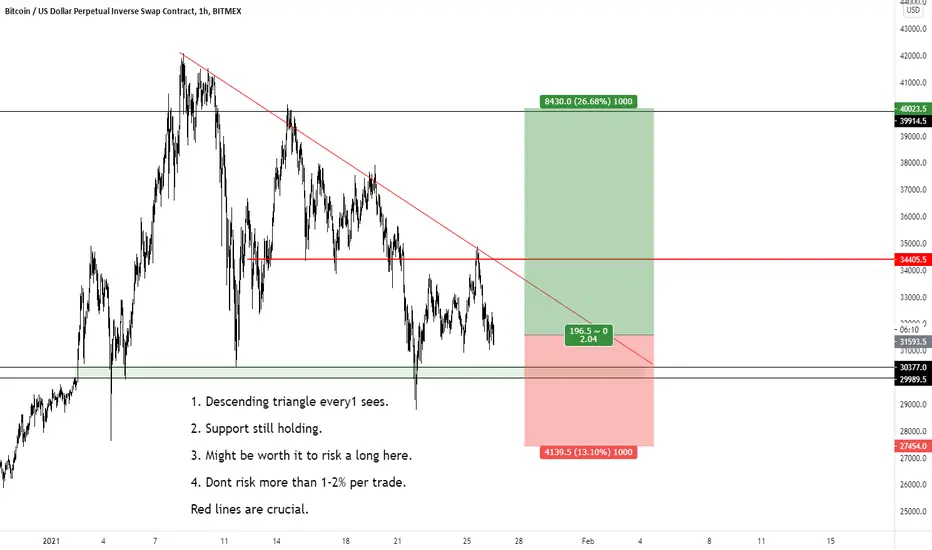
wanna risk a long on btc when everyone is hyped??why not stonks just keep going up. why shouldnt btc do the same. good luck predicting the top of this market cycle lmao
your long could get rekt, dont risk more than 1-2% per trade, trade well folks and use VERY SMALL POSITION SIZE because high volatility. 10% moves have become the norm. Dont be a wise guy doing 25x.
Markets ranging atm. till support breaks i aint gonna be overly bearish..mostly neutral on btc atm.
EURCAD - Resistance Line - SHORTI am expecting to see price to start fall if the price meet the resistance line and should fall to - 1.532 support area. Wait for a clear price action to make entry.
This is great for short/mid term trading, Trade at your own risk.

BAND split chart 1hr and WeeklyBullish. Starting to get lots of eyes on the net. Not familiar with the company? Here is a bio straight from Tradingview:
""Bandwidth, Inc. provides cloud-based communications services. It offers data Internet, voice/voice over Internet protocol, messaging. managed network, and conferencing services. The firm serves the telecom needs of small and medium businesses. It operates through the following business segments: CPaaS and Other. The CPaaS segment includes software-powered communication platform such as, voice calling and messaging services. The Other Segment provides legacy services. The company was founded by Henry Kaestner and David Morken in 1999 and is headquartered in Raleigh, NC."
First off I am really loving the dual chart setup lately.
I am bullish on this - watching CALLS for entry on Tuesday 01/19.
MY BIGGEST AREA OF FOCUS RIGHT NOW - Look at what the moving averages are trying to do. We seriously could see them go bearish or bullish. All 4 are within moments of each other. Will be interesting to see how they all react the next few days. And honestly the 200ma is acting as a bit of resistance right now.
I am also impressed at the steady increase in volume over the last year of trading.
$BAND.

OPPORTUNITY TO BUY BITCOINIf the Bitcoin get down to around 20,000 again, it will be good opportunity to buy bitcoin at lowest price before going back up to well over 100,000, This might be your last opportunity to buy the cheapest bitcoin possible
This is my personal view.

Tilson Moving Average (T3)T3 is one of the most accurate moving averages developed by Tim Tilson.
Tilson Moving Average (T3) is a trend indicator with the advantage of having less lag than other ones.
That is, a faster moving average. T3 is considered superior to traditional moving averages as it is smoother, more responsive and thus performs better in ranging market conditions as well. The T3 moving average is an indicator of an indicator since it includes several EMAs of another EMA. Unlike any other moving average, it also adds the volume factor.
Tim Tilson is designed another superb movinh average called IE2 which integrates the linear regression into it.

