What to do when technical analysis does not appear to be workingI take a look at when the US dollar Index broke below its uptrend back in the middle of August - the break was not sustained. I talk about what I do next when it appears my analysis is not working.
The Society of Technical Analysts' next course starts in October. Those wishing to learn more about technical analysis can take a look at the Route to Diploma - Society of Technical Analysts, www.technicalanalysts.com
Disclaimer:
The information posted on Trading View is for informative purposes and is not intended to constitute advice in any form, including but not limited to investment, accounting, tax, legal or regulatory advice. The information therefore has no regard to the specific investment objectives, financial situation or particular needs of any specific recipient. Opinions expressed are our current opinions as of the date appearing on Trading View only. All illustrations, forecasts or hypothetical data are for illustrative purposes only. The Society of Technical Analysts Ltd does not make representation that the information provided is appropriate for use in all jurisdictions or by all Investors or other potential Investors. Parties are therefore responsible for compliance with applicable local laws and regulations. The Society of Technical Analysts will not be held liable for any loss or damage resulting directly or indirectly from the use of any information on this site.
Moving_average

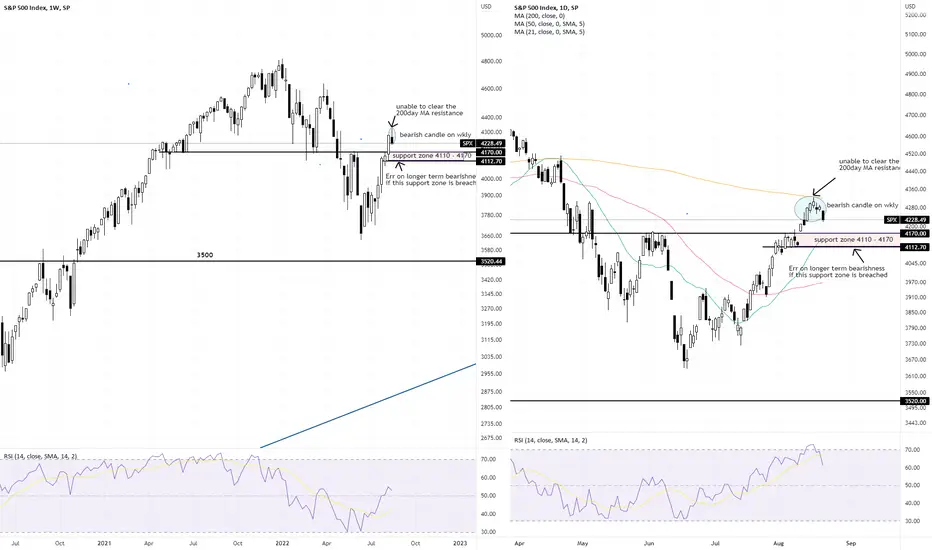
SPX (and NDX) - correction or turning bearish?We had a good bullish run lasting almost 2 month before ending in a rather brutal sell off last Friday. The weekly bearish inverted hammer candlestick suggests we could have potentially more downside in the coming days/week (unless negated by a rebound that took out last week's high, though the odds look slim at the moment).
However, whether we have turned longer term bearish remains to be seen. For SPX, we have support coming up at around 4170 and in the worst case 4110. I will definitely erred on bearishness should we have a close below 4110.
Similarly for Nasdaq, I will err on bearishness if we have a close below 12900.
This is coming from a swing trader's point of view (not a long term investor nor a short term scalper. Stay safe and do have stop losses in place.
p/s There will always be individual stocks that do not act with the flow of the overall market indices. It is still possible to ignore market noises and trade those stocks if the technicals lined up.
Disclaimer: Just my 2 cents and not a trade advice. Kindly do your own due diligence and trade according to your own risk tolerance and don't forget that money management is important! Take care and Good Luck!
INTEL Corp. $INTC - Buy @ ~ $35/$36INTEL Corp. $INTC - Buy @ ~ $35
I'm always on the Buy Side of the S&P500 Stocks.
I believe $INTC price is fairly good to buy it now for a long term investment.
My analysis is based on the trend lines (SMA 20 & 50) and Support & Resistance on the Daily time frame.
Target Prices are respectively as follow $40, $42, $45 & $56 and you can aim higher ($70) since the entry price is fairly too low.
NASDAQ:INTC

Upst is going up?Curious about your opinion.
What is you're analysis?
What I see:
- support on the volume shelf (daily chart)
- Volume is rising (daily chart)
- support on the moving averages (daily chart)
- higher high (daily chart)
- moving averages are rolling over
- broke the 4 sma on the weekly
- support at the all time low on the montly
- higher highs, higher lows on the 4 h chart
- rising trendline on the 4 h chart
- trading at the bottom of the channel that started 26-july, could serve as support
- soared 42% over 15 days so it could be an overbought situation
What is your opinion?
This is no financial advice.
NASDAQ:UPST

RSI Overbought & Oversold Strategy
What Is the Relative Strength Index (RSI)?
1. The relative strength index (RSI) is a popular momentum oscillator introduced in 1978.
2. The RSI is displayed as an oscillator (a line graph) on a scale of zero to 100.
3. An asset is usually considered overbought when the RSI is above 70 and oversold when it is below 30.
4. The RSI line crossing below the overbought line or above the oversold line is often seen by traders as a signal to buy or sell.
5. The RSI works best in trading ranges rather than trending markets.

50 Day Moving Average Strategy
TRADE ENTRY
1. To enter a 50-day moving average trade, you should wait for a breakout.
2. Whenever the price breaks the 50-day SMA, you should open a trade in the direction of the breakout.
3. In most cases, the price action will continue in the direction of the breakout.
STOP LOSS
1. If the price breaks the 50 SMA upwards, we need to go long, placing a stop below a bottom prior to the breakout. The opposite is true for bearish trades.
2. If the price breaks the 50 SMA downwards, we need to short the stock placing a stop below the bottom prior to the breakout.
PROFIT TARGETS
1. Hold your trades until the price action breaks your 50-day moving average in the direction opposite to your trade.
2. If you are long, you close the trade when the price breaks the 50-day SMA downwards.
3. If you are short, you close the trade when the price breaks the 50-day SMA upwards.
CONCLUSION
1. Stock price above the 50-day moving average is usually considered bullish.
2. Stock price below the 50-day moving average is usually considered bearish.
3. If the price meets the 50 day SMA as support and bounces upwards, consider a long entry.
4. Stock price meets the 50-day SMA as resistance and bounces downwards, consider a short entry.
5. If the price breaks the 50-day SMA downwards, you should switch your opinion to bearish.
6. If the price breaks the 50-day SMA upward, you should switch your opinion to bullish.

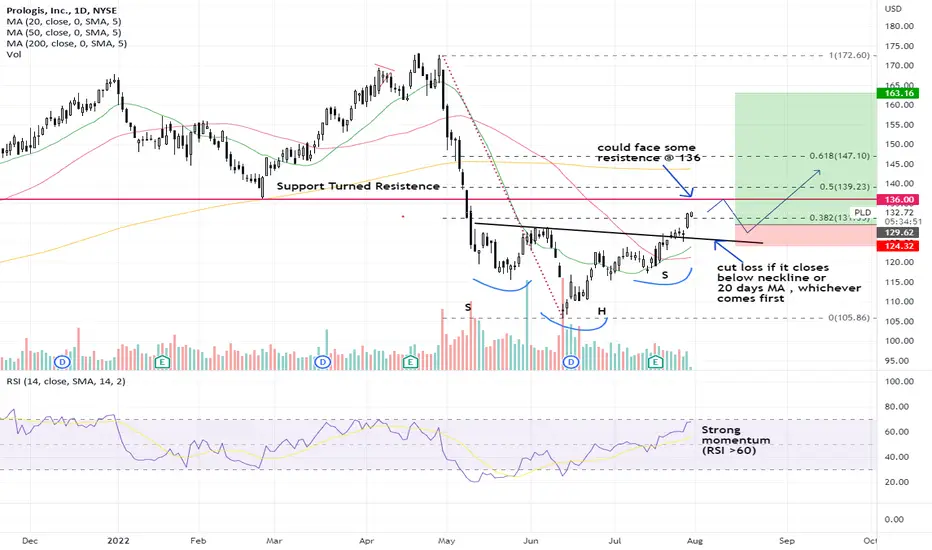
PLD - broke above inverted H&SMissed this boat as it broke out of an inverted Head & Shoulders neckline (@ 127) and at the moment it is near a possible resistence around 136. Will be interested to buy the next dip and will manage trade with trailing stops just below the 20 day moving average
RSI is strong at moment so the dip may not happen so soon. Let's see.
Disclaimer: Just my 2 cents and not a trade advice. Kindly do your own due diligence and trade according to your own risk tolerance and don't forget that money management is important! Take care and Good Luck!
Moving average and Fibonacci ActionHi everyone
Today, I shared an analysis based on Fibonacci and moving average, if it maintains its position in the channel and does not break the channel from the support area, this analysis can be valid.
-------
support my nfts in Foundation.app / Paperland

Buy ENPH (above the MA 35)I bought ENPH because its price is above the MA 35/13 and above the trend line.
My stop $168 and target $220 is on the chart. MM 1.67

Testing support level for ETHEth is testing the Euro 1122 level.
It was resistance but, once broken, ETH had a good rally up.
The support has been tested twice. Soon, as the downward EMA shows, this level will be tested again.
Will it last? If it breaks, how lo do you see ETH going?
I would like to read your comments. Thanks

June W.5: Short-term trend signal!Hi friends, I hope y'all having an amazing weekend and also preparing for the last week of the month ;)
Today, we got a counter-trend signal on this baby. This crypto has been dropping for weeks, and it didn't retest a couple of key level targets on the daily upwards. Moreover, huge gaps were formed between the price and short-term m.a's on the weekly and monthly, they have to be closed with retests that will fully confirm the bearish trend continuation that we hopped on - on the 1st week of May 2022 (check the previous posts). So, let us now look at how our trade will be triggered and dis-confirmed.
Bulls: -The price will bullish rally for the H&S and short-term m.a's trend and for the 200 m.a - probably after it has closed with a bullish reversal candle pattern above the 1st 4H Key Lvl and 8 m.a. I call this type of trade an "H&S A-E.3 signal"
Bears: -The price will dis-confirm this trade by dropping to its stop-loss point - probably after it has bullish bounced off the Daily Neckline 2 with a bearish reversal candle pattern that will lead the price to bearish break and retest 1st 4H Key Lvl together with the 8 and 50 m.a's.
That's it for today. I hope you found value in this. If you have a different concept, feel free to share it in the comments section or in private with me, I'd love to know what you're thinking!
Stay Blessed,
Doji-2k1.

200/110/2 Day MA SP500Chart configured to plot 200, 110, and 2-Day Moving Averages for the SP 500
Sorry, this is my first attempt at sharing a TV graph.
9581826.com


BTC - THE LAST STANDBTC currently sits at a major crossroad. We just broke down and negatively retested a very pivotal MA which has three times in the past sent BTC tumbling down 46 - 58 percent (scroll back to 2014 and see the same event play out).
Should history be anything to go by, we should see a down leg of approximately 40 percent, which aligns almost accurately with the 61.8 retrace of the move from 2020 lows.
Can we move upward from here? Yes! But we would first need to reclaim the MA, and in this regard, the statistics are against us. BTC has failed to regain it in all instances.
Moving on to technicals, we can see BTC clearly breaking down a huge bear flag. I'm not calling doomsday here, but all I'm saying is to exercise caution with longs at this point.
In summary, anywhere between 23k and 27k is very possible, maybe immediately, maybe a bit later in the year.
This is not financial advise in any manner. DYOR and manage your risk properly.
Best of luck from Commodore!

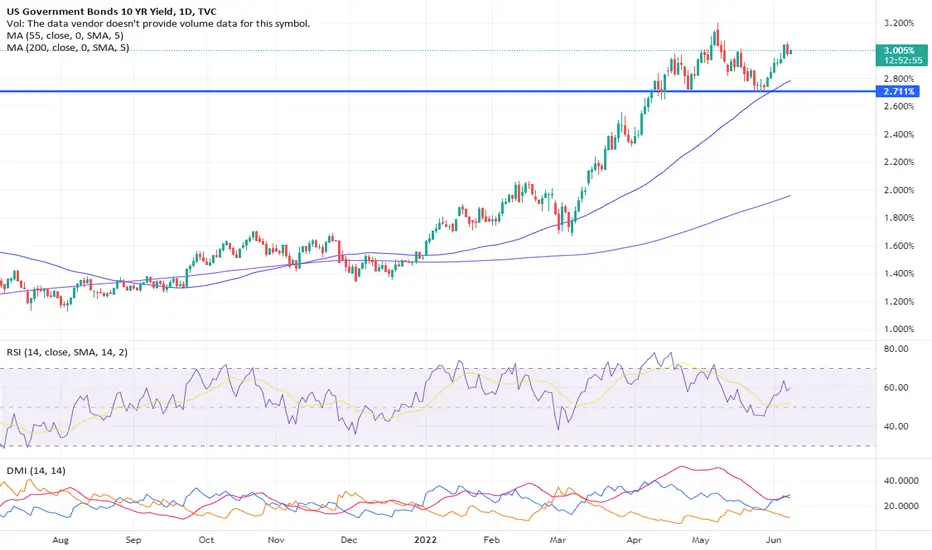
How I use moving averagesThe US 10Y yield continues to plough higher. We had been watching the support at 2.73 (end of April low) for a possible break but in the end, this held several attempts, and the market has recovered well. This support was reinforced by the 55-day ma, which lies at 2.78 currently and this has left the market well-placed to tackle the 3.20 May high.
In the past I used to regularly have discussions regarding the optimisation of moving averages, crossovers, whether to use simple, exponential or weighted moving averages and all I can say is that I have remained firmly married to the 20, 55 and 200 simple period moving averages for a very long time.
Firstly, I should state how I use them, and it is as a straightforward support and resistance tool. I have noted over time that markets tend to mean revert to their long-term moving averages and price action around particularly the 55 and 200-week moving averages can be critical for the long-term trend. Crossovers can also add weight to a view, but as these are lagging indicators, I normally have a view in place already. All I would say is try them out and see which one suits you.
John Murphy has this to say about moving averages:’ Even though there are clear differences between simple moving averages and exponential moving averages, one is not necessarily better than the other. Exponential moving averages have less lag and are therefore more sensitive to recent prices - and recent price changes. Exponential moving averages will turn before simple moving averages. Simple moving averages, on the other hand, represent a true average of prices for the entire time period. As such, simple moving averages may be better suited to identify support or resistance levels.
Moving average preference depends on objectives, analytical style, and time horizon. Chartists should experiment with both types of moving averages as well as different timeframes to find the best fit.’
There is plenty more commentary and analysis available if you join the STA. Become a member and get 10% off your first year’s subscription by quoting this code number STALINKEDIN
Disclaimer:
The information posted on Trading View is for informative purposes and is not intended to constitute advice in any form, including but not limited to investment, accounting, tax, legal or regulatory advice. The information therefore has no regard to the specific investment objectives, financial situation or particular needs of any specific recipient. Opinions expressed are our current opinions as of the date appearing on Trading View only. All illustrations, forecasts or hypothetical data are for illustrative purposes only. The Society of Technical Analysts Ltd does not make representation that the information provided is appropriate for use in all jurisdictions or by all Investors or other potential Investors. Parties are therefore responsible for compliance with applicable local laws and regulations. The Society of Technical Analysts will not be held liable for any loss or damage resulting directly or indirectly from the use of any information on this site.
GOLD Long-term trend signal!Hi friends, I hope y'all having an amazing weekend ;)
Today, we have a possible long-term 2 level drop of this double top that we'll exploit next week. However, we might not get or lose both trade signals because as we all know that the market has a lot of uncertainty that makes it a probabilistic environment. Therefore, let us take a look at how the bulls and bears might behave in triggering our trade signals and not.
Bulls: -The price may bullish rally for the previous H&S L2 together for the long-term m.a's (light blue and white/black) - probably after it has formed a bullish reversal pattern that will have its price bearish bounce off the Weekly H&S Neckline 2 and 50 m.a with a bullish reversal candle that will lead the price to bullish break and retest the patterns signal key level (that might be the 2nd Weekly Key Lvl) together with bullish crossed short-term m.a's (dark blue and red). If the price behaves in that manner, that will disconfirm our trades.
Bears: -If the price bearish breaks and retests the Weekly H&S Neckline 2 and 50 m.a either on the current or lower time frame (1st trade signal), and proceeds to bearish break and retest the 2nd Monthly Key Lvl (2nd trade signal) - that will fully confirm both trades long-term drop. I call these two trades a Double Top B-E.1 & E.2 signal/set-up.
That's it. I hope you found value in this. If you have a different idea, feel free to share it in the comments section, I'd love to know your thoughts!
Stay Blessed,
Doji-2K1

JICPT| NQ may drop further to 11500! Hello everyone. We see massive sell-off for the past few days. NQ has been down by over 25% from the peak created last Nov.
From the chart, we can clear see that the long-term MA(red color) has served as a good defense line that pushed price back to key fib level of 61.8%.
Unfortunately, the duo long-term MA has been firmly conquered. Where might the index go?
My guess is around 11500 by measured the move. Bullish buyers who tends to buy, better watch closely on how the index react to the level.
What do you think? Give me a like if you're with me.

EURJPY D1 Descending Channel For Daily ChartHello folks,
the chart-like price is now moving to a descending channel which indicates more bearish. So here is a brief strategy of this pair.

EURUSD Break above 21-EMAEURUSD Capped between 21-EMA and 55-EMA
Major resistance-1.07600
Near-term support- 1.0600
Trend reversal level- 1.0500

ICPUSD leg lower watch.
So is the honeymoon period over for the crypto recovery over TradingView community? Looking at several coins, we can see a similar pattern setting up. ICPUSD looks to be more on the weaker side so we have zeroed in on this coin.
Here are the points that have us looking for a new continuation lower. The counter-rally looks to have stalled. Sellers continue to pepper today’s price action. The last high looks to be an LH maintaining the normal pattern of trend. The MA and CCI both remain bearish.
It comes down to today’s session. Will we see a break of minor support signaling seller momentum is back? If sellers can take hold and beat support will also be looking for a break of the LL to show that the downtrend is looking to continue.
Good trading.

SOL bearish flag and EMAs#SOL/USDT
$SOL rejected from upper line of ascending channel which is the same with 50EMA and now struggle to break down from middle line that is the same with 20EMA.
🐻 breaking down from lower line of channel can drop price to $30, to complete bearish flag pattern.
🐮 holding the 20EMA and stay inside ascending channel can increase price to resistance zone between $47 and $80 which is the same with 200EMA.


EURGBP struggles at 200-DMA resistanceEUR/GBP extends sideways at 200-DMA resistance, focus on German/Eurozone GDP data for impetus
Price action is above 200-DMA and GMMA indicator shows intraday trend has turned neutral
- ADX and MACD support upside in the pair. 5-DMA is sharply higher
Support - 0.8391 (110-EMA)
