BTC - Continued Analysis - M-Pattern DANGERContinuing this analysis on the previous one; we see a double top form in the daily as well as the weekly timeframe after the price lost the 50 day moving averages.
In the previous analyses, we looked at Elliot Wave theory and a potential new ATH price zone. However, there was one risk even at that point - the M-Pattern. This pattern is BEARISH and usually leads to quite a significant drop.
The good news, though, is that this is all part of a healthy correction - as long as we hold THIS key zone identified inthe video, we are still well within a bullish market.
Previous update here, where we first spoke about the potential risk of the M-Pattern:
_____________________________
BINANCE:BTCUSDT
Moving_average

Very interesting similarity between the ES1! and YM1!I was recently watching a video in the ideas section of trading view and I notice this person speculates that the price will drop lower in the Dow Jones. Interestingly enough, this also lines up quite well in my charts. It's important to notice that many differences exist between these two tickers. The fluctuations of the CBOT_MINI:YM1! and the CME_MINI:ES1! are quite different. I had to adjust the n data previous points in the short term mean return indicator to 20 as well as set the sensitivity to 2. This way the chart was not overcrowded and easier to read. As well as larger short term MA and distribution was needed.
I'll take advantage of this difference to explain what happens when the parameters in the indicator change. There are two factors to the sensitivity of the indicator. One is the number of previous days considered (parameter n). The higher this value is, the less sensitive the indicator is, therefore it's better at detecting longer term trends. This is the reason why I include 2 in the indicator. One to see the short term trend and one for the long term trend. This in addition to knowing where we are in the distribution help me for a hypothesis of what is most likely to happen next.
One key factor of my strategy when trading is to never go short unless you are absolutely sure you are correct, always look for discounts and take profits. It's better to buy at discounted prices than trying to catch both waves of the market. You already know the market did one wave, what do you think will happen next? Of course, the next wave! I personally trade with no stop loss to not materialize erroneous entries and look to buy even more as prices continue to drop and are at attractive levels. Unless there is a clear possible break of market structure like it's visible here, as the 200MA has been used in the past as strong points of support and resistance. If this structure is broken, then it's quite possible that price will trend even lower, so this trade does require a stop loss.
When I was more of an intermediate and unprofitable trader, I relied a lot on two indicators, which did give me the ability to make somewhat accurate predictions. Since tradingview has kept increasing the restrictions on free accounts, I had to choose between two of my favorite indicators. The RSI and the MACD. I chose to keep the MACD as it's visible on previous trades. Mean Returns offers the value of these two indicators into one, plus tests out a new hypothesis that I've been testing so far with great success.
The basic premise of this indicator is to chart the market cycles in terms of average returns generated in the n periods before and the current one. Additionally, it creates the supposition that the market has inertia and therefore is likely to continue doing what it's already doing (aka: the trend is your friend)
I hope the original posters of the video @AdvancedPlays gets to see this and find it to be of value.
Always remember there are no certainties in the markets, only probabilities

BTCUSDT: QUICK UPDATE!!Hey everyone! If you enjoy this content, please consider giving it a thumbs up and following for more analysis.
BTCUSDT is forming a symmetrical triangle pattern on the 4-hour timeframe. A breakout from this pattern could signal a move in either direction.
Possible Scenarios:
Upward Breakout: A 4-hour close above the resistance level of the triangle could indicate bullish momentum.
Downward Breakout: A 4-hour close below the support level of the triangle could indicate bearish pressure.
What to Watch For:
Confirmation of Breakout: A 4-hour close above or below the triangle's boundaries strengthens the case in that direction.
Volume: Higher trading volume on the breakout can increase confidence in the signal.
Current Market Conditions:
This period of consolidation could be an opportunity to accumulate altcoins
What are your thoughts on BTC's current price action? What are you watching in the altcoin market? Share your analysis in the comments below!

FREMA Levels for StrategyFREMA facts:
Upper hot color bands are based on Buying Pressure
Lower cold color bands are based on Selling Pressure
This makes the levels of bands be more relevant to the candle metrics. The regular ATR bands the upper and lower levels expand equally with ATR change. Whereas FREMA levels expand and shrink by the change of 2 factors: Buying and Selling Pressure.
In a nutshell, it's the bullish and bearish parts of the candle measured with separate variables that govern the upper and lower bands independently. Therefore we can agree that out of all volatility bands, the FREMA is more native to the nature of ongoing price fluctuations.
The volatility levels can be implemented in strategy for trading the range of probabilistic prices. Combination with trend-following indicators can determine the condition of multiple buying orders at different cold color levels.
To be able to catch the very bottoms, the condition of bullish entry series should be set with 0 open trades unless the price or any other price-following substituting components are equal or lower than one of the lowest bands . This filters the entries from risks of buying as soon as price falls below middle deviation line.
For filtering with "Buying and Selling Pressure" use open source code below:

#BTC QUICK UPDATE: Support Zone In Focus!Hey everyone! If you find this content valuable, please consider giving it a thumbs up and following for more analysis.
BTC is currently testing support around the $66,500 level. This area coincides with the 100-day moving average (100MA), which can act as a support or resistance level.
Two potential scenarios emerge:
Scenario 1: Support Holds: If the price finds support at the current level and bounces back above the 100MA, we could see a move towards $68,000-$70,000 in the near future.
Scenario 2: Support Breaks: If the price breaks below the $66,500 level and closes decisively under the 100MA, further downside towards $64,000 becomes more likely.
Important to Remember:
What are your thoughts?
Share your analysis and any questions you have in the comments below!

Buy low sell fast strategyThe main idea of the strategy is that in the event of a sharp unexpected drop, coins usually grow back quite quickly. We simply draw a short SMA, and when the price deviates significantly from it, we buy, and when it returns, we sell.
We cannot buy every drop; it must be quite strong and sharp. If you buy early, you can buy at the beginning of a downtrend and sit in the position for a long time. Trying to buy very low will result in few trades.
However, you can trade several coins at the same time, and if you choose the parameters, you can get a stable profit.

BTC - Potential new ATH by the end of this monthWe're currently in a downtrend, with Lower Lows and Lower Highs; however, it seems to be looking slightly bullish right now. Lots of different data showing the price will likely increase to ~70k within the next few weeks.
There is a lot of resistance within the yellow zone highlighted here. The price will likely face rejection within this zone and if we're lucky will correct back to ~62k support at the lowest. From there there is a better chance of the 70k movement occurring.
The price is currently very undervalued, but also volume is quite low. This is likely due to the fact many have bought and are still holding, and new investors are waiting to see what will happen.
If the price however drops below 56.6k on the rejection, we may see extended bearish price movement to the 48-52k region, but likewise this should just be temporary; but it will postpone the 70k+ push by likely a few weeks.
If the trend however is bullish, this could result in a new ATH by the end of this month. A new ATH by the end of this month would put the price of BTC back on track with its trajectory to reach 198k by end of June 2025.

MNSO: turning up with some potential momentumMNSO getting some analyst attention lately with price targets around previous all time highs. 34EMA / 200 MA cross up is a sign of potential longer term uptrend and some momentum should price start to push up. Three targets above current move are previous pivot levels it came down from.

BTC Trend Projection - First steps to reach 198k by July 2025We are projecting an ATH of 198k by June 29th, 2025. For BTC to reach this it has some steps it needs to follow. These steps can be broken down into chunks and here we aim to break down the first part.
Likewise, here is a quick evaluation of how BTC is currently doing and what may happen in the upcoming few days to a month.
Bull:
BTC may have corrected downwards and sideways enough to become being properly evaluated. What this means is that BTC's Price and Halving projection line are very close together. This is great news as it means bullish momentum may be happening soon and this will help maintain a strong support and potentially the lowest the price may crash to in the upcoming few days.
Bear:
Unfortunately there is still some short term bearish momentum going on and the price may correct further to the 60-62k area. This should be only temporary and can be considered a good entry point to get into the market if you haven't already as most trading pairs are at a pretty good buy in price right now.
Conclusion:
Be cautious if you have a liquidation in the 60-62k price range as this correction may hit that area before the bullish momentum picks in and we slowly climb back to the 70k+ region.
If you haven't bought in yet, the next few days may be about the best you are going to get unless you want to wait until July 2026 where we may see a low of 50k..
BTC's bullish momentum may be very close to happening again, this short correction was necessary but may be almost over.
There is a potential possibility of side ways movement until May, however BTC is generally very volatile and there is a better chance we see 1-5% price movements up and down between 60-75k for the next month; so even though bullish movement may happen soon; there may still be bearish movements in between. The true parabolic movement is likely awhile away.
When BTC does exhibit parabolic movement, it usually does so for a few days to week before slowing down with a correction, consolidation and then continuation. Its never just straight up forever, be cautious!

Tilray approaching a swing trade and/or shorting opportunityNASDAQ:TLRY is approaching a resistance range and is at the top of a W pattern. It's rsi is also overbought above the 70 level. Volume is also trending upwards and has reached the level where the previous volume high (and price trend reversal) was.
The trading opportunity is around the 3 scenarios shown in the chart, with, due to the technical indicators mentioned above, scenario 2 and then 3 being the most likely.
Trading approach would be to wait until after the quarterly earnings are released and see if:
Scenario 1
The price breaks above the resitance range, apply a 3 day filter to ensure it's not a fakeout, and swing trade upwards to approx. $3.
Scenario 2
A more likely scenario, the price starts to decline and enter then enter into a short with a take profit at $1.60. Exact entry point for the trade might be difficult to determine, especially as the previous moves in price have been so explosive that there may not be an optimum tim eto enter, thus shorting would be a higher risk trade.
Scenario 3
Wait until the price reaches the support level since November 2023 (approx. $1.6) and enter a swing trade back up to the resistance range with an exit at approx. $2.5. To reduce risk, enter the swing with a combination of the RSI being at 30 and/or a 3 day filter to reduce the risk of the price breaking down from $1.6 to a new low.
Scenario 3.5
Same as scenario 3 but with the support level being around the DMAs and price range where the price movement faced some resistance on it's way up during mid-March 2024. A more likely scenario, the price starts to decline and enter then enter into a short with a take profit at $1.60. Exact entry point for the trade might be difficult to determine, especially as the previous moves in price have been so explosive that there may not be an optimum time to enter, thus shorting would be a higher risk trade.
NOTE:
Those with a risk appetite large enough may use the technical indicators mentioned in the first paragraph as enough of a comfirmation to enter a risky short trade:
Entry point: Now ($2.45)
Stop Loss: $2.70
Take Profit: $1.60
Risk:Reward ratio: 1:3


an illustrious Samurai SwordFollow the trajectory.
Will be a money-maker!
This stock will Regain its Previous High. It is Forming a basing Pattern so many Successful stocks lay out before going on to Astounding heights.
(There is also a chance that they will beat estimates, due to easy comp's and expectations.)

#EURGBP possible bearish moveAs depicted in the chart, the EURGBP pair is within a long-term bearish channel and is nearing its upper boundary, where it may face downward pressure.
Additionally, the price is currently trading at a significant resistance level that it failed to breach in its last attempt, suggesting a potential failure to break through again this time.
If you've found this analysis helpful, please take a moment to like, comment, or share your thoughts with me.

BTC Potential Correction to the 66-70k area in next few daysA small correction may soon occur. We are quite overvalued. We're just going to go over a few things so you may understand why we are saying this..
1. If BTC is to hit its projected ATH of 198k by end of June 2025, it needs to proceed at a specific slope/trajectory. This slope is vastly below the current price; residing at 54.4k.
2. We are outside of our YinYang True Value Zone. This currently resides at 68k.
3. We are still currently in a Blood Diamond; and likewise our Predictive Blood Diamond has occurred.
4. We have already hit a point where a Bearish Momentum shift should occur within our SFX Signals & Overlays; we're just waiting for the Bullish Momentum to end.. which may be soon.
5. The volume (you can see this at coinmarketcap.com) still isn't where we need it to be 80-100b+.
Conclusion: BTC and the Market is doing great; however there may be a correction coming soon... and it may be within the next few days. Please take caution and be aware of any risks involved with your trades.
Expectation: BTC may correct back to the 66-70k area within the next few days. This correction may go further, or it may quickly resolve back into the 70k+, however, please be advised, that simply based on the Trajectory we need to get to 198k by July 2025, we are insanely overvalued and a correction WILL happen at some point if 198k by July 2025 is the ATH.

ALGOUSDT Poised for Weekly Resistance Test: Can Bulls Breach theALGOUSDT is approaching a critical juncture, nearing a key resistance level of $0.2727 on the weekly chart. This analysis explores the potential for a breakout and the support levels to watch in case of a pullback.
Technical Analysis:
Resistance: $0.2727 (Weekly)
Support: $0.2199 (Daily), $0.1594 (Monthly)
Volume: Decent Buying Pressure
Moving Averages: 25 MA Acting as Support
Key Observations:
ALGOUSDT is facing a significant resistance level on the weekly chart. A breakout above this level could signal further upward momentum.
The recent price action indicates decent buying pressure, suggesting bulls are attempting to overcome this resistance.
The price has tested this weekly resistance twice on the daily chart, highlighting its importance.
The 25-day Moving Average (MA) is currently acting as support.
If the price fails to break above the weekly resistance, it could find support at $0.2199 on the daily chart and $0.1594 on the monthly chart.
A successful breakout could lead to further gains towards the next daily resistance level at $0.2376.
Conclusion:
The upcoming price action for ALGOUSDT hinges on its ability to overcome the key weekly resistance level. The presence of decent buying pressure and the supportive 25-day MA suggest a potential breakout. However, if the price encounters resistance, established support levels exist at $0.2199 (daily) and $0.1594 (monthly).
This information is for educational purposes only and should not be considered financial advice. Please conduct your own research before making any investment decisions.

CheckDot CDT/USDPossible great buy zone for CheckDot for long term hold. This insurance projects marketcap is ONLY 1,4 Million. I think this project is vastly underated. I'm looking for 20-100x for this hold in a few years. Patience is needed.
If price breaks the 200EMA zone, I'll take my calculated risk and wait for next big opportunity around 13 cents OR buy back if price gets back on top of the 200EMA zone.
As long as we have a DEFI which is has crazy amount of hacks, insurance will play a big part I believe.
Last year 2022 investors lost 3,8 BILLION due to crypto hacking.. That's a ridiculous amount.
Remember as this is a really small marketcap crypto it is quite illiquid.
Lets also check few things from weekly and monthly charts

Long on SencoMarket ain't stable.
So keep a SL tight. My analysis says we might see a good uptrend here.
Buy senco at 875-877 sl at 838 target 918,940,970+
RSI breakout done
All time high.

MACD Crossover - SUNTECK📊 Script: SUNTECK
📊 Sector: Realty
📊 Industry: Construction
Key highlights: 💡⚡
📈 Script is trading at upper band of BB.
📈 MACD is giving crossover .
📈 Double Moving Averages giving crossover.
📈 Right now RSI is around 61.
📈 There is Formation of Symmetrical Triangle breakout soon.
📈 One can go for Swing Trade.
⏱️ C.M.P 📑💰- 483
🟢 Target 🎯🏆 - 532
⚠️ Stoploss ☠️🚫 - 462
⚠️ Important: Always maintain your Risk & Reward Ratio.
✅Like and follow to never miss a new idea!✅
Disclaimer: I am not SEBI Registered Advisor. My posts are purely for training and educational purposes.
Eat🍜 Sleep😴 TradingView📈 Repeat 🔁
Happy learning with trading. Cheers!🥂

Adausdt.... Tecnicall analyst Ada has broken its downward trend at the price of 0.4622. It is now in an ascending triangle, according to Fibonacci, it will rise to the specified areas. It is also well supported by Moving average.
Be profitable and stable in life. ❤️

XAUUSD SHORT - GOLD UNDER PRESSURE❤️Forex Besties❤️
INFORMATION
Gold price attracts some buyers amid sliding US bond yields and subdued USD price action.
Geopolitical tensions in the Middle East further lend support to the safe-haven XAU/USD.
Delayed Fed rate cut bets could underpin the USD and cap gains for the non-yielding metal.
🔥Sell Gold 2013 - 2017 SL @2022
✅TP 1 @ 2007
✅TP 2 @ 1985
✅TP 3 @ 1977
❤️FOREX BESTIES WEB - Technical Analysis
Technical indicators SMA | EMA | MACD | SAR | VWAP | RSI | MARKET TREND | NEWS
❤️NOTE
Gold price (XAU/USD) edges higher during the first half of the European session and moves away from a two-month low, near the $1,984 area touched the previous day.
❤️MONEY CAPITAL MANAGEMENT
⚡️ Only Trade With Risk Capital
⚡️ Cut Losses Short, Let Profits Run On
⚡️ Avoid Using Too Much Leverage
⚡️ Avoid Taking Too Much Heat
⚡️ Do Not Give in to Greed
⚡️ Take profit equal to 4-6% of your capital
⚡️ Stop lose equal to 2-3% of your capital

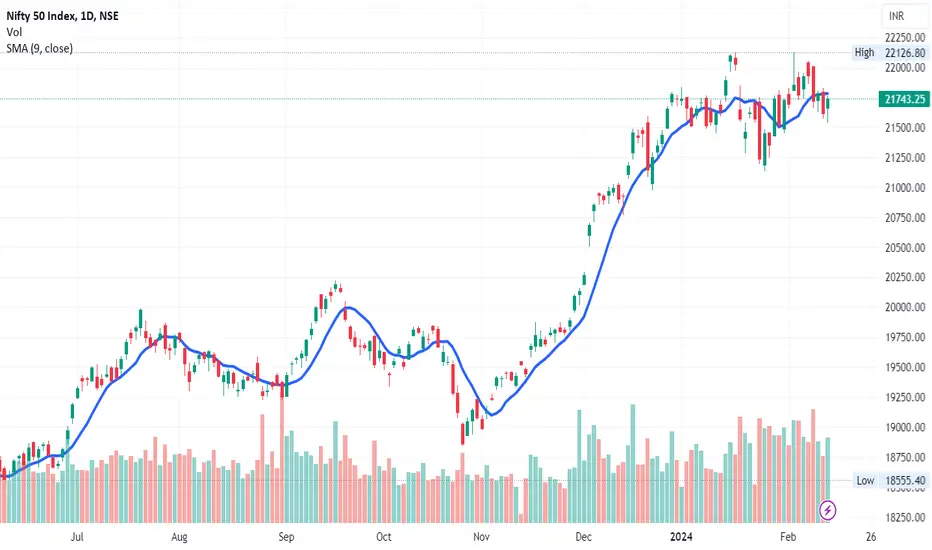
NIFTY DAILY - 15/2/2024The Nifty traded in a narrow range throughout the day and formed Doji candle on the daily chart.
Which is indicating indecisiveness amongst the participants.
Candle is closed above 9 days Simple Moving Average Line.
We may see resistance at 22115 level and support at 21748 level.
⚠️ Important: Always maintain your Risk & Reward Ratio.
✅Like and follow to never miss a new idea!✅
Disclaimer: I am not SEBI Registered Advisor. My posts are purely for training and educational purposes.
Eat🍜 Sleep😴 TradingView📈 Repeat 🔁
Happy learning with trading. Cheers!🥂

Sunworks correction/turnaround soon? ABC, potential to 2.70Sunworks suffered a lot already, and the stock almost in the graveyard. I am following it a while, was a nice short on the way down. Finally posted a tiny bit more positive earnings compared to expectation.
Meanwhile a falling wedge formation created. Also moving in a big downward channel. There are two scenarios for counting the waves, one scenario suggests, that the wave 5 down could be finished (1.618 extension was put in a few days ago), and we are up for at least an A-B-C upside correction.
Possibly (but not guaranteed) we just starting to put in the Wave "A", so far.
Consodilation in a smaller channel happening, with one breakout to the top,which could fall back. Important thing in order to have this idea a basis, is not to put in a new low (0.7252), and not to stay below comfortably 0.78. If that happens, then I need to assume new lows are coming.
It is possible, that this 0.78 level will be retested, I am following SUNW's actions now more closely.
On the daily, RSI is started to come up a bit, trying to leave the oversold levels. MACD coming up, a little bit week still.
The 9/15 SMA's starting to turn updwards, currently being a possible support. 21day EMA so far rejecting price actions, so we are squeezed in between those.
52day EMA/180 EMA, 200SMA coming down, 52 in a higher speed.
On the weekly, 200 SMA up at around 3.92; it is far away (to be a resistance)
Weekly RSI is on oversold levels (could drop more of course), trying to leave it, now showing sign of possible normalization,
MACD indicator could start to converge (in a few weeks could be divergenced, but no guarantee)
I have opened a long position( accumulation purposes), regardless of this idea.
I plan to open an other one for swing-trading, IF we restest the 0.78 fib level and popping back up from that (meaning possible wave 3 starting to the upside, and wave 2 is in)
Also be aware, as of now, the 1st quarter 2023 results,conference call and webcast was postponed, which might heavily influence the price actions (and sure it has a reason behind it.)
Resistance at 0.92, next resistance at 1.12.
No GAP below, next GAPs upwards:1.12; 1.62

NIFTY DAILY - 13/2/2024Nifty opened with negative note but bears were not able to sustain in the market.
The bulls attempted to stretch their arms for the session and made high of the day that is 21766.
Index has form green body candle with long lower shadow and upper shadow which indicates bulls are buying from lower end.
Another candle is closed below on 9 days Simple Moving Average line.
Index may find nearest resistance at 21912 level and 21632 will work as nearest support level.
⚠️ Important: Always maintain your Risk & Reward Ratio.
✅Like and follow to never miss a new idea!✅
Disclaimer: I am not SEBI Registered Advisor. My posts are purely for training and educational purposes.
Eat🍜 Sleep😴 TradingView📈 Repeat 🔁
Happy learning with trading. Cheers!🥂