Unveiling Bitcoin's Golden Bull Run | Masters EditionUnveiling Bitcoin's Golden Bull Run: A Comprehensive Technical Forecast
Bitcoin, the flagship of cryptocurrencies, has once again surged into the spotlight, signaling a potential golden bull run on the horizon. This comprehensive analysis leverages Fibonacci levels, trendline analysis, moving averages, and now, an exploration into long-term candlestick formations and their interplay with horizontal support and resistance levels. Let's delve deeper into the technical indicators forecasting Bitcoin's luminous path ahead.
1. Fibonacci Retracement: A Dance with the 78.6% Level
Bitcoin's recent price action has been nothing short of a technical analyst's dream. The cryptocurrency has tested the 78.6% Fibonacci retracement level, only to pull back to the 61.8% level, creating a suspenseful build-up. However, Bitcoin's resilience shone through as it catapulted back above the 78.6% level, setting its sights on the all-time high of $69,000. This movement not only demonstrates Bitcoin's strong market sentiment but also underscores the reliability of Fibonacci retracement levels as indicators of significant resistance and support.
2. Fibonacci Extension: Forecasting a Stellar Target
The Fibonacci extension tool, a favorite among traders for its uncanny ability to predict future valuations, has once again provided a glimpse into Bitcoin's potential trajectory. Currently, the tool forecasts an ambitious target of at least $128,000. This prediction is not plucked from thin air but is rooted in the tool's historical accuracy in pinpointing major price milestones for Bitcoin, offering a tantalizing glimpse into what the future might hold.
3. Trendline Analysis: Controversy Turns to Gold
While trendline analysis may spark debate among traders, its success in identifying key levels in Bitcoin's price history cannot be overlooked. Presently, these trendlines suggest the commencement of a golden bull run, pointing towards unprecedented higher levels. This analysis provides a roadmap for traders and investors, indicating significant points of interest and potential strategy adjustments.
4. Weekly MA and EMA: Shifting Sentiments
The weekly Moving Average (MA) and Exponential Moving Average (EMA) are showing a major shift in market sentiment, tilting the scales in favor of the bulls. These indicators, especially when configured with the right periods, can accurately pinpoint market reversals. The alignment of both MA and EMA in a bullish configuration underscores a growing optimism in the cryptocurrency market, suggesting that the current momentum could have the legs to sustain a prolonged upward trajectory.
5. Long-term Candlestick Patterns and Horizontal Support and Resistance
Adding another layer to our analysis, long-term candlestick formations offer invaluable insights into Bitcoin's market behavior. Over the years, these patterns have interacted with major levels of horizontal support and resistance, providing a historical context that underscores the significance of current price movements. These interactions reveal how Bitcoin has responded to previous periods of consolidation and breakout, informing predictions about its future trajectory.
The examination of how Bitcoin has navigated through these levels in the past can help anticipate its future movements. For instance, a break above a long-established resistance level might signal a strong continuation of the current bullish trend, while support levels that have held firm over the years could indicate potential rebound zones during pullbacks.
Conclusion: The Dawn of Bitcoin's Golden Era
The synthesis of Fibonacci retracement and extension levels, trendline analysis, moving averages, and long-term candlestick patterns with horizontal support and resistance provides a robust framework for understanding Bitcoin's potential. As we chart this journey, the anticipation of Bitcoin's next phases grows, with technical indicators aligning in favor of a significant bullish phase.
While the insights derived from these analyses offer a compelling narrative for Bitcoin's future, it's essential to approach investment with caution, recognizing the inherent volatility of the cryptocurrency market. Conducting thorough research and seeking diverse perspectives remain critical for making informed investment decisions.
To Learn More, Check Out Latest Analysis & Educational Publications
Mastering Fibonacci Retracement :Navigating Bitcoin's Volatility
Ethereum's Breakthrough: Navigating the Bull Run and Beyond
Disclaimer: This post is for informational purposes only and not financial advice. The cryptocurrency market is highly volatile and unpredictable. Engage in your research or consult with a financial advisor before making any investment decisions.
BITSTAMP:BTCUSD BINANCE:BTCUSDT COINBASE:BTCUSD BINANCE:BTCUSDT.P
Movingavarage

XEM Starting to breakout Ascending TriangleThe ADX Has Bottomed out showing we're soon to start rising and find strength in the upcoming Trend as well as currently Oscillators are traditionally performing better.
The MACD has recently signaled a buy and we're cruising above the signal line.
We're forming an ascending triangle with the price target taking us close to the next fib line more importantly running that 50 period moving average to form a golden cross more than likely forming a new more volatile uptrend!
Watch XEM Y'all
Fib Ranges have it running between 100-400%

Gold's Maintenance of Record Levels - Following Trend - TADear Esteemed Members,
Gold holds record levels, as the price is above its moving averages and the upper Bollinger band, indicating a strong bullish trend and a high volatility. The price could update the previous high in a wave y, and reach $2100 soon. RSI, stochastic, and OBV, to confirm the validity and strength of the trend.
Kind Regards,
Ely

Bitcoin AnalysisSo many ways you can look at Bitcoin and all say the same thing. My goal is to highlight the different perspectives in the market Crypto.
1. Eaglizer Strat Daily: Price needs to reclaim 8 EMA (white moving average) for upside.
2. Range: Price needs to reclaim the Median level (white dotted line) for more upside.
3. Trendline: Price needs to reclaim the Trendline (yellow) on for upside.
In summary we're at an area that will determine if we are going to reclaim and continue higher or go down for a correction.

CRV/USDT Accumulation PhaseBelow is the description of the accumulation phase potential development of the CRV/USDT cryptocurrency pair.
After reaching a local minimum in November 2022, when CRV was trading around $0.3982, there was a convincing upward movement that led to a significant increase to $1.29. During this period, the asset demonstrated a growth of more than 225%. Subsequently, the asset gradually declined, reaching a new local minimum at $0.3882.
During the price decrease, a descending trading channel was formed. At the moment, the asset is testing the upper boundary of this channel, which is occurring at the level of $0.6382.
Considering the current trends, we can assume that the asset is preparing to overcome the upper boundary of the trading channel. This could happen after a small corrective pullback to the average price within the descending channel.
Following a successful breakout above the upper boundary of the channel and a subsequent retest with a possible bounce from it, a positive signal for further growth of the asset can be expected. This scenario could indicate movement towards a price maximum at the level of $1.29.

Managing Gold Long & SL - A Multi-Indicator Consensus IndicatorDear Valued Investors,
O n the financial markets, we find ourselves immersed in the story of Gold (XAUUSD), a tale of resilience and growth. Since November 13, 2023, Gold has gracefully embraced a bullish trajectory, dancing its way from $1928 to a harmonious $2002. This surge reflects the prevailing positive sentiment within the market.
O ur cherished Multi-Indicator Consensus indicator , a guiding light in the complex world of trading, has been whispering about this bullish dance for the past two weeks. However, as we embark on this journey together, let us tread with both excitement and caution.
W hile the absence of a bearish signal is reassuring, prudence suggests that initiating a new long position at this juncture might be akin to stepping into the dance mid-performance. The prolonged bullish stride, unaccompanied by a recent confirmation signal, hints at the potential for a gentle retracement or a graceful consolidation period.
T o navigate the delicate balance of risk in our existing gold long position, we extend our hand to the wisdom of the trail profit stop-loss order. This order, a silent guardian in the realm of trading, elegantly adjusts the stop-loss level as the market rhythm unfolds. It allows us to savor the sweet taste of profits while gracefully curtailing potential losses.
F or our gold long position, consider setting the trail profit stop-loss order at a Fibonacci retracement level – perhaps the enchanting 0.382 or the harmonious 0.5 retracement level. These levels, like gentle notes in a melodic composition, often serve as supportive zones during the ebb and flow of market pullbacks.
A s we waltz with Gold's positive momentum, let us also be attuned to the nuances of increased risk that accompany holding a long position without a recent bullish signal. The overarching melody is one of positivity, but the absence of a fresh confirmation note calls for a measured and deliberate approach.
I n closing, while the Multi-Indicator Consensus indicator paints a portrait of optimism for Gold, the prolonged bullish journey without a recent signal and the elevated risk call for a symphony of risk management strategies. Consider the trail profit stop-loss order as a gentle partner, guiding you through the dance, protecting profits, and gracefully managing the inherent risks of the gold long position.
Disclaimer:
This heartfelt guidance is not to be construed as investment advice. As you waltz through the markets, remember that the rhythm of each trade is unique. We encourage you to perform your own due diligence or seek the counsel of a financial advisor before making any financial decisions.
With Warm Regards,
Ely

Gold has rejected 50 EMA on 15 minute Gold has rejected 50 EMA on 15 minute timeframe.
I see price blowing past zone (2048) and continuing its bullish run after 15 minute rejection.

Calling all investors!Overview
The Russell is at a potential attractive buy area for long-term investors.
The Details
The Russell ( FX:US2000 ) stock index is in a retrace move. Price is currently between the monthly 50 and 100 SMA's.
Historically, buying when the price is between the moving averages has been a favourable entry area for long-term investments.
Things to Consider
Recession could be on the horizon for the US. This would likely drive prices lower, especially for the Russell 2000.
Using an ETC, such as IWM, is often better for investing in stock indices than futures or OTC products.
Other stock indices may decline further before reaching new highs. The positive correlation between stock indices could bring the US2000 down further.

Bitcoin technical analysis _ 2023-10-29Update previous positions
Long position
After breaking the resistance at the price of 34818
Entry 35150
The loss limit is 34370
Risk Free 35925
Saving profit 36715
Profit limit 37645
------------------------------------------------
Short position
After breaking the important support at the price of 33590
Entry 33355
The loss limit is 34,000
Risk Free 32710
Saving profit 32065
Profit limit is 31200(Edited)
Restore original

Bitcoin technical analysis _ 2023-10-18Short position
After breaking the newly formed bottom box and the midline of the ascending channel, and also after breaking the important support at the price of 27,930
Entry 27860
The loss limit is 28,190
Risk Free 27525
(moving the stop to the entry point after breaking 27463)
Saving profit 27200
(Moving stop to risk to reward 1 if it reaches 27150)
Profit limit 26930

NDQ100 Bullish Week 10/16/23Expectations for Nasdaq: Bullish
Stop Loss: 14964.25 (indicated by red dash line)
Take Profit: 15404.63 (Bonus- 15474.63)
Support and resistance areas this week indicated by orange lines.
Prepare > Prediction

USDJPY Bearish Week 10/16/23Expectations for USDJPY: Bearish
Stop Loss: 149.764 (indicated by red dash line)
Take Profit: 148.364 (Bonus- 147.844)
Support and resistance areas this week indicated by orange lines.
Prepare > Prediction

GBPJPY Bullish Week 10/16/23Expectations for GBPJPY: Bullish
Stop Loss: 181.518 (indicated by red dash line)
Take Profit: 183.226 (Bonus- 184.276)
Support and resistance areas this week indicated by orange lines.
Prepare > Prediction

GBPJPY → Bearish reaction to trend resistance FX:GBPJPY is forming a retest of the descending channel resistance, forming a post facto logical reaction to the mentioned zone. At the moment, the downtrend is playing a relevant role
Fundamentally, we are living a very unstable time. Geopolitics has been sounding too much lately. Fund after a small bullish correction gives signals to further weakening on the background of strengthening of the TVC:DXY , which also negatively affects the currency pair analyzed by us. The rebound from the resistance zone is formed and the price returns under the level of 181.96. Consolidation of the price below this area will form a bearish potential, which can quickly bring the price down to 179.46 or 177.4. Bears are showing strength at the moment. The price is between the moving averages, consolidation may last for some time, but in the long term continue the realization of the previously formed bearish signal.
Support levels: 180.9, 179,46
Resistance levels: 181.96
In the long term, I expect the rate to continue to decline towards these targets.
Regards R. Linda!

Bitcoin Weekly Analysis- Sell Signal Below Resistance Trend Line
- Squeeze between EMA 144 and 233
- RSI Picking Up
- MACD Neutral/Descending
Looking back to 2020 we can see a similar pattern.
What this mean?!?....
Well, it can repeat the same pattern that seems more sensible to me or in case of breaking the EMA 233 we will see a continuation of the downtrend towards the $10,000 region.
It was like this throughout September, squeeze between the two EMAs.
We will definitely have a lot of volatility this month and perhaps until the end of the year.

🚀 BTCUSD #Bullish Signs: Prepping for Lift-Off? 🚀Understanding the BTCUSD Market (#Bitstamp) - Date: September 12, 2023, 22:47
The Big Picture:
Hey there! I've been looking into the BTC market, and I've found some interesting things. Before we dive deep, here's a quick summary: BTC's buying and selling activity is quite calm right now, but other signs suggest some upward energy. Let's break it down.
How Busy is the Market?
There aren’t many BTC trades happening right now. When the market is quiet like this, sudden spikes in buying or selling can shift prices quickly. So, keep an eye out!
Checking the Market's Pulse with Moving Averages:
Short-term (MA50 at 25,822.5): This tells us how BTC has been doing over the last 50 days. Right now, it's showing some positive vibes, but it's being a bit shy about aiming higher.
Mid-term (EMA144 at 26,379.7): BTC's price is playing it cool below this level. If it breaks past this, it's a good sign!
Long-term (MA200): Seems there's a mix-up with this number. Just a reminder to always double-check data!
Are We Overdoing It or Taking It Easy? (RSI):
The RSI tells us if BTC is being traded too much or too little. Right now, it's chill, not too high or low, hinting that there's still some room to grow.
Feeling the Market's Energy (MACD):
The MACD is like our market mood ring. Currently, it's glowing with a positive vibe, suggesting that BTC might want to dance upwards.
Setting Targets with Fibonacci:
Imagine if the market had steps it liked to climb or descend. That's what the Fibonacci levels help us with:
If BTC decides to go on a hike, first it will aim for 26,396.2. Past that, the next steps are 27,437.4 and then 28,279.
But if BTC wants to take a break and rest, the 25,822.5 step (our MA50) might be where it chills.
Here’s My Game Plan:
If we're hoping for a profit, we should aim for 26,396.2, then 27,437.4, and then 28,279. But if things don't go our way, consider stopping around 25,500 to avoid more dips.
A Final Note:
Even though things look promising for BTC right now, the crypto world can be full of surprises. Always stay updated with the latest news, and remember: knowledge is your best tool in this game.
🌟 Found this breakdown helpful? Join our community for more insights and elevate your trading game! ✅ #TradeWithConfidence
Happy trading! 🚀

BluetonaFX - EURGBP Ascending Triangle LONG IdeaHi Traders!
There is an ascending triangle formation on EURGBP, and there is a possibility of a breakout to the upside.
Price Action 📊
The market is in an ascending price channel with higher highs and higher lows since breaking above the 20 EMA, creating an ascending triangle pattern on the chart.
We are looking for a resistance break and a close above the 0.87014 level.
Fundamental Analysis 📰
The market's outlook on GBP is currently negative due to weak economic data recently released. The outlook on the GBP looks very negative at the moment, and the demand for the currency is very low, whereas the market's outlook on the EUR has been recently positive, with the ECB recently raising interest rates by 25 basis points to 4.00%.
Support 📉
0.86604: PREVIOUS DAY'S LOW
Resistance 📈
0.87014: TWO-MONTH HIGH
Risk ⚠️
No more than 2% of your capital.
Reward 💰
At least 4% of your capital.
Please make sure to click on the like/boost button 🚀 as your support greatly helps.
Trade safely and responsibly.
BluetonaFX

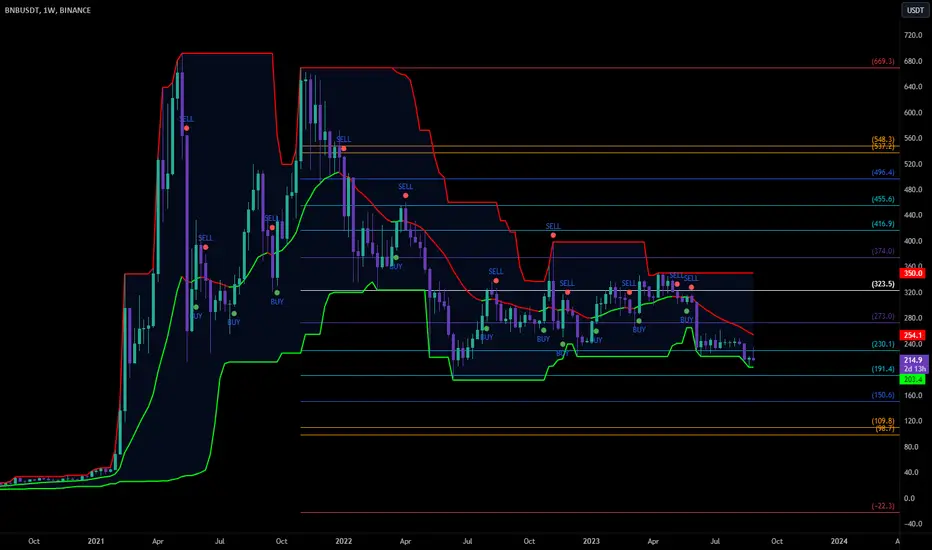
Binance (BNB) Price Analysis: Exploring Possible Targets💥 Target 1: $190 - A Stepping Stone on BNB's Path As Binance Coin faces potential price retracements, our first target lands at $190. This level represents a crucial support zone where #BNB may find stability and attract buying interest. Traders and investors will closely monitor BNB's price action as it approaches this level, seeking opportunities to accumulate or ride the upward momentum.
💥 Target 2: $150 - Seeking Consolidation and Rebounding Should BNB experience a deeper pullback, our second target awaits at the $150 level. This zone has historically acted as a consolidation area, providing a springboard for potential rebounds. Traders will keep a close eye on BNB's market dynamics and indicators for signs of a reversal, aiming to capitalize on a potential bounce from this level.
💥 Target 3: Between $98 and $110 - Unlocking the Golden Pocket Now, let's dive into the exciting concept of the Golden Pocket. This range, extending from $98 to $110, holds immense significance as a potential support zone for BNB. The Golden Pocket, derived from Fibonacci retracement levels, often serves as a turning point that attracts considerable buying interest.
If BNB's price retraces to this zone, it presents an enticing opportunity for traders to enter or add to their positions. The Golden Pocket captures the attention of many market participants, as it historically offers a compelling risk-to-reward ratio for long-term gains.
SP500 - A New Bullish Trend!Hi everyone,
After a LONG LONG LONG bear market, the time is now to share with you some positive news!
Lets see one of my favorite indicator : MA 50 and 200 timeframe 3 days (Usually I use 4 : RSI, Fibonacci, Hash Ribbon timeframe Weekly and MA 50 and 200 timeframe 3 days).
I noticed a new GOLDEN CROSS that appeared very recently... Each time we get this Golden Cross, we has started a great bullish trend. And for more conviction, I'm waiting for a new higher high.
I stay careful until we break the last ATH...
Let's get the ball rolling!
Stay safe!
Take a look to the NASDAQ analysis :
PS: it's not a Financial Advice.

NASDAQ - Moon SignalHi everyone,
After a LONG LONG LONG bear market, the time is now to share with you some positive news!
You can hear everywhere the US recession and Im agree with that (too much money has been created since the COVID). So, I expect about a correction during the next months, probably before spring 2024, but it will not a "death" correction until you hit the bottom of the abyss.. it would be probably something like in 2020, March (hard and fast correction)...
BUT
The trend show us that we probably started a new BULLISH Trend ! Is that true?!
Lets see one of my favorite indicator : MA 50 and 200 timeframe 3 days (Usually I use 4 : RSI, Fibonacci, Hash Ribbon timeframe Weekly and MA 50 and 200 timeframe 3 days).
I noticed a new GOLDEN CROSS that appeared very recently... Each time we get this Golden Cross, we has started a great bullish trend. And for more conviction, I'm waiting for a new higher high.
I stay careful until we break the last ATH...
Let's get the ball rolling!
Stay safe!
PS: it's not a Financial Advice.

Bitcoin:Monthly chart ViewHi guys.
Hope you have had perfect trades.
In this idea i will share you some TA perspectives about
Bitcoin Longterm reactions according to historical datas.
As you can see each time the price reached the MA50 , made a
trough below it and then come back above.
Now we can se in Monthly chart that after price shaped
a Bottom under MA50 , it tries to come back above with a
Bullish Engulfing pattern.
after that we surpass MA50 with another white candle and now ,
Unfortunately we have some frauds in market.
(China Evergrande Group bankruptcy and Tesla sold
millions of BTC).
So in my opinion after a few weeks , Bitcoin start to continue
its smoothed run and go towards 36000.
its the level we will see at the end of 2023.
after that...
Lets see what will happen and dont predict far futures :)
If you like my opinion please tell me yours in comment.
Thank you all my friends

Bitcoins weekly EMA'sWhen looking at bitcoins weekly EMA's we have a few interesting things develop. First,we have the 20 EMA crossing under the 200 EMA, coincidentally, its also the first time the 50 EMA has crossed under the 200 EMA. ( side note , the 100 has never crossed under the 200 and i dont expect it to this bear cycle.) To me both of these occurrences mark the bottom especially when looking at the longer time frames. The price rarely wants to stay under the 200 Weekly EMA which we're currently testing at around 25668.
in the coming weeks i foresee the 20 crossing back above the longer time frames and we rally towards 35k to 42k before retesting 28.8 k as support.

GOLD → The bears are taking the gold to the den OANDA:XAUUSD amid numerous resistance retests is not yet able to break it. Fundamental data is still on the side of the dollar. The gold price continues to fall and update the lows
The price bounces off the channel resistance and falls, testing 1890. A false breakout is formed against the mentioned support and the price starts a local rebound. Most likely, gold may test 1900 in the near future before falling further. There is still a strong bearish trend in the market.
Yesterday's fundamental data is positive for USD. As the dollar index strengthens, we see the gold price falling. In the medium term, we should expect the metal price to continue falling.
Support levels: 1890
Resistance levels: 1900
I expect a retest of the resistance area before a further fall.
Regards R. Linda!
