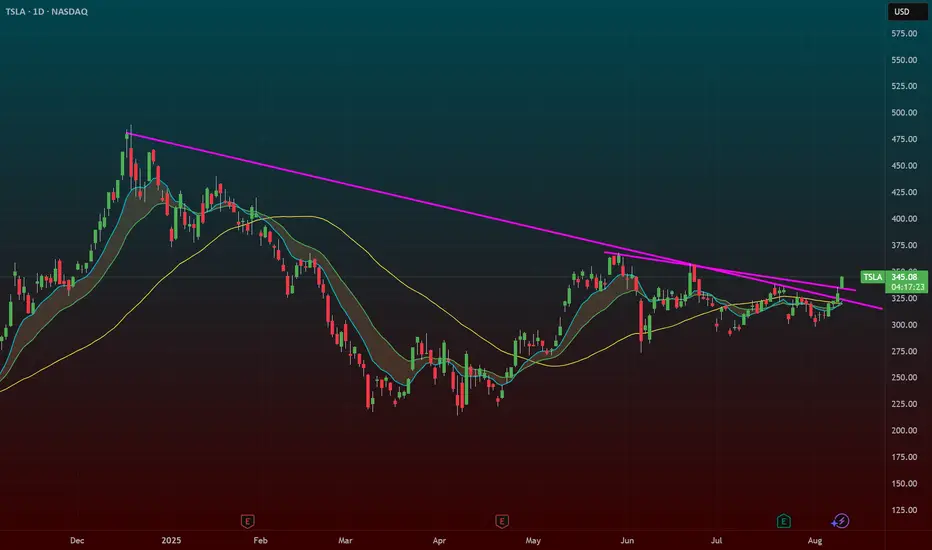
$TSLA – Wedge Breakout with Rotation PotentialNASDAQ:TSLA – Breaking Out of a Big Wedge After Earnings Reversal
Tesla ( NASDAQ:TSLA ) just broke its wedge pattern after a strong post-earnings recovery, and the price action says a lot about where sentiment is shifting.
🔹 Earnings Flush → Strong Absorption
Earnings reaction was ugly — big gap down and heavy selling.
Since then, NASDAQ:TSLA has been shrugging off negative news — sales data, guidance cuts, analyst downgrades — all absorbed without breaking down.
This tells me buyers are quietly accumulating.
🔹 Rotation Narrative
The rest of the Mag 7 has been ripping for months.
NASDAQ:TSLA is the laggard — and now traders are rotating into the one big name that hasn’t moved yet.
If it holds here, the upside could be sharp.
🔹 My Trade Plan:
1️⃣ Starter Long: Took an entry on the wedge trendline break.
2️⃣ Why Not Full Size Yet? This is day 4 of the move — in my playbook, that’s a starter size only.
3️⃣ Add Trigger: If we get an inside day or small dip that holds above the 9 EMA, I’ll add the rest of the position.
4️⃣ Stop: Under the wedge breakout level for now.
Why I Like This Setup:
Wedge break + rotation narrative + strong news absorption.
Market psychology turning — when a stock stops going down on bad news, it’s often about to go up.
Starter now, add on the dip = structured risk.
Moving Averages
Bearish Flag in PayPal?PayPal has limped as the broader market flirts with new highs, and some traders may see downside risk.
The first pattern on today’s chart is the drop on July 29 after the company reported quarterly results. While some of the numbers beat, investors focused on lower profitability. Are fundamentals deteriorating?
Second, prices continued lower the next three sessions. They inched slightly higher before stalling again, creating a potential bearish flag.
The drop occurred at the 8-day exponential moving average (EMA), which is also below the 21-day EMA. MACD is falling as well. Those patterns may be consistent with a short-term downtrend.
Finally, the 50-day simple moving average (SMA) had a “death cross” below the 200-day SMA in April and has stayed there since. That may suggest a longer-term downtrend has begun.
TradeStation has, for decades, advanced the trading industry, providing access to stocks, options and futures. If you're born to trade, we could be for you. See our Overview for more.
Past performance, whether actual or indicated by historical tests of strategies, is no guarantee of future performance or success. There is a possibility that you may sustain a loss equal to or greater than your entire investment regardless of which asset class you trade (equities, options or futures); therefore, you should not invest or risk money that you cannot afford to lose. Online trading is not suitable for all investors. View the document titled Characteristics and Risks of Standardized Options at www.TradeStation.com . Before trading any asset class, customers must read the relevant risk disclosure statements on www.TradeStation.com . System access and trade placement and execution may be delayed or fail due to market volatility and volume, quote delays, system and software errors, Internet traffic, outages and other factors.
Securities and futures trading is offered to self-directed customers by TradeStation Securities, Inc., a broker-dealer registered with the Securities and Exchange Commission and a futures commission merchant licensed with the Commodity Futures Trading Commission). TradeStation Securities is a member of the Financial Industry Regulatory Authority, the National Futures Association, and a number of exchanges.
TradeStation Securities, Inc. and TradeStation Technologies, Inc. are each wholly owned subsidiaries of TradeStation Group, Inc., both operating, and providing products and services, under the TradeStation brand and trademark. When applying for, or purchasing, accounts, subscriptions, products and services, it is important that you know which company you will be dealing with. Visit www.TradeStation.com for further important information explaining what this means.

GAMUDA - Leading stock in CONSTRUCTION SECTORGAMUDA - CURRENT PRICE : RM4.97
Based on Japanese Candlestick , 30 April 2025 candle was a LONG CLOSING BOZU WHITE CANDLE . At that particular moment, it changed the trend from BEARISH to BULLISH because :
1) Price already above EMA 200 and closed on that day above EMA 50
2) Price closed into ICHIMOKU CLOUD
3) CHIKOU SPAN starts moving above CANDLESTICK
4) MACD also bullish
At current moment, after two days of selling pressure the share price turns positive today and closed higher than previous day's high. This may consider as potential buy on dips for those didn't have position yet. Supported by rising EMAs, the share price may move up to test the all time high level.
ENTRY PRICE : RM4.94 - RM4.98
TARGET : RM5.36 and RM5.57
SUPPORT : Below EMA 50 on closing basis

Wynn Resorts Approaches Key LevelWynn Resorts has consolidated for more than a month, and some traders may think it’s preparing for a breakout.
The first pattern on today’s chart is the July 2023 peak of $112.25. WYNN stalled below that old high a few times in the last two years. However, it tested the level in early July and has lingered near it since. Could the casino operator move through that resistance?
Second, consider the one time it tried to drop on August 8. Prices opened under a late-July low but quickly recovered. The resulting false breakdown could also be viewed as a bullish signal.
Third, the 50-day simple moving average (SMA) began July with a “golden cross” above the 200-day SMA. That may suggest WYNN’s long-term trend has grown more bullish.
Finally, unusual options activity yesterday seemed to reveal positive sentiment into the opening of the key Wynn Al Marjan Island project.
TradeStation has, for decades, advanced the trading industry, providing access to stocks, options and futures. If you're born to trade, we could be for you. See our Overview for more.
Past performance, whether actual or indicated by historical tests of strategies, is no guarantee of future performance or success. There is a possibility that you may sustain a loss equal to or greater than your entire investment regardless of which asset class you trade (equities, options or futures); therefore, you should not invest or risk money that you cannot afford to lose. Online trading is not suitable for all investors. View the document titled Characteristics and Risks of Standardized Options at www.TradeStation.com . Before trading any asset class, customers must read the relevant risk disclosure statements on www.TradeStation.com . System access and trade placement and execution may be delayed or fail due to market volatility and volume, quote delays, system and software errors, Internet traffic, outages and other factors.
Securities and futures trading is offered to self-directed customers by TradeStation Securities, Inc., a broker-dealer registered with the Securities and Exchange Commission and a futures commission merchant licensed with the Commodity Futures Trading Commission). TradeStation Securities is a member of the Financial Industry Regulatory Authority, the National Futures Association, and a number of exchanges.
TradeStation Securities, Inc. and TradeStation Technologies, Inc. are each wholly owned subsidiaries of TradeStation Group, Inc., both operating, and providing products and services, under the TradeStation brand and trademark. When applying for, or purchasing, accounts, subscriptions, products and services, it is important that you know which company you will be dealing with. Visit www.TradeStation.com for further important information explaining what this means.

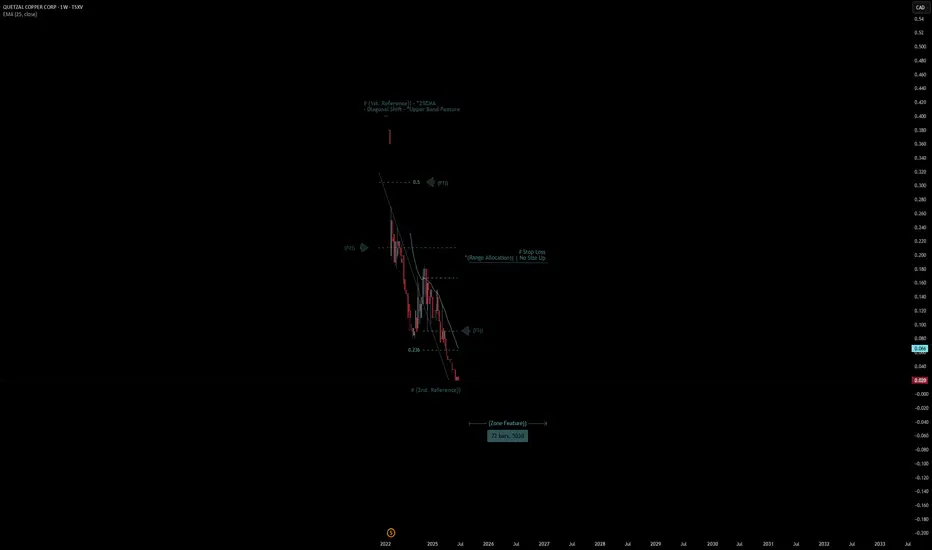
Quetzal Copper Corp Quote | Chart & Forecast SummaryKey Indicators On Trade Set Up In General
1. Push Set Up
2. Range Set Up
3. Break & Retest Set Up
Notes On Session
# Quetzal Copper Corp Quote
- Double Formation
* (1st. Reference)) - *25EMA | Subdivision 1
* (Range Allocation)) | No Size Up | Completed Survey
* 72 bars, 503d | Date Range Method - *(Uptrend Argument))
- Triple Formation
* (P1)) / (P2)) & (P3)) | Subdivision 2
* Weekly Time Frame | Trend Settings Condition | Subdivision 3
- (Hypothesis On Entry Bias)) | Indexed To 100
* Stop Loss Feature Varies Regarding To Main Entry And Can Occur Unevenly
- Position On A 1.5RR
* Stop Loss At 9.00 CAD
* Entry At 5.00 CAD
* Take Profit At 0.50 CAD
* (Downtrend Argument)) & No Pattern Confirmation
- Continuation Pattern | Not Valid
- Reversal Pattern | Not Valid
* Ongoing Entry & (Neutral Area))
Active Sessions On Relevant Range & Elemented Probabilities;
European-Session(Upwards) - East Coast-Session(Downwards) - Asian-Session(Ranging)
Conclusion | Trade Plan Execution & Risk Management On Demand;
Overall Consensus | Sell
Evolent Health | EVH | Long at $9.45While 2025 is expected, and has been, a bad year for Evolent Heath NYSE:EVH , the growth prospects look very, very promising. However, I will caution that the price could almost be cut in half from its current trading value ($9.45) with another poor earnings in 2025. This definitely isn't an "it's only up from here" stock. The price entered my "crash" simple moving area (green lines) twice and a third time could occur before the end of the year ($4-$5 range as of this writeup).
Regardless of bottom predictions, earnings for NYSE:EVH are expected to rise from $1.9 billion in 2025 to $3.2 billion in 2028. EPS predicted to rise from $0.26 in 2025 to $1.18 in 2028. Debt-to-equity = 1.2x (okay, below 1 is best), Quick Ratio, or the ability to pays current bills is = 1x (okay, between 1.5 and 3 is best), and bankruptcy risk is relatively high (but reduced interest rates may help). Insiders have purchased over $11 million in shares this year with a cost average (~$23): much higher than it's current trading price.
So, while it seems there could be some short-term risks for Evolent Health, the future beyond 2025 is bright (based on company projections). Thus, at $9.45, NYSE:EVH is in a personal buy zone with potential downside risk near $4-5 in the near-term.
Targets into 2028:
$15.00 (+58.7%)
$20.00 (+111.6%)

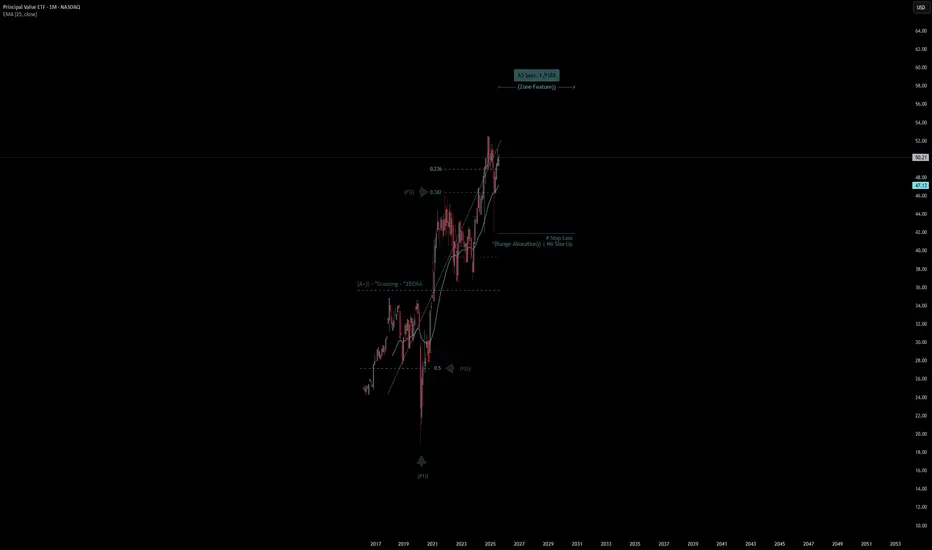
Principal Value ETF Quote | Chart & Forecast SummaryKey Indicators On Trade Set Up In General
1. Push Set Up
2. Range Set Up
3. Break & Retest Set Up
Notes On Session
# Principal Value ETF Quote
- Double Formation
* (A+)) - *Crossing - *25EMA | Subdivision 1
* (Range Allocation)) | No Size Up | Completed Survey
* 63 bars, 1.918d | Date Range Method - *(Uptrend Argument))
- Triple Formation
* (P1)) / (P2)) & (P3)) | Subdivision 2
* Weekly Time Frame | Trend Settings Condition | Subdivision 3
- (Hypothesis On Entry Bias)) | Regular Settings
* Stop Loss Feature Varies Regarding To Main Entry And Can Occur Unevenly
- Position On A 1.5RR
* Stop Loss At 42.00 USD
* Entry At 48.00 USD
* Take Profit At 59.00 USD
* (Uptrend Argument)) & No Pattern Confirmation
- Continuation Pattern | Not Valid
- Reversal Pattern | Not Valid
* Ongoing Entry & (Neutral Area))
Active Sessions On Relevant Range & Elemented Probabilities;
European-Session(Upwards) - East Coast-Session(Downwards) - Asian-Session(Ranging)
Conclusion | Trade Plan Execution & Risk Management On Demand;
Overall Consensus | Buy
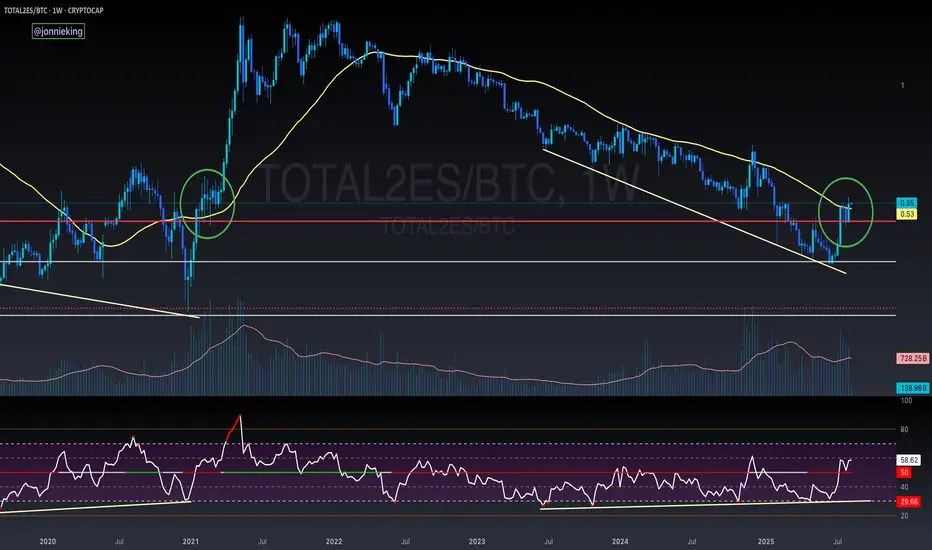
$TOTAL2ES/BTC Showing Hopes of Alt SeasonPromising Weekly Close above the WMA50 for CRYPTOCAP:TOTAL2 against CRYPTOCAP:BTC
PA needs to stay above here the next few weeks so that this does not end up like another prior fake out.
I have a feeling this will be a big week (next tweet 🤑)
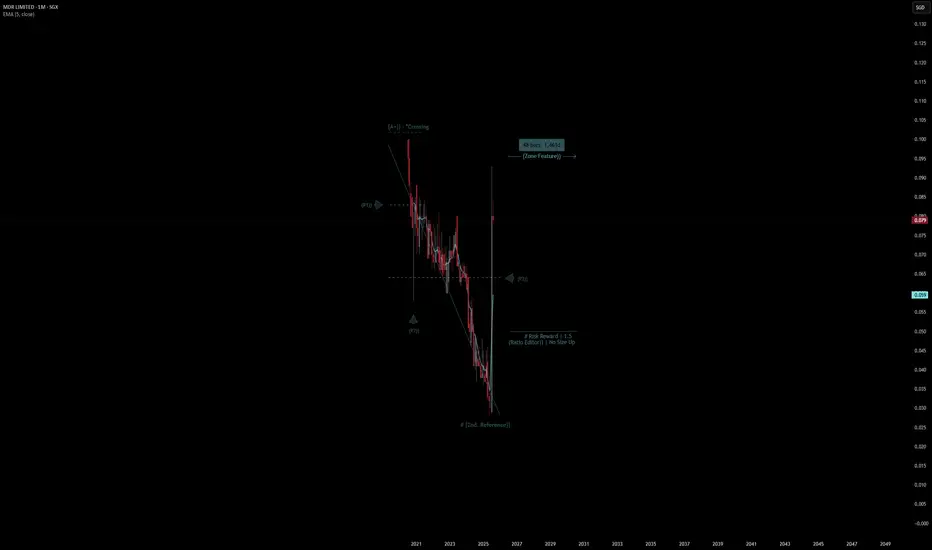
MDR Limited Quote | Chart & Forecast SummaryKey Indicators On Trade Set Up In General
1. Push Set Up
2. Range Set Up
3. Break & Retest Set Up
Notes On Session
# MDR Limited Quote
- Double Formation
* (A+)) - *Crossing At 0.101 SGD | Subdivision 1
* #(2nd. Reference)) | No Size Up | Completed Survey
* 43 bars, 1.311d | Date Range Method - *(Uptrend Argument))
- Triple Formation
* (P1)) / (P2)) & (P3)) | Subdivision 2
* Weekly Time Frame | Trend Settings Condition | Subdivision 3
- (Hypothesis On Entry Bias)) | Regular Settings
* Stop Loss Feature Varies Regarding To Main Entry And Can Occur Unevenly
- Position On A 1.5RR
* Stop Loss At 0.050 SGD
* Entry At 0.065 SGD
* Take Profit At 0.085 SGD
* (Uptrend Argument)) & No Pattern Confirmation
- Continuation Pattern | Not Valid
- Reversal Pattern | Not Valid
* Ongoing Entry & (Neutral Area))
Active Sessions On Relevant Range & Elemented Probabilities;
European-Session(Upwards) - East Coast-Session(Downwards) - Asian-Session(Ranging)
Conclusion | Trade Plan Execution & Risk Management On Demand;
Overall Consensus | Buy
XAUUSD BUYS PROJECTIONS Hey everyone happy new week 😇…So for the past week no trade yet cuz Gold is ranging but this week as we can see on the chart price is pushing higher I will be watching the market to see if Gold can close above that sellers zone to get in for buys and will update everyone if am executing a trade so let’s see how the week play out Great success 👍..

$LINK Golden Cross Confirmed on DailyChainlink is looking extremely bullish here.
Closed above the 50% Gann Level and just had a GOLDEN CROSS.
Normally we see a pullback once this happens, but no sign of slowing down yet from CRYPTOCAP:LINK
Also worth noting LINK is breaking above the 50DMA against ETH.
This was added confirmation for the breakout with ETH / BTC.
Remember the rotation for Alt Season:
BTC > ETH > LARGE CAPS (pending) > Mid Caps > Micro Caps

Victrex PLC Quote | Chart & Forecast SummaryKey Indicators On Trade Set Up In General
1. Push Set Up
2. Range Set Up
3. Break & Retest Set Up
Notes On Session
# Victrex PLC Quote
- Double Formation
* # (1st. Reference)) - Lower Band| Subdivision 1
* # Stop Loss - *Medium Range | No Size Up | Completed Survey
* 36 bars, 252d | Date Range Method - *(Uptrend Argument))
- Triple Formation
* (P1)) / (P2)) & (P3)) | Subdivision 2
* Weekly Time Frame | Trend Settings Condition | Subdivision 3
- (Hypothesis On Entry Bias)) | Indexed To 100
* Stop Loss Feature Varies Regarding To Main Entry And Can Occur Unevenly
- Position On A 1.5RR
* Stop Loss At 58.00 GBP
* Entry At 55.00 GBP
* Take Profit At 50.00 GBP
* (Downtrend Argument)) & No Pattern Confirmation
- Continuation Pattern | Not Valid
- Reversal Pattern | Not Valid
* Ongoing Entry & (Neutral Area))
Active Sessions On Relevant Range & Elemented Probabilities;
European-Session(Upwards) - East Coast-Session(Downwards) - Asian-Session(Ranging)
Conclusion | Trade Plan Execution & Risk Management On Demand;
Overall Consensus | Sell

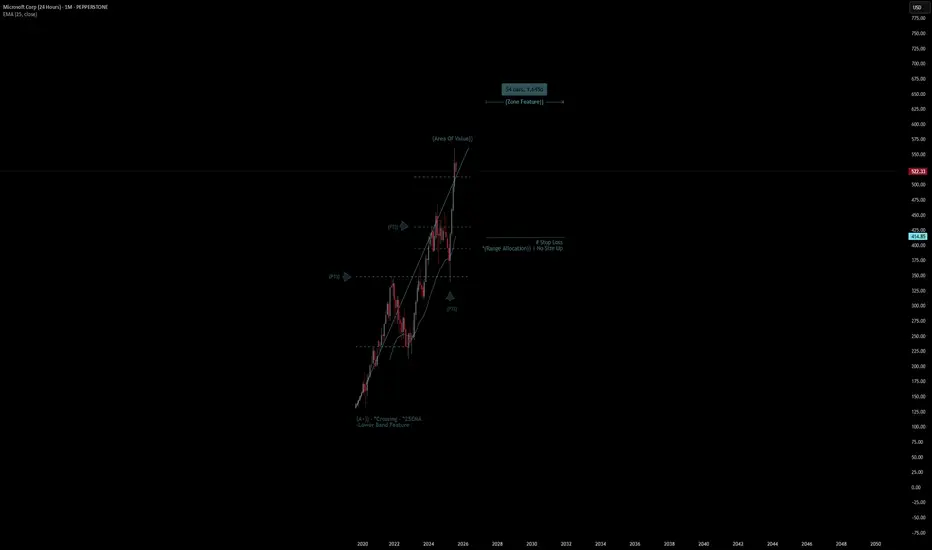
Microsoft Corp (24 Hours) Quote | Chart & Forecast SummaryKey Indicators On Trade Set Up In General
1. Push Set Up
2. Range Set Up
3. Break & Retest Set Up
Notes On Session
# Microsoft Corp (24 Hours) Quote
- Double Formation
* (A+)) - *Crossing - *25EMA | Subdivision 1
* (Area Of Value)) At 565.00 USD | Completed Survey
* 52 bars, 1.582d | Date Range Method - *(Uptrend Argument))
- Triple Formation
* (P1)) / (P2)) & (P3)) | Subdivision 2
* Monthly Time Frame | Trend Settings Condition | Subdivision 3
- (Hypothesis On Entry Bias)) | Regular Settings
* Stop Loss Feature Varies Regarding To Main Entry And Can Occur Unevenly
- Position On A 1.5RR
* Stop Loss At 435.00 USD
* Entry At 520.00 USD
* Take Profit At 650.00 USD
* (Uptrend Argument)) & No Pattern Confirmation
- Continuation Pattern | Not Valid
- Reversal Pattern | Not Valid
* Ongoing Entry & (Neutral Area))
Active Sessions On Relevant Range & Elemented Probabilities;
European-Session(Upwards) - East Coast-Session(Downwards) - Asian-Session(Ranging)
Conclusion | Trade Plan Execution & Risk Management On Demand;
Overall Consensus | Buy
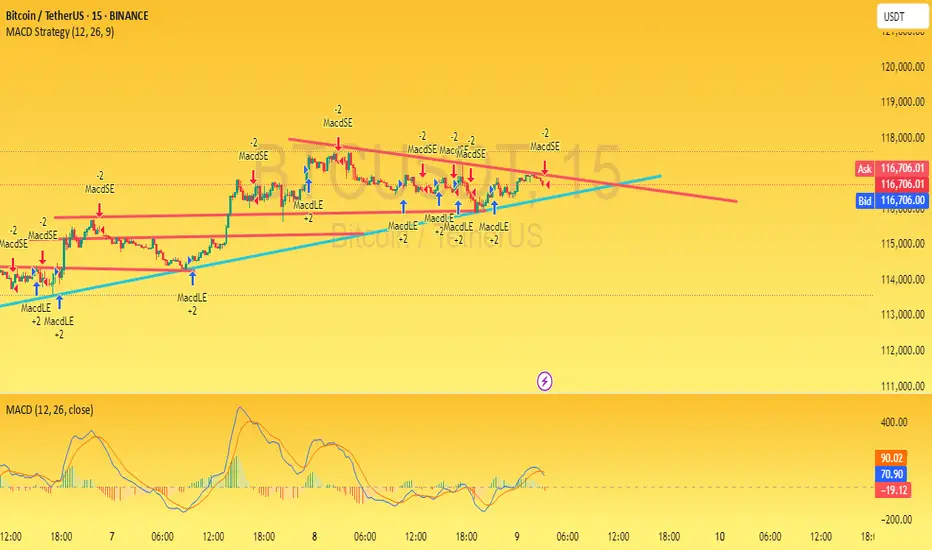
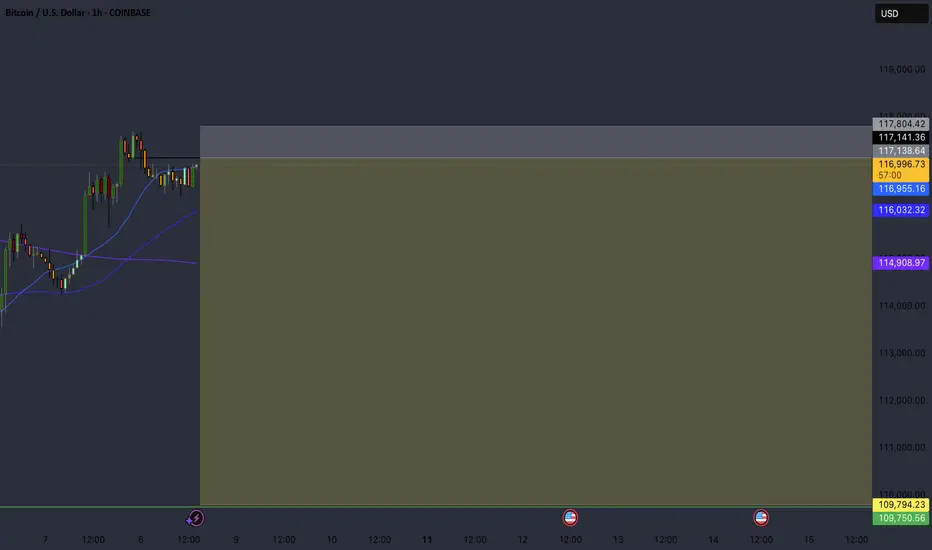
BTCUSDT – Key Resistance Breakout or Rejection? (15-Min AnalysisIn the 15-minute chart of BTCUSDT , the price is currently approaching a significant resistance level. Based on the MACD indicator, bullish momentum is gradually building up, which may lead to a breakout above this resistance. If the breakout occurs with strong volume, the price is likely to move higher, potentially opening the way for short-term bullish opportunities.
However, if the price fails to break above this level and faces rejection, it could signal a shift in market sentiment, leading to a potential downside move. In such a case, we might see the market testing lower support levels in the short term.
Traders should monitor the breakout zone closely and wait for confirmation before entering a position. Managing risk with a proper stop-loss is essential given the volatility on lower timeframes.
Crocs | CROX | Long at $98.00If the overall/long-term upward momentum continues, Crocs NASDAQ:CROX may be nearing bounce territory at $98 as it reaches the bottom of my selected historical simple moving average (SMA). While there may be a near-term downtrend to close out a few price gaps ($80s-$90s) below the current price, the stock looks incredibly poised for an upward move as the Santa Claus rally nears. Fundamentally, a P/E of 7x, low debt, and a low float (56M) with 7% short interest all works in the favor for this stock/company. Thus, at $98, NASDAQ:CROX is in a personal buy zone.
Target #1 = $110
Target #2 = $125
Target #3 = $135
Target #4 = $155 (long-term)

Figs Inc | FIGS | Long at $5.24Figs Inc $NYSE:FIGS. Technical analysis play first, fundamentals second.
My selected historical simple moving average lines have converged with the stock price, which often leads to sideways trading and a reversal in the downward trend (i.e. future price increase). The downward trend is flattening, but that doesn't mean post-earnings drop to $1.50-$2.00 isn't out of the question...
The FIGS brand is growing within the healthcare world with significant opportunities overseas. While economic headwinds may impede near/medium-term growth, revenue is anticipated to grow into 2027. EPS is expected to rise from 0.01 in 2024 to 0.20 by 2027. While this is not a "value" play and there is high risk for rug pulls, something may be brewing within the chart for a move up. Tread lightly, however...
Targets
$6.00
$6.40
$7.00
$8.00

Ethereum | ETH | Long at $2,598.77Currently within my historical simple moving average area and consolidating. I suspect a move up is imminent, but 100% speculation. Crypto "bros" know more than I do.
Targets into 2028:
$4,000 (+53.9%)
$5,500 (+111.6%)

STILL SHORT Similar Bias, nothing has changed. Following previous setup with moves that continue to show my outlook.
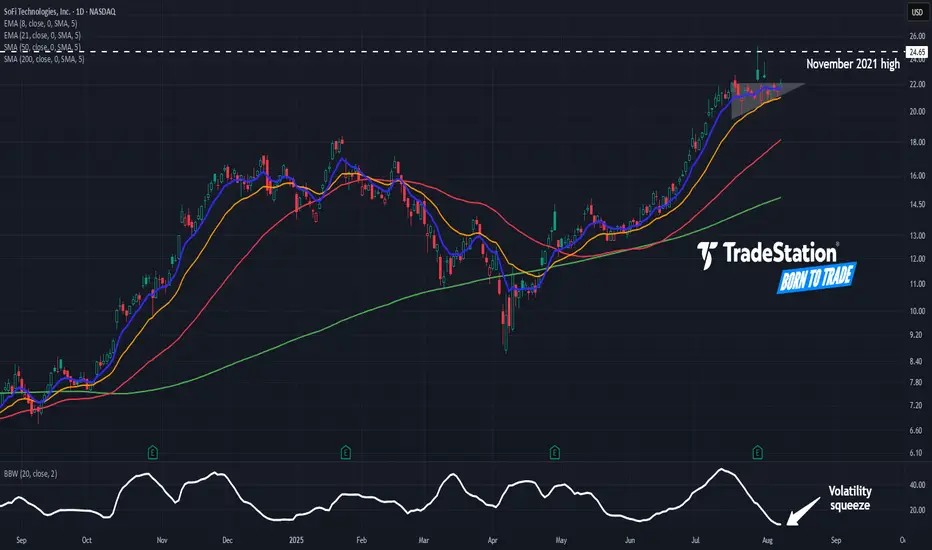
SoFi: Ascending TriangleSoFi Technologies rallied sharply in June and early July. Now, after a pause, some traders may see further upside.
The first item on today’s chart is the July 17 close of $22.09. The financial stock has remained mostly trapped below that level while making higher lows. The resulting ascending triangle is a potentially bullish continuation pattern.
Second, Bollinger Band Width has narrowed to its lowest reading since June 2024. Such tight consolidation may reflect a lack of selling pressure.
Third, the 8-day exponential moving average (EMA) has remained above the 21-day EMA. That may reflect bullishness in the short term.
Next, prices are consolidating below previous record highs from 2021. (The peaks then ranged from $24.65 to $28.26.) Could the stock challenge its old highs?
Finally, SOFI is an active underlier in the options market. Its average volume of 411,000 contracts would rank 11th in the S&P 500 (if it were a member), according to TradeStation data. That could help traders take positions with calls and puts.
TradeStation has, for decades, advanced the trading industry, providing access to stocks, options and futures. If you're born to trade, we could be for you. See our Overview for more.
Past performance, whether actual or indicated by historical tests of strategies, is no guarantee of future performance or success. There is a possibility that you may sustain a loss equal to or greater than your entire investment regardless of which asset class you trade (equities, options or futures); therefore, you should not invest or risk money that you cannot afford to lose. Online trading is not suitable for all investors. View the document titled Characteristics and Risks of Standardized Options at www.TradeStation.com . Before trading any asset class, customers must read the relevant risk disclosure statements on www.TradeStation.com . System access and trade placement and execution may be delayed or fail due to market volatility and volume, quote delays, system and software errors, Internet traffic, outages and other factors.
Securities and futures trading is offered to self-directed customers by TradeStation Securities, Inc., a broker-dealer registered with the Securities and Exchange Commission and a futures commission merchant licensed with the Commodity Futures Trading Commission). TradeStation Securities is a member of the Financial Industry Regulatory Authority, the National Futures Association, and a number of exchanges.
Options trading is not suitable for all investors. Your TradeStation Securities’ account application to trade options will be considered and approved or disapproved based on all relevant factors, including your trading experience. See www.TradeStation.com . Visit www.TradeStation.com for full details on the costs and fees associated with options.
Margin trading involves risks, and it is important that you fully understand those risks before trading on margin. The Margin Disclosure Statement outlines many of those risks, including that you can lose more funds than you deposit in your margin account; your brokerage firm can force the sale of securities in your account; your brokerage firm can sell your securities without contacting you; and you are not entitled to an extension of time on a margin call. Review the Margin Disclosure Statement at www.TradeStation.com .
TradeStation Securities, Inc. and TradeStation Technologies, Inc. are each wholly owned subsidiaries of TradeStation Group, Inc., both operating, and providing products and services, under the TradeStation brand and trademark. When applying for, or purchasing, accounts, subscriptions, products and services, it is important that you know which company you will be dealing with. Visit www.TradeStation.com for further important information explaining what this means.
GBPUSD: Enough? 1.3460 has the answer!We were anticipating a move above 1.3396 since last week, and now it finally happened. Now, our eyes are on our #1 key resistance in this area: 1.3460. A solid penetration of this level would signal more gains, and a continuation of the rising move from Aug 1st bottom.
On the other hand, failure to overcome this key level would signal a high probability that this whole move was corrective. In this case, a drop of 300-400 pips should be expected.
The 4H candle chart has generated signs of weakness ahead of 1.3460, which is encouraging for the bears, who may use this weakness to kickoff a drop that may be able to challenge, or dive below 1.3138, during the next 1-2 weeks.
A short at current prices* is a low-risk high-reward trade with a stop of about 60 pips, and a limit of 5X that number, since if we get to 1.3138 again, that is more than 300 pips in profit. Our analysis of the 4h chart shows that all the bears need to start digging is for 1.3460 to survive & show that it is a key resistance indeed.
Always remember, risk management is the #1 factor in your success or failure in trading, not analysis. Always risk very low percentages of your account on each trade. Only you can manage the risk in your account.
As always, Good Trading & Good Luck!
*We are trading around 1.3445 as this idea is being written.

EUR/USD at Major Resistance Confluence – Rejection Ahead?EUR/USD – Key Decision Zone
The price is testing a major confluence between horizontal resistance (1.16–1.20) and a long-term descending trendline. The weekly RSI shows overbought conditions, similar to 2017, 2018, and 2021 — all followed by corrections. Likely scenario: a possible false breakout above resistance followed by rejection and consolidation. Price action in this zone will be crucial.
Technical Analysis Process: EUR/USD (Weekly Chart)
1. Descending Red Line (Trendline)
This line represents a long-term dynamic resistance.
It has been respected multiple times in the past, which increases its relevance.
The current price action is approaching this trendline again, suggesting a potential bearish reaction from sellers.
2. Static Resistance Zone (Upper Brown Rectangle)
Ranges approximately between 1.16 – 1.20.
Historically acted as both support and resistance, marking it as a strong horizontal level of confluence.
Now overlaps with the descending trendline, increasing its technical significance.
3. Major Support Zone (Lower Brown Rectangle)
Located around 1.03 – 1.05.
This is the area from which the price previously launched a strong upward movement, potentially marking a cyclical bottom.
Projected Scenario (Yellow Arrow)
Indicates a possible false breakout above the resistance area and trendline.
Suggests a structure of consolidation or distribution, where price may spike above key resistance but quickly retreat.
This could lead to a retracement back toward lower support, or act as a base before a real breakout develops.
RSI Indicator (Relative Strength Index)
Weekly RSI is currently in the overbought zone, near the 70 level.
The vertical dotted orange line aligns with previous RSI peaks (2017, 2018, 2021), each followed by major tops and corrections.
This pattern suggests that the market could again experience a local top and a retracement after this overbought signal.
Overall Interpretation
EUR/USD is currently at a critical technical zone, where:
A long-term trendline and a horizontal resistance intersect.
RSI signals a potential reversal point.
The most probable outcome (as indicated by the yellow arrow):
A short-lived breakout above resistance, followed by a bearish rejection and consolidation.
Alternatively, price could consolidate here before attempting a stronger breakout.

"I remember this chart pattern in 2020.. Just before the big.."This one is going to be epic..this coming economic collapse is
going to make people rich and sadly the middle class poor
Believe it or not.I remember this chart pattern in 2020..
Just before the big market crash.
They say the poor can not get poorer
but its the middle class that gets poor
This means the average young people are
going to lose their jobs or decide to get a second job,
Capitalism is a factor of production
and having buying power
is the best feeling in the world
because i have been unemployed for a long time.
Capitalism is the only place i call home.
Even in the difficult times.
Capital markets have been my food and drink.
My hopes and dreams.
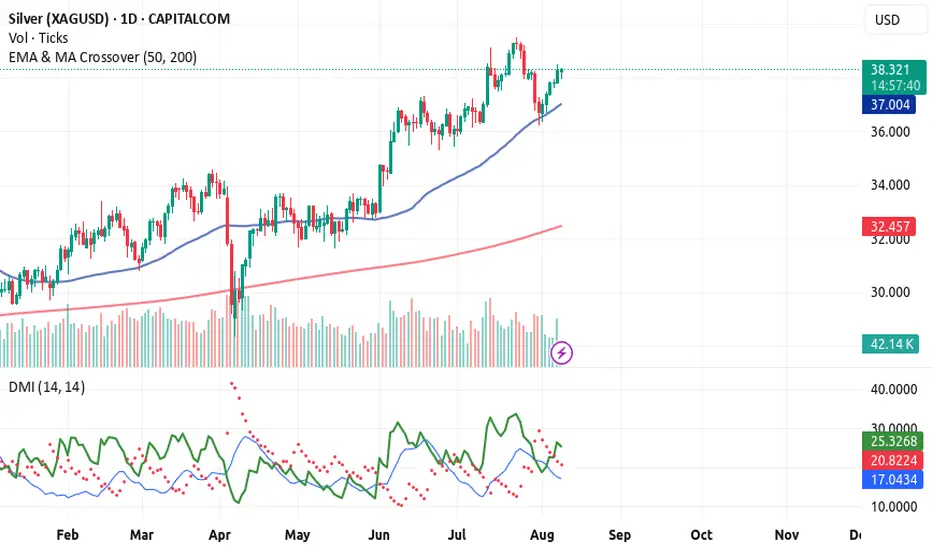
The silver TVC:SILVER price is going up because
it is following the rocket booster strategy
So what is the rocket booster strategy?
This strategy has 3 steps:
1-The price has to be above the 50 EMA
2-The price has to be above the 200 EMA
3-The price should gap up
That last step is very important
because you can see the gap from the
ADX indicator below
That trend line [ green line ]
shows that buyers are gaining strength
and running the market
But that line [ Blue line below the red line and green line]
also shows that a BIG move is coming
this big move is going to be Massive..
You will hear about it in the news by the time
it hits its peak this is going to be like 2020...
Just watch out anyway buy silver now.
Rocket boost this content to learn more.
Disclaimer:Trading is risky please
learn risk management and profit taking strategies.Feel free to use a simulation trading account before you trade with real money.
XLV SHORTMonthly chart - Head and shoulders pattern with a break below neckline and 200MA. Target for the pattern is around 118 looking to pick up long term shares there.
