Bark | BARK | Long at $0.84BARK, Inc. NYSE:BARK is a dog-focused company offering subscription-based products like BarkBox and Super Chewer, delivering monthly toys, treats, and pet supplies. It operates in Direct-to-Consumer and Commerce segments, selling through its website, retail partners, and e-commerce platforms. While not overly bullish here, especially given the economic / recession-fear headwinds, I think this is one of those stocks that may have a future "pop" as interest rates are lowered, or news emerges of the company expanding to new retail partners. A few insiders have recently purchased shares (~$75k under $1.00) and others have been awarded options. The book value currently rests near $0.64. It may dip between that price at $0.50 in the near-term. However, that's just been the trajectory of SO many of these SPAC stocks... dip then pop or bust.
Fundamentally, nothing to uproar over and this is a risky investment (Nasdaq delisting may occur). The positive is the debt-to-equity in 0.9x, which is pretty good for a small company. But 2026 is expected to be its worst earnings year. The future may look bright in 2027 and beyond, but can the company last? Time will tell.
Thus, for a swing trade, NYSE:BARK is in a personal buy zone at $0.84 with a risk of further near-term decline between $0.50 and $0.64.
Targets into 2027
$0.95 (+13.1%)
$1.25 (+48.8%)
Moving Averages

Hasboro | HAS | Long at $66.00Hasboro $NASDAQ:HAS. Bouncing in an out of the historical simple moving average (SMA). While it may take a bit for it to spring out and continue its upward trend, it looks poised to do so. However, there is a small price gap that was never closed in the $40's that investors should stay cautious of if the downward trend continues. But a "confirmation" of a reversal will be either a continued move up or a retest of the lower historical SMA band (to close the recent price gaps) followed by a further move up. Fundamentally, NASDAQ:HAS has a high level of debt, but earnings growth is forecasted in its future. At $66.00, $ NASDAQ:HAS is in a personal buy zone, but patient investors may wish to wait for further confirmation of a reversal.
Target #1 = $73.00
Target #2 = $81.00
Target #3 = $87.00
Target #4 = $119.00 (very long-term...)

THG Holdings PLC Quote | Chart & Forecast SummaryKey Indicators On Trade Set Up In General
1. Push Set Up
2. Range Set Up
3. Break & Retest Set Up
Notes On Session
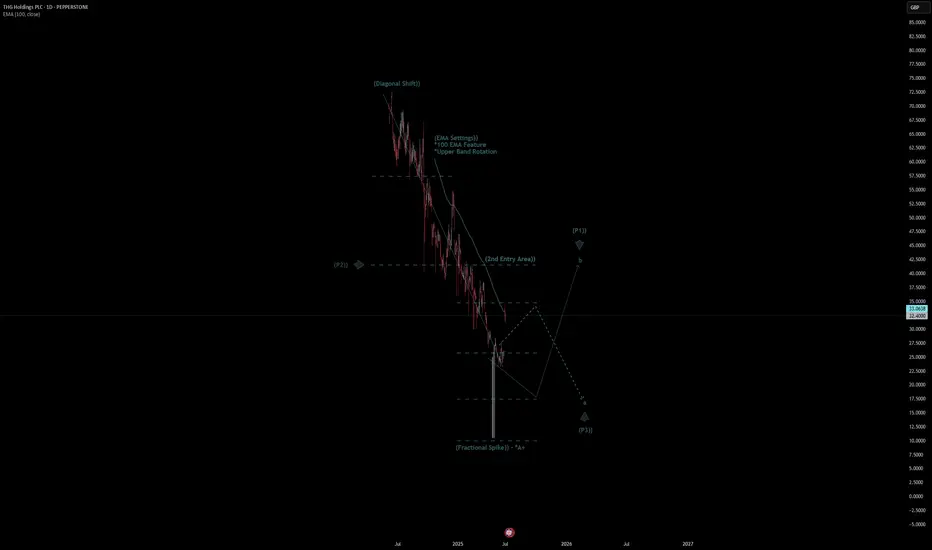
# THG Holdings PLC Quote
- Double Formation
* (Fractional Spike)) - *A+ | Completed Survey
* (EMA Settings)) - *100 EMA Feature | Subdivision 1
- Triple Formation
* (P1)) / (P2)) & (P3)) | Subdivision 2
* (TP1) = a / Long Consecutive Range
* (TP2) = b / Short Consecutive Pullback | Subdivision 3
* Daily Time Frame | Trend Settings Condition
- (Hypothesis On Entry Bias)) | Indexed To 100
- Position On A 1.5RR
* Stop Loss At 54.00 GBP
* Entry At 46.00 GBP
* Take Profit At 34.00 GBP
* (Downtrend Argument)) & No Pattern Confirmation
- Continuation Pattern | Not Valid
- Reversal Pattern | Not Valid
* Ongoing Entry & (Neutral Area))
Active Sessions On Relevant Range & Elemented Probabilities;
European-Session(Upwards) - East Coast-Session(Downwards) - Asian-Session(Ranging)
Conclusion | Trade Plan Execution & Risk Management On Demand;
Overall Consensus | Sell
SelectQuote | SLQT | Long at $2.18SelectQuote NYSE:SLQT is currently resting within my historical simple moving average zone. This often signals consolidation and a future move (in this case, let's hope up). Looking at the company's financials, NYSE:SLQT is currently profitable. For Q3 2025 (ended March 31, 2025), the company reported a net income of $26.0 million, up from $8.6 million in Q3 2024. This follows a strong Q2 2025 with a net income of $53.2 million. While like most companies there are likely headwinds in 2025 (earnings are projected at a loss of -$0.20 per share due to seasonal fluctuations and investments in 2025 (e.g., new Kansas facility)), profitability is likely to stabilize in 2026, with EPS forecasts of $0.05, supported by improved Medicare reimbursement rates and operational efficiencies. Ongoing Department of Justice allegations could pose risks... but SelectQuote’s recent $350M investment and cost management suggest profitability may continue if legal issues are resolved favorably.
Thus, at $2.18, NYSE:SLQT is in a personal buy zone. There is a potential for the price to dip to the bottom of the historical simple moving average channel (near $1.25) in the near-term, but time will tell.
Targets:
$2.64
$4.24

Ethereum & monthly 20MAEthereum is gaining strength and will likely break above the monthly 20 MA. Will it maintain this momentum by month's end and remain bullish in the coming months?
Good luck HODLRS ✌️🤞

GBPUSD – Classic FRL setup unfoldingWe have a clear descending channel (wedge) on H1, with the price testing the neckline level after a corrective consolidation.
According to Fractal Reversal Law (FRL):
The neckline is drawn horizontally at the start of the last impulse, not on the top of the candle wicks.
The price has retested the neckline multiple times, forming a clean structure before potential continuation.
The 100 SMA is above the price, confirming the bearish structure and scale alignment.
Trade Plan:
🔻 Entry: Below the neckline on confirmation of breakout.
🔻 Stop Loss (SL): Above the upper boundary of the channel and last swing high (clearly marked on the chart).
🔻 Take Profit (TP): At the intersection of the lower channel line with the long-term ascending trendline (green support), around 1.34 area.
Confirmation:
• The MACD shows momentum fading, indicating a potential downside move aligning with the FRL setup.
• We expect a clean impulse downward after a tight consolidation, providing a high-probability entry.
Following the FRL principles, we wait for a clean breakout below the neckline to confirm the structure shift before entering.

#BTCEUR #1D (Binance) Bull-flag breakout and retestBitcoin looks very good for bullish continuation after regaining 50MA support on daily, against the Euro.
⚡️⚡️ #BTC/EUR ⚡️⚡️
Exchanges: Binance
Signal Type: Regular (Long)
Amount: 12.0%
Entry Targets:
1) 93017.86
Take-Profit Targets:
1) 108422.28
Stop Targets:
1) 85296.36
Published By: @Zblaba
CRYPTOCAP:BTC BINANCE:BTCEUR #Bitcoin #PoW bitcoin.org
Risk/Reward= 1:2.0
Expected Profit= +16.6%
Possible Loss= -8.3%
Estimated Gaintime= 1-2 months

$BTC Tapping ATH - Is this REAL!?YUUUGE Daily Close today for CRYPTOCAP:BTC
Bullish cross on the 20/50MA.
Appears to have broken out of a bull flag.
Need PA to stay within this POI in order to confirm another leg up.

ETH Just Reached the Floor — This Is the Starting Line.This isn’t hopium, it’s structure.
Using my custom 4 EMA setup, you can see how ETH spent weeks coiling around the thickest dark purple line which I treat as the macro floor. ETH dropped below it briefly, retested it, and now we’re reclaiming that level again.
Whenever these EMAs start to compress and flatten, we usually get sideways chop, pressure build, breakout.
Zoom out and you’ll notice:
• We’re not extended.
• We’re not overbought.
• We’re not in price discovery.
We’re just getting back to the floor after compression.
If this is the top, it’s doing a great job pretending it’s still early.

Broadcom Ltd Quote | Chart & Forecast SummaryKey Indicators On Trade Set Up In General
1. Push Set Up
2. Range Set Up
3. Break & Retest Set Up
Notes On Session
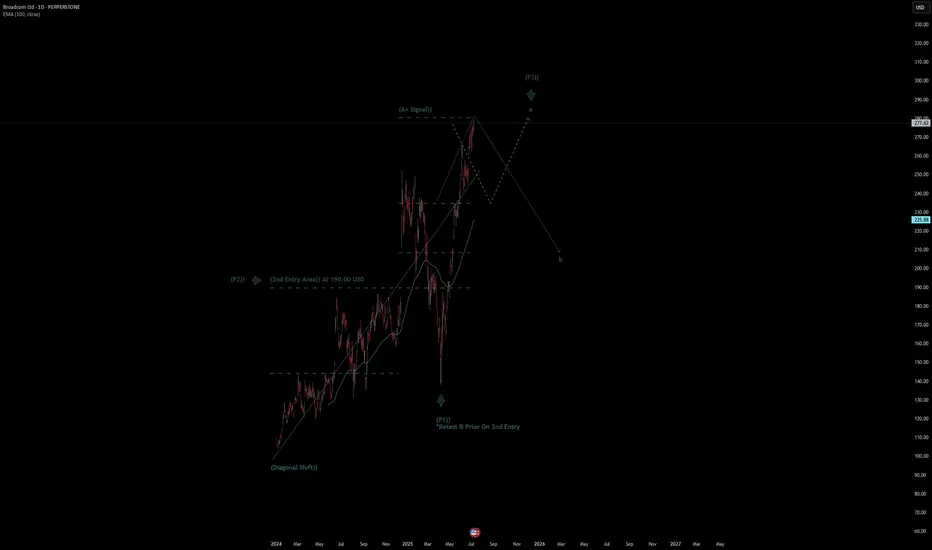
# Broadcom Ltd Quote
- Double Formation
* (Diagonal Shift)) At 95.00 USD | Completed Survey
* (A+ SIgnal)) - *Swing High(Developing) | Subdivision 1
- Triple Formation
* (P1)) / (P2)) & (P3)) | Subdivision 2
* (TP1) = a / Long Consecutive Range
* (TP2) = b / Short Consecutive Pullback | Subdivision 3
* Daily Time Frame | Trend Settings Condition
- (Hypothesis On Entry Bias)) | Regular Settings
- Position On A 1.5RR
* Stop Loss At 242.00 USD
* Entry At 277.00 USD
* Take Profit At 330.00 USD
* (Uptrend Argument)) & No Pattern Confirmation
- Continuation Pattern | Not Valid
- Reversal Pattern | Not Valid
* Ongoing Entry & (Neutral Area))
Active Sessions On Relevant Range & Elemented Probabilities;
European-Session(Upwards) - East Coast-Session(Downwards) - Asian-Session(Ranging)
Conclusion | Trade Plan Execution & Risk Management On Demand;
Overall Consensus | Buy
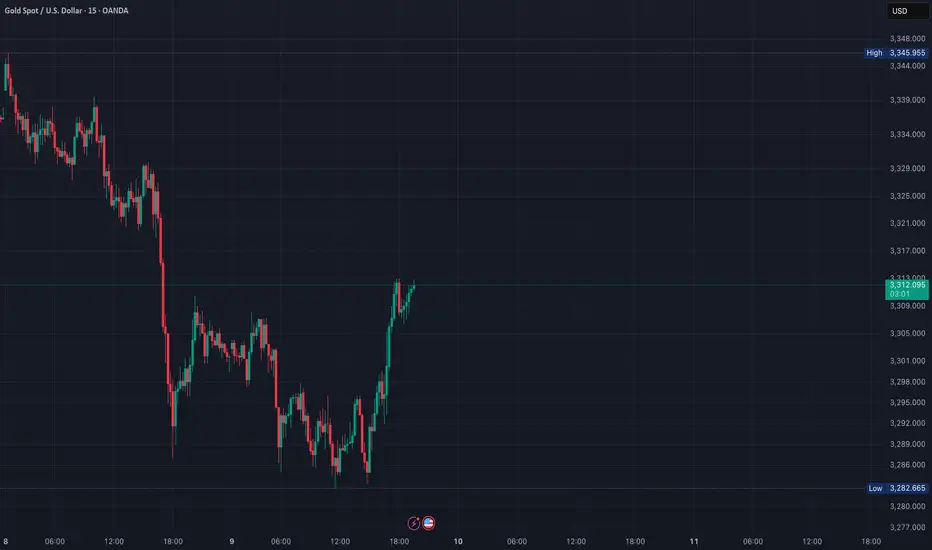
XAUUSD – Watching the 3318 Resistance for Potential Reversal
Currently monitoring Gold (XAUUSD) after a short-term bullish push toward the 3318 resistance zone. This area is significant due to:
Confluence with the upper Bollinger Band
Previous horizontal resistance level
Loss of momentum shown on MACD and other lower timeframes (15m–1h)
Price action is slowing as we approach the overbought territory. If price fails to break above 3318 and prints a clear reversal candlestick (e.g., pin bar or bearish engulfing) on the 1H chart, I’ll be looking for a short setup.
Disclaimer:This analysis reflects my personal view and is shared for educational purposes only. It does not constitute financial advice or a recommendation to enter any trade. Always do your own research and manage your risk accordingly. ⚠️
Cable One | CABO | Long at $130.82Cable One NYSE:CABO is a leading broadband communications provider under the Sparklight brand, offering high-speed internet, cable TV, and phone services across 24 U.S. states.
Book Value: $315.50.
Positive:
Strong liquidity: Quick ratio 1.47 (above industry avg ~1.0).
Undervalued vs. industry (1.91x).
Large customer base: ~1.1M customers, 2.8M data subscribers.
Stable revenue: Broadband focus in non-metropolitan markets.
Insiders buying over $1 million in share recently while also being awarded options.
Recent change in leadership.
Negatives:
Medium-high bankruptcy risk: Altman Z-Score 1.36 (below industry ~2.5).
High leverage: D/E 1.78 (above industry ~1.0).
Weak earnings: Negative margins, declining profitability.
Suspended dividend.
Classify this one as a risky investment, but it is very undervalued at this price and the upcoming decline in interest rates may have a very positive effect on the company's stock (at least short-term: 5 million float, 19% short interest). Regardless, not one to put your life savings into. From a technical analysis perspective, I foresee a potential drop between $115 and $120 in the near-term and rise from there. It all depends on the upcoming earnings, so label this one a "gamble" with high bankruptcy risk.
Regardless of bottom predictions, NYSE:CABO is in a personal buy zone at $130.82 for a swing trade.
Targets into 2027:
$190.00 (+45.2%)
$250.00 (+91.1%)

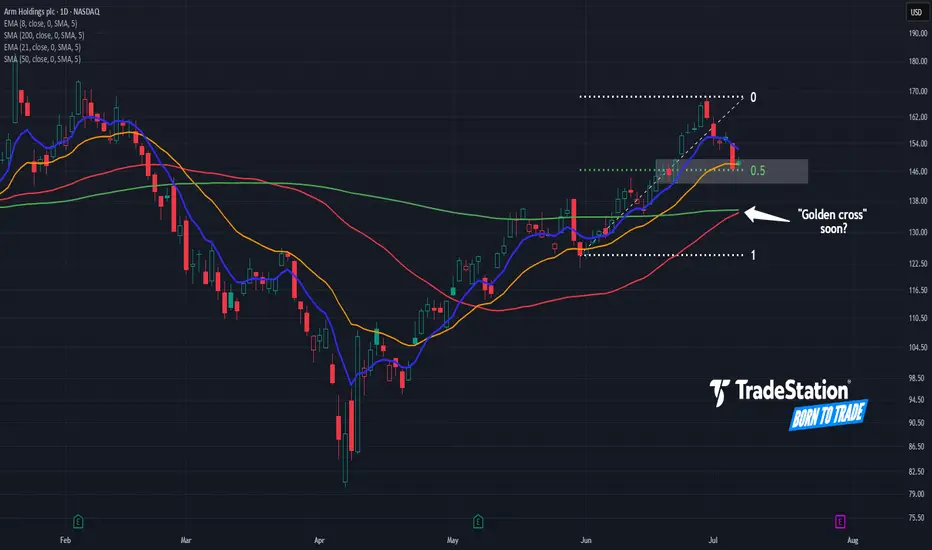
Arm Pulls BackArm Holdings rallied sharply last month, and now the AI chip stock has pulled back.
The first pattern on today’s chart is the advance from May 30 through June 30. ARM retraced half that move and is trying to bounce, which may confirm its upward direction.
Second, prices have retested their rising 21-day exponential moving average (EMA). The 8-day EMA is also above the 21-day EMA. Those signals may be consistent with short-term bullishness.
Third, the 50-day simple moving average (SMA) is nearing a potential “golden cross” above the 200-day SMA. That could reflect longer-term bullishness.
Finally, a four-session consolidation zone formed in late June between roughly $143 and $149. Will it now emerge as new support?
Check out TradingView's The Leap competition sponsored by TradeStation.
TradeStation has, for decades, advanced the trading industry, providing access to stocks, options and futures. If you're born to trade, we could be for you. See our Overview for more.
Past performance, whether actual or indicated by historical tests of strategies, is no guarantee of future performance or success. There is a possibility that you may sustain a loss equal to or greater than your entire investment regardless of which asset class you trade (equities, options or futures); therefore, you should not invest or risk money that you cannot afford to lose. Online trading is not suitable for all investors. View the document titled Characteristics and Risks of Standardized Options at www.TradeStation.com . Before trading any asset class, customers must read the relevant risk disclosure statements on www.TradeStation.com . System access and trade placement and execution may be delayed or fail due to market volatility and volume, quote delays, system and software errors, Internet traffic, outages and other factors.
Securities and futures trading is offered to self-directed customers by TradeStation Securities, Inc., a broker-dealer registered with the Securities and Exchange Commission and a futures commission merchant licensed with the Commodity Futures Trading Commission). TradeStation Securities is a member of the Financial Industry Regulatory Authority, the National Futures Association, and a number of exchanges.
TradeStation Securities, Inc. and TradeStation Technologies, Inc. are each wholly owned subsidiaries of TradeStation Group, Inc., both operating, and providing products and services, under the TradeStation brand and trademark. When applying for, or purchasing, accounts, subscriptions, products and services, it is important that you know which company you will be dealing with. Visit www.TradeStation.com for further important information explaining what this means.
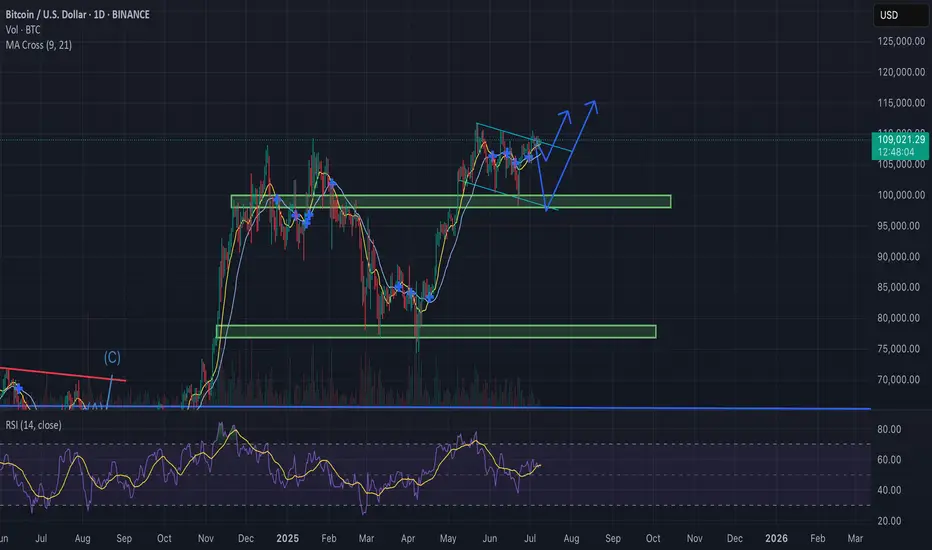
Bitcoin Update – Bullish Falling Wedge in Play?BTC/USD is currently trading near $108.8K, compressing within a falling wedge formation — historically a bullish continuation pattern, especially after a strong uptrend.
Why the Bias Remains Bullish:
Bullish MA Cross: Short-term MAs (9/21) are aligned for upside momentum.
Falling Wedge: Price compressing with lower highs and lows, coiling for a breakout.
RSI Strength: RSI (purple) remains elevated, supporting continued upside pressure.
Fundamental Catalysts:
Trump delays trade war announcements, reducing global uncertainty.
FOMC meeting in late July: Trump pushes for rate cuts, potentially bullish for risk assets like BTC.
If BTC breaks out above the wedge resistance with convincing volume:
Retest likely at ~$110K
Targets : $115K → $120K+
AAPL – Long Bias SetupWhy I’m Watching the Long Side:
✅ Clean Bounce from $190 Zone
That \$190–195 level has held multiple times since April. Last two dips got scooped with solid demand = solid base forming.
✅ Break of Recent Lower Highs
Stock finally pushed through prior resistance around $205–208. Structure shift. Possible start of a trend reversal.
✅ Buy Signal Triggered (Green "4")
Chart printed a buy signal near lows with follow-through = momentum may be shifting.
✅ Holding Above Short-Term Moving Level
Price is now holding above the short-term EMA (teal line), showing trend momentum flipping bullish.
✅ Vol Picking Up
Volume on the green days has increased, signaling interest from bigger players.
---
Trade Plan:
• Entry Zone: \$208–211
• TP1: $220 (near previous supply)
• TP2: $230 (gap fill zone)
• TP3: $250
• SL: Just below $204 = exit
---
⚠️ Caution:
Still under red resistance band ($220). Needs real strength to reclaim it.
Watch how price reacts there – could stall or squeeze.
📅 Next earnings 3 weeks out. Could build up into it.
---
💬 Setup looks constructive. Playing the reversal with tight risk. Not chasing, just reacting. Trade your plan.

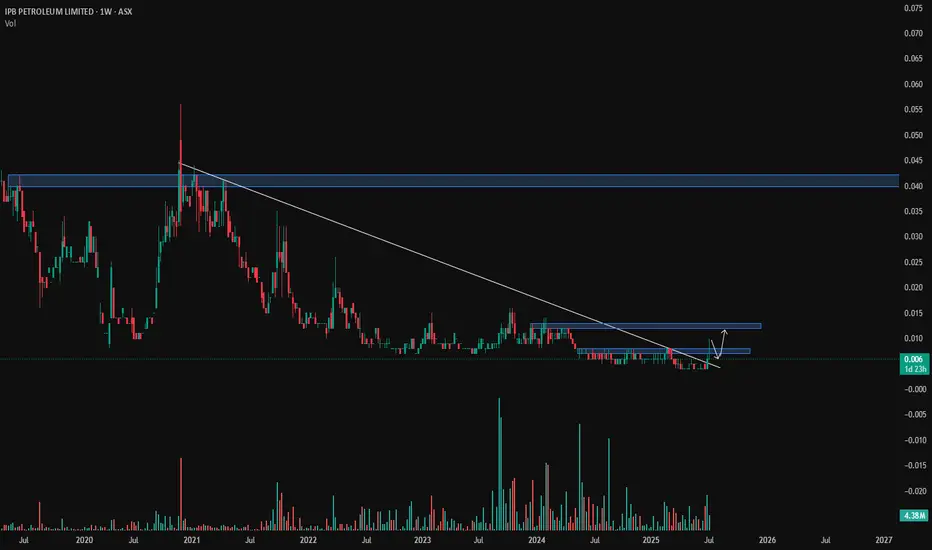
IPB - volume breakout LONGBroken out of 2 year trend on volume now looking to backtest area.
Awaiting news
Fartcoin to the moon again !!!!Fartcoin: Eyeing a Rebound to $1.20 USDT 🤑
🚀🚀🚀
Technical indicators suggest Fartcoin (FARTCOIN/USDT) could be poised for a significant price recovery, potentially reaching $1.20 USDT. After a period of consolidation between $0.95 and $1.05 USDT, signs of accumulation are emerging.
Key Technical Signals:
•RSI Reversal: The Relative Strength Index (RSI) is showing a bullish reversal, moving up from oversold conditions, indicating waning selling pressure.
•MACD Crossover: A potential bullish crossover on the MACD (Moving Average Convergence Divergence) suggests growing upward momentum.
•Volume Profile: Accumulation within the current range, with buying interest absorbing selling, points to a potential price floor.
•Fibonacci Target: The $1.20 USDT level aligns with a significant Fibonacci retracement point, making it a plausible target if upward momentum continues.A confirmed breakout from the current consolidation, supported by increased buying volume, would strengthen the case for a rally towards the $1.20 USDT mark !!!

SOLANA Loves THIS Pattern | BULLISHSolana usually increases alongside ETH. Possible because its a big competitor.
We can see SOL follows ETH very closely, with the exception of dipping earlier than ETH by a week:
In the 4h, we see a push to breakout above the neckline resistance:
In the daily timeframe, SOL is just about to break out above the moving averages - which would be the final confirmation of a bullish impulse to come:
Could this pattern be the confirmation of the start of another big pump for SOL?
_______________________
BINANCE:SOLUSDT

JD.cm | JD | Long at $33.16Like Amazon NASDAQ:AMZN and Alibaba NYSE:BABA , I suspect AI and robotics will enhance JD.com's NASDAQ:JD automation in warehousing, delivery, and retail. There is some risk here, like other Chinese stocks, that they could be delisted from the US market if trade/war tensions rise. But I just don't think that is likely (no matter the threats) due to the importance of worldwide trade and investment. I could be way wrong, though...
NASDAQ:JD has a current P/E of 8.1x and a forward P/E of 1.2x, which indicates strong earnings growth ahead. The company is healthy, with a debt-to-equity of 0.4x, Altmans Z Score of 2.6, and a Quick Ratio of .9 (could be better).
From a technical analysis perspective, the historical simple moving average (SMA) band is still in an overall downtrend but starting to level out (accumulation of share area). It is possible, however, that the price may drop into the $20s to close out the existing price gaps on the daily chart as tariff threats arise. But that area is another personal entry zone if fundamentals hold.
Thus, while it could be a bumpy ride and the risk is there for delisting, NASDAQ:JD is in a personal buy zone at $33.16 (with known risk of drop to the $20s in the near-term).
Targets into 2028:
$44.00 (+32.7%)
$52.00 (+56.8%)

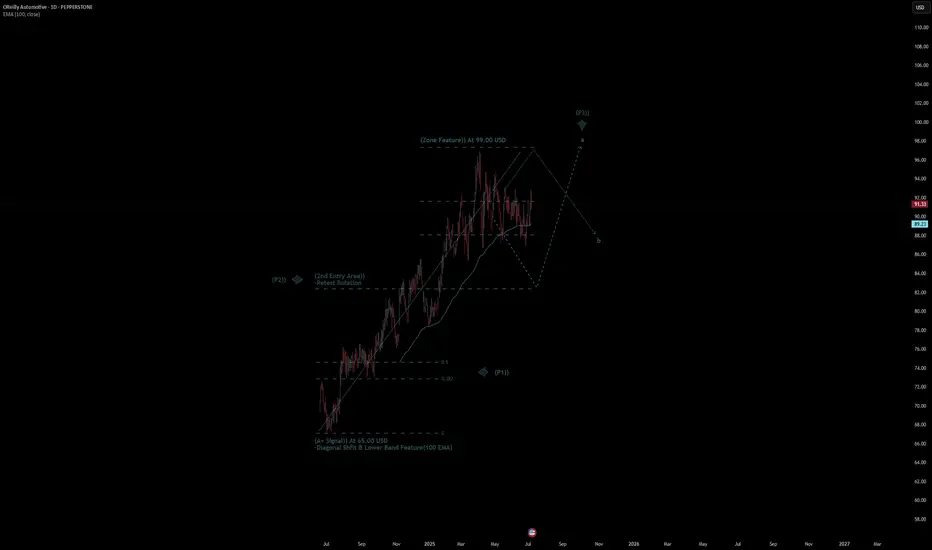
O'Reilly Automotive Quote | Chart & Forecast SummaryKey Indicators On Trade Set Up In General
1. Push Set Up
2. Range Set Up
3. Break & Retest Set Up
Notes On Session
# Oreilly Automotive Quote
- Double Formation
* (A+ SIgnal)) At 65.00 USD | Completed Survey
* (Zone Feature)) At 99.00 USD | Subdivision 1
- Triple Formation
* (P1)) / (P2)) & (P3)) | Subdivision 2
* (TP1) = a / Long Consecutive Range
* (TP2) = b / Short Consecutive Pullback | Subdivision 3
* Daily Time Frame | Trend Settings Condition
- (Hypothesis On Entry Bias)) | Regular Settings
- Position On A 1.5RR
* Stop Loss At 85.00 USD
* Entry At 91.00 USD
* Take Profit At 100.00 USD
* (Uptrend Argument)) & No Pattern Confirmation
- Continuation Pattern | Not Valid
- Reversal Pattern | Not Valid
* Ongoing Entry & (Neutral Area))
Active Sessions On Relevant Range & Elemented Probabilities;
European-Session(Upwards) - East Coast-Session(Downwards) - Asian-Session(Ranging)
Conclusion | Trade Plan Execution & Risk Management On Demand;
Overall Consensus | Buy
(Daytrading) APPL going upH1 chart is respecting the uptrend.
Price has retested the 50 SMA on the H1 timeframe.
Price also touched the Ichimoku Cloud on H1.
→ Based on the risk-to-reward ratio, I’m expecting a Call position.

(Daytring) APPL quickly trade1. Premarket created a support line
2. Sma 200,50 is here
3. Price goes up in the moring just pull back to retest.
=> entry. Take profit whenever i feel good

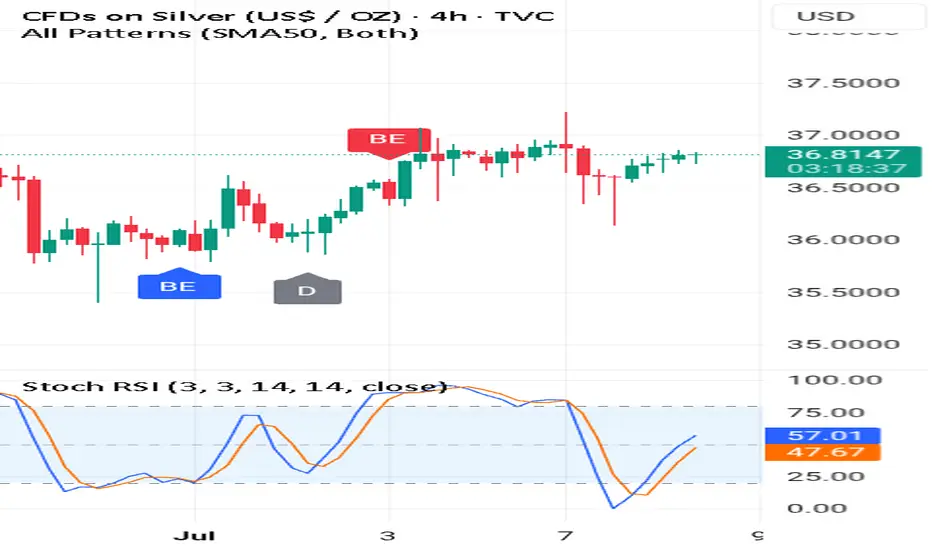
#1 Breaking News: Silver The Bullet Price Am listening to a podcast online this podcast mainly focusses on :
1-Gold
2-Silver
3-Mining Stocks
I always wondered what is it about these sectors that makes them "special"
Well I have recently mastered how to trade the double or triple tops.
And I can see why the experts in this commodity industry love double tops and triple tops.
Silver is hitting a top and has bounced from the neckline.
This is very important for you to understand.Also am using the 🚀 Rocket Booster strategy.
This strategy helps me pick the strength of the price trending.
It can also be used as a stop loss.This means you can use the moving averages for risk management.
Now I dont want you to worry too much about the technicals in this article but I just want us to have a conversation.
Sometimes technical analysis ca be boring but you will learn from conversations such as podcasts as well.
Rocket Boost This Content To Learn More.
Disclaimer ⚠️ Trading is risky please learn more about risk management and profit taking strategies and feel free to use a simulation trading account before you use real money.