ECOWLD - Heading towards 52 WEEK HIGH ?ECOWLD - CURRENT PRICE : RM2.00
ECOWLD broke out a 6 month down trendline on 01 JULY 2025 with high trading volume indicating strong bullish momentum. The stock is bullish as the price is above both 50 and 200 EMAs. Furthermore the share price is near 52 Week High. RSI is above 50 and below 70 indicating stock is bullish and not considered overbought yet. Nearest target will be RM2.16 (52 Week High resistance) and then if the trend resume, it may propel higher to hit next target at RM2.28. Support level is the low of 23 JUNE 2025 candle - RM1.77.
ENTRY PRICE : RM1.99 - RM2.02
TARGET : RM2.16 and RM2.28
SUPPORT : RM1.77
Notes : On 26 JUNE 2025 the company announced its increasing QUARTERLY EARNINGS. May visit company website or TheEdge for get more information.
Moving Averages

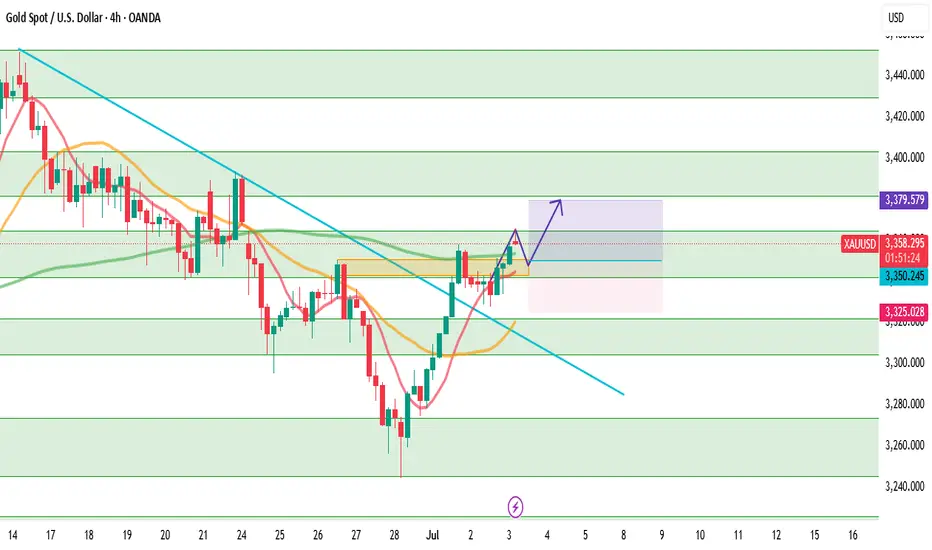
XAUUSD — July 3rd, 2025: Is the Downtrend Finally Over?Gold (XAUUSD) opened today with a bullish gap, and continued the momentum from Tuesday’s breakout above the major downtrendline that had capped the market for weeks. This technical breakout was long-awaited by many traders, and it's now leading us into a potential trend reversal phase — but not without resistance.
Price has now reached a critical resistance zone at 3366, which previously acted as a strong supply area during the last leg of the downtrend. If this level is broken decisively (ideally with a 4H candle close and follow-through), it may signal a clean shift toward a mid-term uptrend, with upside targets at 3379, 3403, and even 3430.
That said, rejection at 3366 has already triggered a minor pullback. We’re now watching the 3343–3351 zone as a potential support and an optimal buy entry area. If this zone holds, it could provide the fuel needed for bulls to continue their push.
🟢 Suggested Trade Plan
BUY LIMIT 3343–3351
Stop Loss 3325
Take Profit 1 3379
Take Profit 2 3403
Take Profit 3 3430
(Alternatively, consider a BUY STOP above 3370 in case of direct breakout)
📌 Market Structure
Resistance 3 3430
Resistance 2 3403
Resistance 1 3382
Pivot 3366
Support 1 3342
Support 2 3322
Support 3 3305
⚠️ Important Macro Alert
Today’s session is highly risky due to the early release of Non-Farm Payrolls (NFP) data, which is scheduled today instead of Friday because of the U.S. Independence Day (July 4) holiday tomorrow.
This brings a major volatility spike risk during the New York session. Manage your position size wisely, avoid emotional trades, and wait for solid confirmations.
Discipline beats prediction. Trade what you see — not what you feel.
Keep healthy so we can keep trading and we can keep on profiting.
$10 is looking realistic... if Mr. T doesn't mess it up lolWe have a lot of $10 call options on every expiration date for the next few months, meaning this move might take a while to play out. Unsure of exact date if its earnings call or news but $10 seems to be where the focus is.
If tariffs begin or effect Brazil negatively then this stock could plunge on low growth anticipation.
Watch very very closely on how price reacts to $9 IF we even go down there.

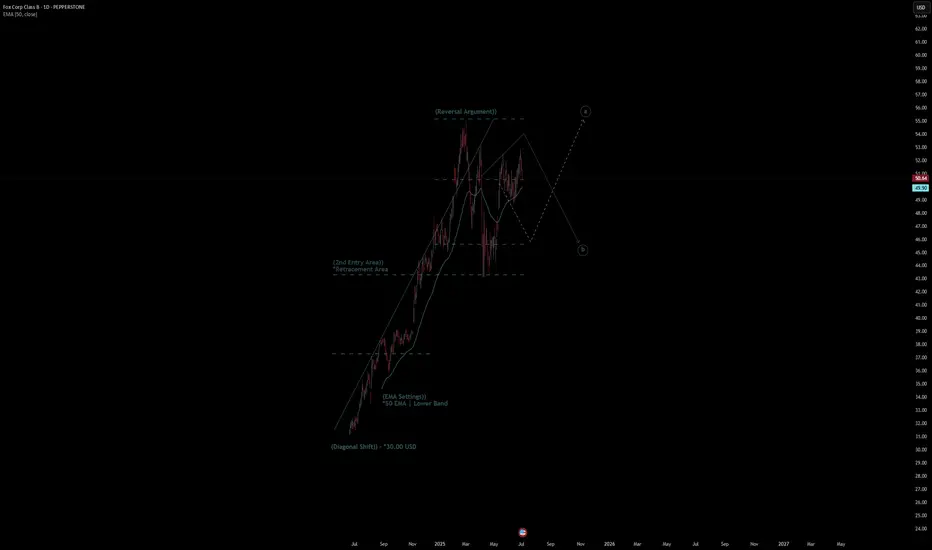
Fox Corp Class B Quote | Chart & Forecast SummaryKey Indicators On Trade Set Up In General
1. Push Set Up
2. Range Set Up
3. Break & Retest Set Up
Notes On Session
# Fox Corp Class B Quote
- Double Formation
* (Diagonal Shift)) - *30.00 USD | Completed Survey
* (2nd Entry Area)) | Subdivision 1
- Triple Formation
* (P1)) / (P2)) & (P3)) | Subdivision 2
* (TP1) = a / Long Consecutive Range
* (TP2) = b / Short Consecutive Pullback | Subdivision 3
* Daily Time Frame | Trend Settings Condition
- (Hypothesis On Entry Bias)) | Regular Settings
- Position On A 1.5RR
* Stop Loss At 45.00 USD
* Entry At 50.00 USD
* Take Profit At 58.00 USD
* (Uptrend Argument)) & No Pattern Confirmation
* Ongoing Entry & (Neutral Area))
Active Sessions On Relevant Range & Elemented Probabilities;
European-Session(Upwards) - East Coast-Session(Downwards) - Asian-Session(Ranging)
Conclusion | Trade Plan Execution & Risk Management On Demand;
Overall Consensus | Buy
Bullish confirmation today on both the daily and 4hrly.Bullish confirmation today on both the daily and 4hrly.
4hrly Chart:
Caught the dip?

Pi Cycle Top Risk (PCTR) at the mid-point for Bitcoin (BTC)The PCTR indicator is only just at the midpoint for BTC. We have a significant amount of time left in this bull market according to this indicator. There will be pullbacks, but the PTCR says we have room to continue to the upside in this cycle.

Estee Lauder | EL | Long at $67.33Reentering Estee Lauder at $67.33 due to the persistence of the Director, Paul Fribourg, buying around $33,000,000 worth of shares between $63-$66 (even after the earnings debacle). While the company had a horrendous outlook for FY2025, the bad news may be already priced in (i.e. cutting 7,000 jobs, weak sales, etc.). A "profit recovery and growth plan" is underway, so buckle up for the high risk of further declines in stock price in the near-term. Personally, a buy and hold at $67.33 with the primary thesis being global expansion (recovering Chinese market) or potential buyout into 2027.
Targets
$80.00
$86.00

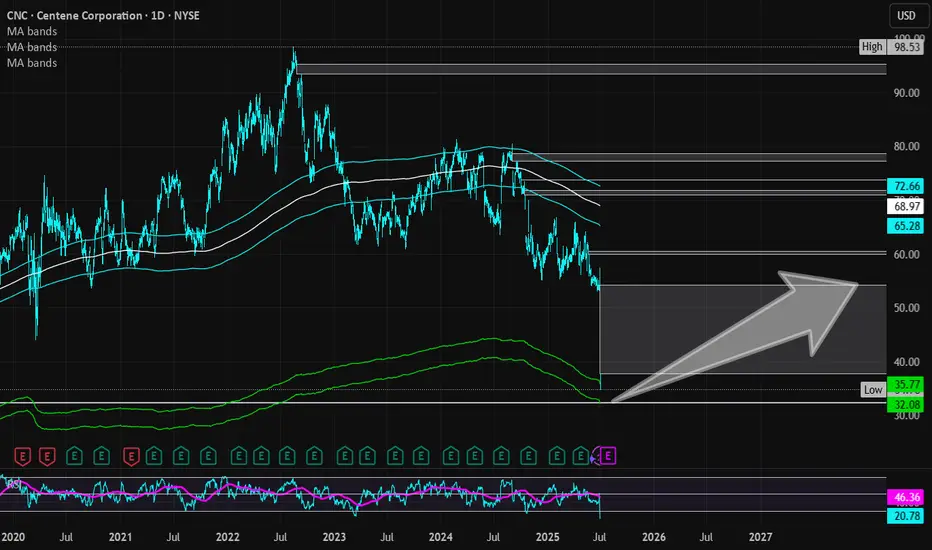
Centene Corp | CNC | Long at $35.00Centene Corp NYSE:CNC is a healthcare enterprise providing programs and services to under-insured and uninsured families, commercial organizations, and military families in the U.S. through Medicaid, Medicare, Commercial, and other segments. The stock dropped almost 40% this morning due to recent challenges, such as a $1.8B reduction in 2025 risk adjustment revenue and rising Medicaid costs (leading to withdrawal of 2025 earnings guidance). However, the company has a book value near $56, debt-to-equity of 0.7x (healthy), a current P/E of 5x, and a forward P/E of 9x.
It may be a few years before this stock recovers. But the price has entered my "crash" simple moving average area (currently between $32 and $36) and there is a price gap on the daily chart between $32 and $33 that will likely be closed before a move higher. Long-term, and potentially a new political administration, new life may enter this stock once again as the baby boom generation requires more healthcare services. But holding is not for the faint of heart...
Thus, at $35.00, NYSE:CNC is in a personal buy zone with a likely continued dip into the low $30s or high $20s before a slow move higher (where I will be accumulating more shares). Full disclosure: I am also a position holder in the $60s and cost averaging down.
Targets into 2028:
$45.00 (+28.6%)
$54.00 (+54.3%)
DXY Long-Term Technical Outlook: Channel Structure, Pullbacks & ## **DXY (Dollar Index) Technical Analysis – 2W Chart**
### **1. Uptrend Since 2008**
The Dollar Index (DXY) has been in a **long-term uptrend** since the 2008 bottom (around 70.70). The chart shows a clear pattern of **higher highs and higher lows**, establishing a bullish market structure over the past 15+ years.
---
### **2. Ascending Channel**
The price has been moving consistently within a well-defined **ascending channel**. Several reactions from the channel boundaries are visible:
- **Support (lower trendline):** 2008, 2011, 2018, 2021, 2024
- **Resistance (upper trendline):** 2009, 2017, 2022
This suggests that the market is respecting the technical boundaries of the channel remarkably well.
---
### **3. Historical Pullbacks Within the Channel (13.5% – 15%)**
The chart highlights major **pullbacks** from local tops, all falling within the **-12.6% to -16.9%** range, showing high consistency:
| Year | Drop | % Decline |
|-------------|----------|----------------|
| 2009 | -14.76 | -16.47% |
| 2010 | -14.97 | -16.90% |
| 2017 | -15.17 | -14.61% |
| 2020 | -13.65 | -13.25% |
| 2022 | -14.90 | -12.98% |
| 2024/2025 | -13.90 | -12.61% |
This implies that **a retracement of 13–15%** from a local high is a historically "normal" correction within the ongoing uptrend.
---
### **4. EMA Analysis – 24, 120, 240** (2Y,5Y,10Y)
The chart includes three Exponential Moving Averages (EMAs), reflecting short-, medium-, and long-term trends:
- **EMA 24 (white line):** Reacts to short-term price action. Price is currently breaking below it, suggesting weakness in short-term momentum.
- **EMA 120 (red line):** Reflects the mid-term trend. Price is **right at the edge**, often acting as a **support level** in bullish markets.
- **EMA 240 (blue line):** Represents the long-term outlook. **Price has never stayed below this level for long** over the past 15 years, making this EMA a **critical support** for the long-term trend.
---
### **Conclusion & Potential Scenarios**
📉 **Bearish Scenario:**
If DXY breaks below the **EMA 240** and the **lower channel boundary**, it could indicate a **reversal of the long-term uptrend**, which hasn’t happened since 2008.
📈 **Bullish Scenario:**
If DXY holds above the **EMA 120** or bounces from the **EMA 240** and the **channel support**, we could expect a rally toward the **Fibonacci levels** (0.5 at 102.04 or 0.382 at 105.04), or even a retest of the highs around **114.78**.


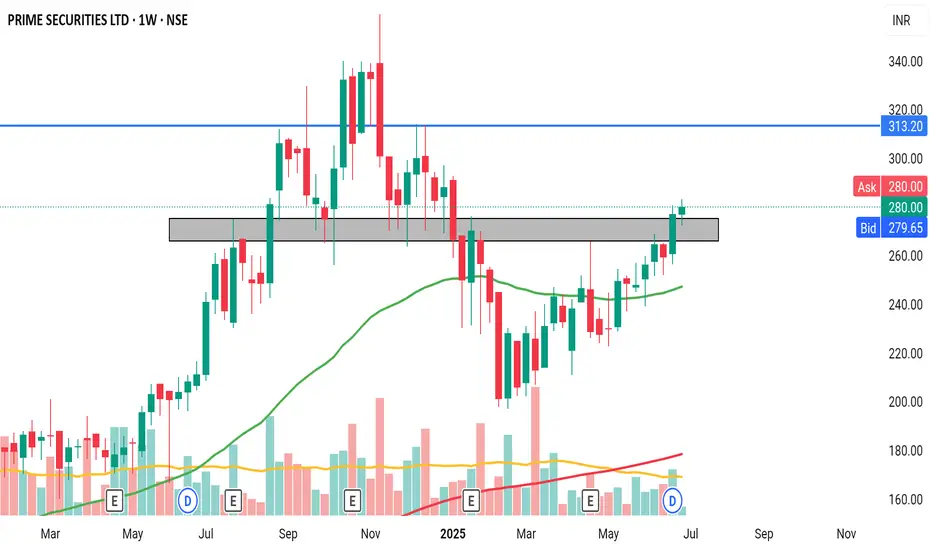
PRIME SECURITIES Crossed resistance with good volume in weekly timeframe. Price above 50 EMA indicates bullishness.
Trading The 3 Step Rocket Booster StrategyTrading within a certain time frame has shown me that its better to set a time stop limit.
This time stop limit tells you when to stop trading your entry.
-
Now does this work? am not sure but i will try anything
that will produce results.
-
Right now am focusing on short term trading strategies.The main aim is to enter on 4 hour time frames.
-
Am hoping that this will increase my trading skills.Either way my focuss is on learning how to trade better setups.
-
Key Point:Dont stop journal-ling your trades on trading-view community.
-
Now on this entry am looking at a rising volume from the bottom of the market.
-
Also we are looking at the rocket booster strategy:
-
It has the following steps:
-
-The price has to be above the 50 EMA
-The price has to be above the 200 EMA
-The price has to gap up.
-
This strategy has become so popular its shocking.Because when i began teaching...
-
it it was not as popular.
-
I call it the 3-Step Rocket Booster Strategy
If you want to learn more about how to find
stocks such as NYSE:KO
-
Rocket boost this content to learn more.
-
Disclaimer:Trading is risky please learn risk management and profit taking strategies.Also do not use margin trading.And use a simulation trading account before you trade with real money.

B&G Foods | BGS | Long at $4.45B&G Foods NYSE:BGS , owner of over 50 food brands including Green Giant, Ortega, Cream of Wheat, Mrs. Dash, and Crisco, has dropped nearly 92% in price since its high in 2021. Currently trading at $4.43 and with a book value of $6.43, NYSE:BGS may have some running room in the next 1-2 years for a forward P/E of 10x (currently negative, so there is anticipated growth, though small). This is another company that would greatly benefit from lowered interest rates due to its high debt-to-equity (4x).
So, while debt and consumer spending declines may pose a threat to NYSE:BGS , I believe it is currently undervalued. If the stock drops due to poor earnings (which could drop to under $2.00), I will be entering another position unless fundamental / outlook truly change.
Thus, at $4.45, NYSE:BGS is in a personal buy zone.
Targets into 2027:
$5.25
$6.25

EMA SystemThe system of Moving Averages I started out using is the 9-21-50 SMA. I would use the Fast EMA as a trailing stop loss and only trade long when it's above the 50 SMA. The 21 SMA is often a zone where price can bounce back.
12-21 EMA—EMA of EMA can work as well. So can 50-200 SMA or EMA of EMA for telling the larger trend if you want to enter an Option, then trading against it can be fatal.

#BCHBTC #1W (Binance) Big falling wedge breakoutCRYPTOCAP:BCH just regained 50MA weekly support in sats, performing better than CRYPTOCAP:BTC
Seems likely to continue bullish towards 200MA resistance, probably after a pull-back.
⚡️⚡️ #BCH/BTC ⚡️⚡️
Exchanges: Binance
Signal Type: Regular (Long)
Amount: 7.0%
Current Price:
0.004885
Entry Targets:
1) 0.004657
Take-Profit Targets:
1) 0.006329
Stop Targets:
1) 0.003987
Published By: @Zblaba
CRYPTOCAP:BCH BINANCE:BCHBTC #BitcoinCash #PoW bitcoincash.org
Risk/Reward= 1:2.5
Expected Profit= +35.9%
Possible Loss= -14.4%
Estimated Gaintime= 4-7 months

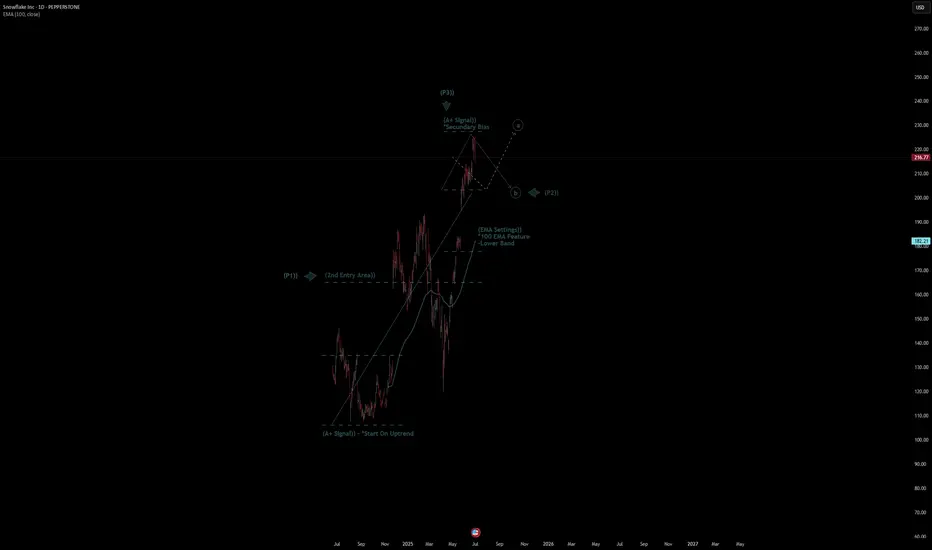
Snowflake Inc Stock Quote | Chart & Forecast SummaryKey Indicators On Trade Set Up In General
1. Push Set Up
2. Range Set Up
3. Break & Retest Set Up
Notes On Session
# Snowflake Inc Stock Quote
- Double Formation
* (A+ SIgnal)) - *Start On Uptrend | Completed Survey
* (2nd Entry Area)) | Subdivision 1
- Triple Formation
* (P1)) / (P2)) & (P3)) | Subdivision 2
* (TP1) = a / Long Consecutive Range
* (TP2) = b / Short Consecutive Pullback | Subdivision 3
* Daily Time Frame | Trend Settings Condition
- (Hypothesis On Entry Bias)) | Regular Settings
- Position On A 1.5RR
* Stop Loss At 201.00 USD
* Entry At 216.00 USD
* Take Profit At 240.00 USD
* (Uptrend Argument)) & No Pattern Confirmation
* Ongoing Entry & (Neutral Area))
Active Sessions On Relevant Range & Elemented Probabilities;
European-Session(Upwards) - East Coast-Session(Downwards) - Asian-Session(Ranging)
Conclusion | Trade Plan Execution & Risk Management On Demand;
Overall Consensus | Buy
Valero Breaks the DowntrendValero Energy spent more than a year in a downtrend, but some traders may think conditions have changed.
The first pattern on today’s chart is the series of lower highs between April 2024 and May 2025. VLO pushed above that falling trendline last month and has remained there since. That may suggest its longer-term direction is turning higher.
Second is the price area between roughly $132 and $136. The oil refiner peaked there in March, April and May. But it made a low in the same zone last week and this week. Is old resistance becoming new support?
Third, prices have remained above the rising 21-day exponential moving average. They’re also above the 200-day simple moving average. Those patterns may be consistent with emerging bullishness in the short and long terms.
Check out TradingView's The Leap competition sponsored by TradeStation.
TradeStation has, for decades, advanced the trading industry, providing access to stocks, options and futures. If you're born to trade, we could be for you. See our Overview for more.
Past performance, whether actual or indicated by historical tests of strategies, is no guarantee of future performance or success. There is a possibility that you may sustain a loss equal to or greater than your entire investment regardless of which asset class you trade (equities, options or futures); therefore, you should not invest or risk money that you cannot afford to lose. Online trading is not suitable for all investors. View the document titled Characteristics and Risks of Standardized Options at www.TradeStation.com . Before trading any asset class, customers must read the relevant risk disclosure statements on www.TradeStation.com . System access and trade placement and execution may be delayed or fail due to market volatility and volume, quote delays, system and software errors, Internet traffic, outages and other factors.
Securities and futures trading is offered to self-directed customers by TradeStation Securities, Inc., a broker-dealer registered with the Securities and Exchange Commission and a futures commission merchant licensed with the Commodity Futures Trading Commission). TradeStation Securities is a member of the Financial Industry Regulatory Authority, the National Futures Association, and a number of exchanges.
TradeStation Securities, Inc. and TradeStation Technologies, Inc. are each wholly owned subsidiaries of TradeStation Group, Inc., both operating, and providing products and services, under the TradeStation brand and trademark. When applying for, or purchasing, accounts, subscriptions, products and services, it is important that you know which company you will be dealing with. Visit www.TradeStation.com for further important information explaining what this means.

Paramount Global | PARA | Long at $11.00 (Jan '26 Call Options)Paramount Global NASDAQ:PARA may be gearing up for a price move to reach my historical simple moving average (white and green lines). It appears to be consolidating in the $9-$11 range, but the company is on shaky grounds. Currently, their debt is not well covered by operating cash flow, the dividend of 1.82% is not well covered by earnings, and there has been some insider selling lately. But earnings and cashflow are expected to grow in the future. So, it's a tossup in terms of fundamentals if the future actually plays out. Thus, while I have no desire to hold shares given the risks, the chart is enticing. January 2026 call options (strike of $12.50) are $0.90 each and that may be enough time for this to either move up or implode. The personal risk is small, but the reward could be generous.
Target #1 - $12.50 (January 16, 2026 call options, priced at $0.90 each)

BCH | Long-Term Bullish StructureBitcoin Cash presents an attractive long-term bullish structure with multiple technical confluences suggesting higher prices ahead. The patient approach of waiting for the VWAP retest provides optimal entry conditions for this long-term bullish thesis, rather than chasing current elevated prices.
Technical Analysis:
Strong support zone holding at $303.62 with multiple successful tests
365-day VWAP trending upward around $400-420, acting as dynamic support
Descending resistance from previous highs being challenged
Entry Strategy:
Traders should wait for a pullback to the 365-day VWAP ($400-420 zone) before entering long
positions.
This approach offers:
Better risk/reward ratio
Clear stop placement below major support at $300
Entry at a proven dynamic support level
Key Levels:
Entry: $400-420 (VWAP pullback)
Stop: Below $300 support
Target: Above descending trendline toward $600+

Monster Beverage: Breakout and PullbackMonster Beverage broke out to a new all-time high in May, and now it’s pulled back.
The first pattern on today’s chart is the March 2024 high of $61.23. The maker of energy drinks hesitated at that level in early May but pulled back to hold it last week. Has old resistance become new support?
Second, MNST is trying to stabilize at its rising 50-day simple moving average. That may reflect a bullish intermediate-term trend.
Third, the most recent dip pulled stochastics into oversold territory.
Finally, bullish price action after the last two earnings reports may reflect positive sentiment.
Check out TradingView's The Leap competition sponsored by TradeStation.
TradeStation has, for decades, advanced the trading industry, providing access to stocks, options and futures. If you're born to trade, we could be for you. See our Overview for more.
Past performance, whether actual or indicated by historical tests of strategies, is no guarantee of future performance or success. There is a possibility that you may sustain a loss equal to or greater than your entire investment regardless of which asset class you trade (equities, options or futures); therefore, you should not invest or risk money that you cannot afford to lose. Online trading is not suitable for all investors. View the document titled Characteristics and Risks of Standardized Options at www.TradeStation.com . Before trading any asset class, customers must read the relevant risk disclosure statements on www.TradeStation.com . System access and trade placement and execution may be delayed or fail due to market volatility and volume, quote delays, system and software errors, Internet traffic, outages and other factors.
Securities and futures trading is offered to self-directed customers by TradeStation Securities, Inc., a broker-dealer registered with the Securities and Exchange Commission and a futures commission merchant licensed with the Commodity Futures Trading Commission). TradeStation Securities is a member of the Financial Industry Regulatory Authority, the National Futures Association, and a number of exchanges.
TradeStation Securities, Inc. and TradeStation Technologies, Inc. are each wholly owned subsidiaries of TradeStation Group, Inc., both operating, and providing products and services, under the TradeStation brand and trademark. When applying for, or purchasing, accounts, subscriptions, products and services, it is important that you know which company you will be dealing with. Visit www.TradeStation.com for further important information explaining what this means.

Gold (XAUUSD) – FRL Classic Double Bottom After CorrectionGold forms a clean double bottom after a correction within an upward channel.
The neckline aligns precisely with the 100 MA – a classic Fractal Reversal Law (FRL) setup, indicating a phase shift back into the bullish structure.
Why This Setup:
✅ Trend Structure:
Gold remains inside its upward channel, respecting each phase with corrective trends that end with clear reversal patterns.
✅ FRL Double Bottom:
• The corrective downtrend completes with a double bottom.
• The neckline is strictly horizontal, matching the start of the last impulse (FRL principle).
• Alignment with the 100 MA confirms the phase and scale.
✅ Confirmation:
We wait for a full H4 candle close above the neckline for entry confirmation.
Trade Plan:
📈 Entry:
After H4 confirmation above the neckline or on a retest of the neckline.
🎯 Targets:
Take Profits are aligned with the key levels from the chart:
• TP1: First resistance in the mid-channel zone.
• TP2: Next resistance level within the channel.
• TP3: Upper channel boundary.
🛑 Stop Loss:
Placed just below the smaller low of the double bottom, maintaining a clean and logical risk structure.
FRL Key Notes:
Every correction is also a trend that ends with a reversal pattern.
The neckline = the beginning of the last impulse, always horizontal.
The 100 MA is used to align the timeframe with the market phase.

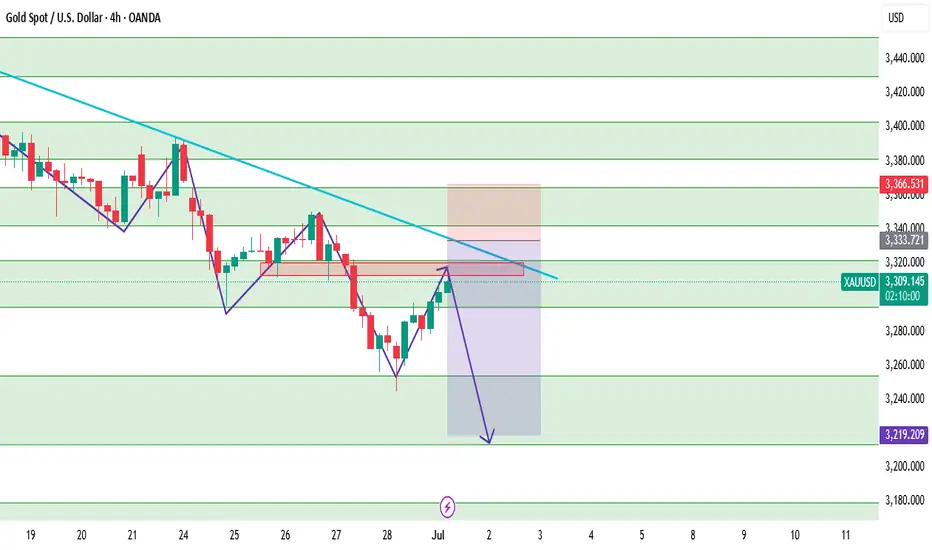
XAUUSD – Technical Outlook 4HXAUUSD is currently undergoing a corrective move after last week's bearish continuation. Price is now testing the minor resistance zone of 3295–3322, and could potentially extend the correction to test the descending trendline near 3333–3342.
The overall market structure remains bearish, with lower highs and lower lows clearly intact. Price has yet to break above the dynamic resistance trendline or the key swing high at 3366 — making any bullish move at this stage corrective, not a reversal.
Unless we see a strong bullish break and close above 3366, we expect sellers to return once price reaches the trendline or supply area around 3333–3342.
📌 Trade Plan (Sell on Pullback)
Sell Limit: 3333–3342
SL: 3368
TP1: 3296
TP2: 3255
TP3: 3220
📊 Key Levels:
R2: 3342
R1: 3322
Pivot: 3295
S1: 3254
S2: 3214
S3: 3180
Summary: Wait for bearish confirmation at the supply zone before entering. Bias remains bearish until proven otherwise by a structural break above 3366. Use smaller lot size or scale in slowly if price approaches the sell zone with weak bullish momentum.
I'm betting on the rise of the S\&P 500, therefore I'm betting oWe broke through the local level and are confidently moving toward the all-time high.
We are also above all moving averages, which gives us additional confidence in our trade.
