The Trendline Price is consolidating around the 200EMA, and right on a trendline, if price breaks below the trendline possible price target is 9.58, and 9.58 would be the bulls last stand against the bears. Please be careful and watch out for fakeouts.
Moving Averages

Freenet AG Stock Quote | Chart & Forecast SummaryKey Indicators On Trade Set Up In General
1. Push Set Up
2. Range Set Up
3. Break & Retest Set Up
Notes On Session
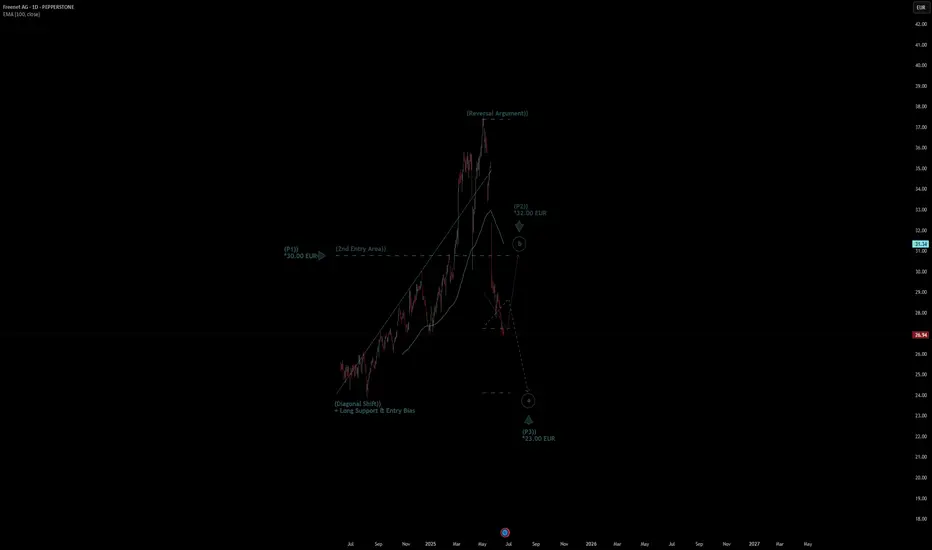
# Freenet AG Stock Quote
- Double Formation
* (Diagonal Shift) + Long Support & Entry Bias | Completed Survey
* (2nd Entry Area)) At 30.00 EUR | Subdivision 1
- Triple Formation
* (P1)) / (P2)) & (P3)) | Subdivision 2
* (TP1) = a / Long Consecutive Range
* (TP2) = b / Short Consecutive Pullback | Subdivision 3
* Daily Time Frame | Trend Settings Condition
- (Hypothesis On Entry Bias)) | Regular Settings
- Position On A 1.5RR
* Stop Loss At 28.00 EUR
* Entry At 27.00 EUR
* Take Profit At 25.00 EUR
* (Downtrend Argument)) & No Pattern Confirmation
* Ongoing Entry & (Neutral Area))
Active Sessions On Relevant Range & Elemented Probabilities;
European-Session(Upwards) - East Coast-Session(Downwards) - Asian-Session(Ranging)
Conclusion | Trade Plan Execution & Risk Management On Demand;
Overall Consensus | Sell
INDU - Long trade - Stop loss hunted by smart playerINDUS Motors stoploss hunted by some very very smart player yesterday :)
Brought down to 1685 level and then brought it up to just over its Fib 0.786 level.
It is taking support from its SMA20 level and a golden cross is about to happen next month.
This is the best time to hold onto it (my personal opinion, not a buy / sell call).
It requires patience though. This stock is not for impatient. As per my last analysis of INDU, its targets are minimum 3200 to 3500 (May go further upwards).
Moreover, it is a very good dividend stock. Ideal for long term investment.
Liquidity sweep can also be observed in last two days ;)

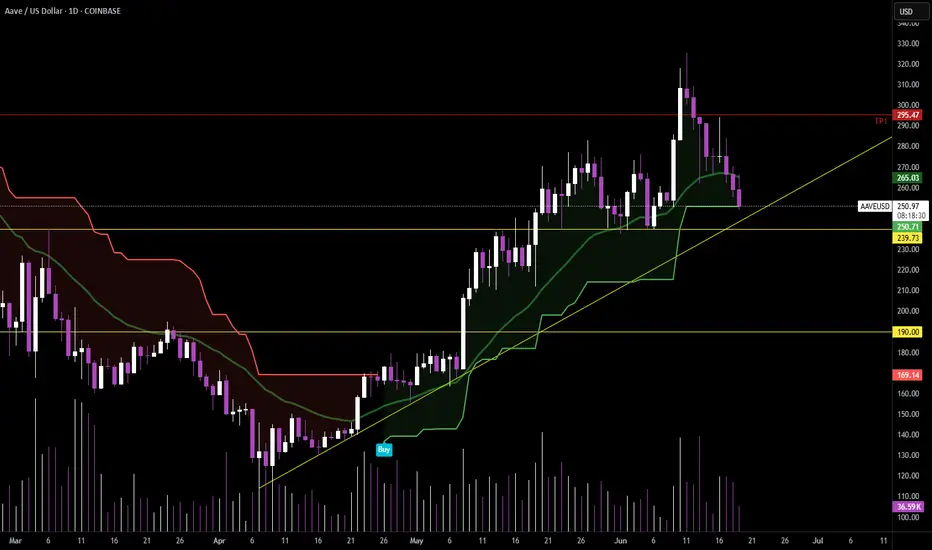
Scaling back into $AAVE – 3x Leverage Setup📍Entry zone: $250 → $240 (scaled)
📍Support confluence:
• Daily Supertrend touch
• Rising trendline support
• Major horizontal level near $240
🛑 Stop Loss:
• 5% price move (→ $232.75 avg) = 15% capital loss at 3x
• Or Daily Supertrend flip (closes in ~9 hours)
🎯 TP1: $295 (trim 33%)
🎯 TP2: $372 (full exit)
⚖️ R/R Ratio: 8.29
• ✅ Reward: +124%
• ❌ Risk: -15%
Just booked +133% on the last one. Back in—structure’s still bullish until it’s not.
WEAT on the move?Wheat futures (ZW) have cleared a zone of resistance with a 4.6% one day move. As tracked by the WEAT ETF, current price seems to be heading for a retest of the 200 Daily SMA (currently at $4.90). The 200 Daily SMA has reversed previous attempts to break out in October 2024 and February 2025. Will third time be different?
Note that this ETF reached a high over $12 in 2022 when the Russian/Ukrainian war started.

WEAT making move?Wheat futures (ZW) have cleared a zone of resistance with a 4.6% one day move. As tracked by the WEAT ETF, current price seems to be heading for a retest of the 200 Daily SMA (currently at $4.90). The 200 Daily SMA has reversed previous attempts to break out in October 2024 and February 2025. Will third time be different?
Note that this ETF reached a high over $12 in 2022 when the Russian/Ukrainian war started.

Gold — Awaiting Clarity at the Neckline (FRL Setup)“Trading is capital management under uncertainty. The red horizontal zone is the zone of uncertainty. Neckline levels are rubicons — thresholds where the market becomes clear to us. Don’t fear uncertainty. Learn to wait for the moment when everything becomes clear.”
Right now, gold is forming an upward trend. But as we know, every trend consists of impulses and corrections — and each of those is a trend of its own.
According to Fractal Reversal Law (FRL):
• Every structure ends with a reversal pattern.
• A neckline is always strictly horizontal and defined by the last impulse’s top.
• The MA100 tells us the scale we’re working with — helping us select the right timeframe to confirm.
🔍 In this setup:
• A potential reversal pattern is forming.
• The neckline coincides perfectly with the MA100 — a strong alignment of structure and scale.
• We also see early signs of MACD divergence, suggesting loss of bearish momentum.
Neckline levels: 3400 for a Double bottom and 3300 for a Double top.
✅ What to wait for:
• A full-bodied candle close above the neckline (not just a wick).
• This signals the end of correction and potential beginning of a new impulse.
🎯 Target:
• Measure the height from the neckline to the bottom of the correction.
• Project it upward from the neckline to estimate the first profit target.

#BSVUSDT #1D (ByBit) Falling wedge breakoutBitcoin Satoshi Vision is pulling back to 100EMA daily support where it seems likely to bounce and resume bullish, mid-term.
⚡️⚡️ #BSV/USDT ⚡️⚡️
Exchanges: ByBit USDT
Signal Type: Regular (Long)
Leverage: Isolated (2.0X)
Amount: 4.5%
Entry Targets:
1) 38.05
Take-Profit Targets:
1) 63.54
Stop Targets:
1) 29.54
Published By: @Zblaba
AMEX:BSV BYBIT:BSVUSDT.P #BitcoinSatoshiVision #PoW
Risk/Reward= 1:3.0
Expected Profit= +134.0%
Possible Loss= -44.7%
Estimated Gain-time= 2 months

Potential Long Setup for EthereumEther stabilized in a slightly positive trend after breaking the previous uptrend. Since mid-May, this flattish trend channel has continued, offering some trading opportunities within it.
When Ethereum approaches the lower line and the 50 EMA crosses above the 50 SMA, an ETHUSDT surge has followed each time since the channel formed. Traders could expect a similar move again. However, the key risk is potential negative pressure on stock markets due to geopolitical concerns and the correlation effect on the crypto market and a break of the channel.

Commerzbank Stock Quote | Chart & Forecast SummaryKey Indicators On Trade Set Up In General
1. Push Set Up
2. Range Set Up
3. Break & Retest Set Up
Notes On Session
# Commerzbank Stock Quote
- Double Formation
* (Diagonal Shift) + 100 EMA Feature | Completed Survey
* (2nd Entry Area)) At 20.00 EUR | Subdivision 1
- Triple Formation
* (P1)) / (P2)) & (P3)) | Subdivision 2
* (TP1) = a / Long Consecutive Range
* (TP2) = b / Short Consecutive Pullback | Subdivision 3
* Daily Time Frame | Trend Settings Condition
- (Hypothesis On Entry Bias)) | Regular Settings
- Position On A 1.5RR
* Stop Loss At 25.00 EUR
* Entry At 28.00 EUR
* Take Profit At 33.00 EUR
* (Uptrend Argument)) & No Pattern Confirmation
* Ongoing Entry & (Neutral Area))
Active Sessions On Relevant Range & Elemented Probabilities;
European-Session(Upwards) - East Coast-Session(Downwards) - Asian-Session(Ranging)
Conclusion | Trade Plan Execution & Risk Management On Demand;
Overall Consensus | Buy

6/19 Gold Analysis and Trading SignalsGood morning!
Yesterday, the Federal Reserve's interest rate decision aligned with market expectations, bringing no major surprises. The market had already priced in bearish sentiment in advance, which led gold to trade within the Bollinger Bands' upper, middle, and lower bounds, with all three bands trending sideways, indicating limited intraday volatility.
🔍 Technical Overview:
On the 30-minute chart, the Bollinger Bands began to tilt downward near the close, with price currently pressured by the middle band;
However, MACD structure suggests the middle band may be broken, with potential for price to challenge the upper band resistance near 3392–3400;
More importantly, on the 1D chart, the MACD is showing signs of a bearish crossover (death cross). If confirmed, it may break the bullish structure, weakening support from the weekly MA5;
If gold sustains below the weekly MA10 at 3317, it could open the door for a broader correction, with a drop toward 3200 becoming increasingly likely.
📊 Fundamental Factors:
Today’s U.S. market holiday means fewer economic data releases. As such, gold will likely be driven by technical structure and geopolitical headlines, especially those related to the Middle East. If no new developments emerge, selling on rallies remains the preferred strategy.
📌 Trading Plan (VIP-Focused):
✅ Sell Zone: 3392–3409
✅ Buy Zone: 3338–3321
✅ Scalp/Flexible Zones: 3387 / 3373 / 3364 / 3356 / 3345

28% Profits Possible for Small CapsIt appears that small caps (and major large-cap stocks) are at a crucial point currently. The price breaking out of the bump-and-run pattern to the upside, combined with a neutral Fear and Greed Index, suggests a potential continuation of the bull run. The target is approximately $2,750, regardless of interest rate decisions. News about war has not significantly impacted the market so far.

Visteon Corp Stock Quote | Chart & Forecast SummaryKey Indicators On Trade Set Up In General
1. Push Set Up
2. Range Set Up
3. Break & Retest Set Up
Notes On Session
# Visteon Corp Stock Quote
- Double Formation
* (Diagonal Shift) + 107.00 USD | Completed Survey
* (A+ SIgnal)) At 115.00 USD | Subdivision 1
- Triple Formation
* (P1)) / (P2)) & (P3)) | Subdivision 2
* (TP1) = a / Long Consecutive Range
* (TP2) = b / Short Consecutive Pullback | Subdivision 3
* Daily Time Frame | Trend Settings Condition
- (Hypothesis On Entry Bias)) | Regular Settings
- Position On A 1.5RR
* Stop Loss At 80.00 USD
* Entry At 90.00 USD
* Take Profit At 105.00 USD
* (Uptrend Argument)) & No Pattern Confirmation
* Ongoing Entry & (Neutral Area))
Active Sessions On Relevant Range & Elemented Probabilities;
European-Session(Upwards) - East Coast-Session(Downwards) - Asian-Session(Ranging)
Conclusion | Trade Plan Execution & Risk Management On Demand;
Overall Consensus | Buy

EURUSD LONGPrice swept below support around 1.1473, grabbing liquidity and quickly bouncing back — this is a classic Wyckoff spring setup.
📌 Key Levels
Entry: Around 1.1500
Stop Loss: Below 1.1424 (spring low)
Target 1: 1.1567 (range high)
Target 2: 1.1614 (measured move)
🔍 Why I like this setup:
Fake breakdown (spring) and quick recovery
Buyers showed up right after the sweep
Expecting price to return to the top of the range and possibly break higher . This a trade we hold
💡 A spring is where smart money steps in after trapping sellers — I'm following them.
“I always say that you could publish my rules in the newspaper and no one would follow them. The key is consistency and discipline.”

6/17 Gold Analysis and Trading SignalsGood morning!
Yesterday, gold opened with a gap-up and surged to around 3451, but failed to sustain above key resistance. After another failed attempt to break higher, prices gradually turned lower and finally broke below 3400, finding short-term support near 3382.
The primary driver of this decline was a waning of geopolitical risk sentiment, which had previously fueled the rally. Additionally, the market is now pricing in expectations that the Fed will keep rates unchanged, a factor that was likely preemptively reflected in price.
🔍 Fundamental Focus:
Today’s U.S. session will feature a key news release, which may prove decisive for gold’s next directional move. With yesterday’s advance pullback, market dynamics are likely to be more volatile today. We recommend caution, especially ahead of the announcement.
📉 Technical View:
Gold is currently in a post-decline consolidation phase.
The main resistance lies between 3430–3450, while 3415 on the 30-minute chart also presents a short-term cap.
For those entering long positions, target zones should remain conservative, ideally around 3412–3418, and then be adjusted depending on volume momentum and breakout structure.
📊 Weekly Structure Outlook:
The weekly chart shows that gold is at a key trend inflection point.
If no additional bullish catalysts emerge, the market is likely to develop into a bearish consolidation, with the next major downside target around 3200.
📌 Trading Plan (For VIP):
✅ Sell Zone: 3436–3466
✅ Buy Zone: 3347–3323
✅ Flexible Trade Zones: 3428 / 3415 / 3403 / 3392 / 3378 / 3362 / 3354

What on earth will happen to GOLD? why is it not up yet?XAUUSD
GOLD returns to the consolidation area of 3388-3403 after falling and landing at support 3366. The strength of the SELLER still looks quite strong considering that there has been no confirmation of buyer power at all such as Bullish Engulfing or other large bullish candles. GOLD will still fall again and has the potential to reach the support range of 3350 - 3366 as long as there is no penetration of resistance 3408
Congratulations on yesterday's profit. Today we will try to wait and see the movement of GOLD again before determining the entry.
R3 3500
R2 3427
R1 3408
PV 3379
S1 3366
S2 3350
S3 3286

Tron (TRX) Price Prediction: Nasdaq Deal Fuels Bullish ForecastThe $210 Million Nasdaq Rumor: Deconstructing the Hype for a Realistic Tron (TRX) Price Prediction
In the volatile theater of cryptocurrency, headlines can ignite market-moving frenzies, and few have been as potent as the recent whirlwind of news surrounding Tron (TRX). The prospect of a planned Nasdaq listing via a $210 million reverse merger, intertwined with the enigmatic presence of the Trump family, sent shockwaves through the community, promising a new era of mainstream legitimacy and sparking wildly bullish price predictions. However, as the dust settles, a clearer, more nuanced picture emerges—one that separates explosive rumors from the fundamental drivers that will truly dictate the future of Tron's price.
The core of the excitement stemmed from a strategic deal involving SRM Entertainment, a Nasdaq-listed company specializing in theme park merchandise. In a stunning pivot, SRM announced it would rebrand as Tron Inc., initiate a substantial TRX treasury funded by a $100 million private equity investment, and appoint Tron's founder, Justin Sun, as an adviser. This "reverse merger" was widely interpreted as a backdoor for the Tron blockchain to gain a coveted spot on a major U.S. stock exchange, a move that would grant it unprecedented access to traditional capital and validation. Adding a layer of political intrigue, the deal was facilitated by an investment bank where Eric Trump and Donald Trump Jr. serve on the advisory board.
This confluence of high finance, crypto ambition, and political association created a perfect storm for speculation. The stock price of SRM Entertainment skyrocketed over 500%, and the price of TRX saw a notable jump. However, the narrative quickly became more complex. Eric Trump clarified his position, denying any direct "public involvement" in the new company, despite expressing his admiration for Justin Sun and their established business connections.
While the deal with SRM Entertainment is very real, its direct implications for the TRX token are more complex than a simple "Nasdaq listing." The transaction is for the corporate entity, which will hold TRX in its treasury, not for the decentralized TRX asset itself to be traded on Nasdaq like a stock. This distinction is critical. The move provides Tron with a publicly-traded vehicle and significant capital, but the ultimate value of TRX still hinges on the utility and adoption of the Tron network itself. Therefore, a realistic price prediction must look beyond the initial hype and analyze the bedrock of Tron's fundamentals.
Deconstructing the Hype: The Nasdaq Deal and Trump Connection
The plan for SRM Entertainment, a Florida-based supplier of toys and souvenirs, to morph into Tron Inc. is a masterclass in financial engineering. Through a reverse merger, a private company (in spirit, Tron) can go public by merging with an existing publicly-traded company (SRM), bypassing the rigorous and lengthy process of a traditional Initial Public Offering (IPO).
The deal, valued at up to $210 million upon full exercise of warrants, involves SRM receiving a $100 million equity investment from a private investor to initiate a "TRX Treasury Strategy." This strategy mirrors the approach of companies like MicroStrategy with Bitcoin, where the public company's assets are heavily invested in a specific cryptocurrency, making its stock a proxy for that asset. With Justin Sun serving as an adviser, the new Tron Inc. plans to implement a TRX staking program and even a dividend policy for its shareholders, further intertwining its fate with the Tron ecosystem.
The involvement of the investment bank brokering the deal brought the Trump name into the headlines. Eric Trump and Donald Trump Jr.'s roles on the bank's advisory board led to speculation about their involvement in the new Tron Inc. However, Eric Trump later clarified his position, separating his personal and business relationships from a formal executive role in the public venture, though the connection undeniably added to the initial media frenzy.
Beyond the Rumors: Tron's True Fundamental Strengths
With the Nasdaq hype contextualized, the real question for investors is: what is the intrinsic value of the Tron network? The answer lies in its undeniable dominance in one of the most crucial sectors of the digital economy: stablecoins.
The Undisputed King of USDT
The Tron network has become the world's primary settlement layer for Tether (USDT), the largest stablecoin by market capitalization. The network hosts over $78 billion in USDT, a figure that has surpassed the amount on its main rival, Ethereum. This dominance is not accidental. Tron's architecture, which allows for high throughput and extremely low transaction fees, makes it the preferred network for USDT transfers, especially for retail users and in emerging markets.
During a single month in mid-2025, the Tron network processed over $694 billion in USDT transfers through nearly 90 million contract interactions. The vast majority of USDT holders on Tron are retail users with balances under $1,000, highlighting the network's deep penetration into everyday peer-to-peer and remittance use cases. This immense and consistent utility generates real, sustained demand for the network, forming the most solid pillar of its valuation.
A Growing DeFi and dApp Ecosystem
While stablecoins are its main draw, Tron's Decentralized Finance (DeFi) ecosystem is also substantial. The network holds a Total Value Locked (TVL) of over $8 billion, placing it among the top layer-1 blockchains. Platforms like the lending protocol JustLend and the decentralized exchange SunSwap are key contributors to this activity.
The network has processed over 10.5 billion transactions from more than 313 million user accounts, demonstrating a vibrant and active user base. Although a recent decline in TVL from its peak and slowing DEX volume has been observed, the sheer number of daily active users and transactions suggests a pivot towards non-DeFi dApps and peer-to-peer transfers, reinforcing its utility beyond pure financial speculation.
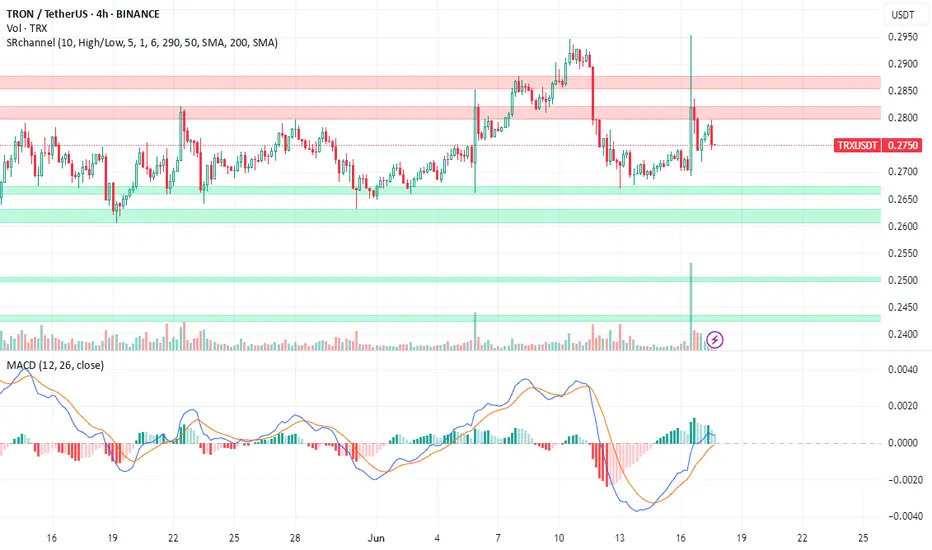
Tron (TRX) Price Prediction: Technical Analysis and Future Outlook
Given the strong fundamentals, particularly its role as the leading stablecoin platform, what can be expected from the TRX price?
Technical Indicators
As of mid-2025, TRX has shown resilience. Technical analysis reveals a generally neutral to bullish sentiment. The price has been consolidating in a horizontal channel, with key resistance and support levels being closely watched. Bullish signals, such as a "golden cross" and a bullish MACD crossover, suggest potential for upward momentum. A key indicator of its potential is its market-cap-to-TVL ratio, which, at 0.26, suggests the coin may be significantly undervalued compared to the value of the assets secured on its network.
Price Forecasts for 2025 and Beyond
Price forecasts for the end of 2025 vary but are generally optimistic, contingent on broader market conditions.
• Conservative Outlook: A conservative forecast places the potential price of TRX in a range between $0.18 and $0.35 for 2025. A move toward the upper end of this range would depend on a sustained crypto bull market and continued growth in Tron's user base.
• Bullish Scenario: An optimistic forecast suggests that if a full-blown "altseason" takes hold, TRX could surpass its previous highs and target levels between $0.45 and $0.70. Some long-term models even project a path toward $1.00 or higher by 2030, assuming Tron maintains its competitive edge and expands its use cases.
• Bearish Scenario: Risks remain. A regulatory crackdown on stablecoins, particularly Tether, could disproportionately impact Tron. Furthermore, a recent $2 billion drop in its DeFi TVL, despite user growth, suggests a potential weakness in its financial ecosystem that warrants monitoring. In a bearish turn, TRX could fall back to support levels around $0.21 or lower.
The "100x Gem" Fallacy
The headlines promoting Tron's Nasdaq deal were often accompanied by mentions of speculative new tokens like "BTC Bull Token," promising astronomical 100x returns. It is crucial for investors to recognize this as a common marketing tactic that leeches onto legitimate news to promote highly speculative and often worthless assets. The future success of Tron will not be found in chasing such gambles, but in the sustained growth of its core network. The real "alpha" is in understanding the fundamental utility that drives billions of dollars in transactions daily, not in lottery-ticket tokens.
Conclusion: A Bullish Continuation Built on Reality, Not Rumor
The story of Tron's Nasdaq listing is a potent reminder of the crypto market's susceptibility to hype. While the reverse merger with SRM Entertainment is a significant strategic maneuver that provides Justin Sun's ecosystem with a public-facing entity and a war chest, it is not the magic bullet that guarantees a higher TRX price.
The true bullish case for Tron is more mundane but far more powerful. It is the network's unparalleled dominance as the world's preferred highway for stablecoin transactions. This utility provides a constant, powerful demand for the network's resources. As long as Tron remains the fastest, cheapest, and most accessible platform for billions of dollars in daily USDT transfers, its intrinsic value will continue to grow.
The Nasdaq deal is a catalyst, but the engine is the ecosystem. Investors looking for a bullish continuation should focus on the steady hum of that engine—the growth in active wallets, transaction counts, and stablecoin volume—rather than the fleeting roar of market rumors. Based on these fundamentals, a steady, upward trajectory for TRX seems not only possible but probable, with the potential to retest and surpass previous highs as the digital asset market matures.
Wait for the NAS100 to break the parallel lines before shortingPEPPERSTONE:NAS100 - Need the price on the 1H TF to break down the parallel lines before taking any short position. After than we could see the index going to 21,450. But till then hold your shorts.

J.B. Hunt Transport Stock Quote | Chart & Forecast SummaryKey Indicators On Trade Set Up In General
1. Push Set Up
2. Range Set Up
3. Break & Retest Set Up
Notes On Session
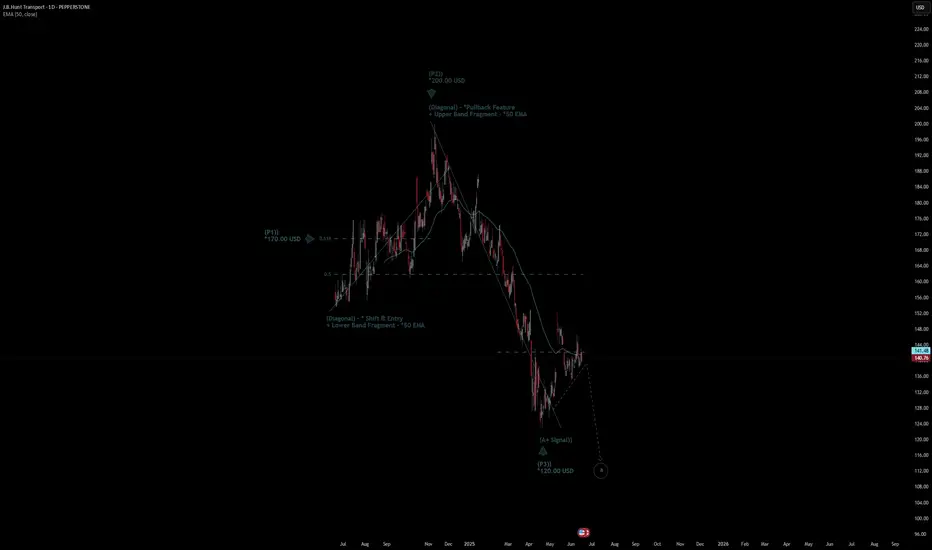
# J.B. Hunt Transport Stock Quote
- Double Formation
* (Diagonal) - *Shift & Entry | Completed Survey
* (Diagonal) - *Pullback Feature | Subdivision 1
- Triple Formation
* (P1)) / (P2)) & (P3)) | Subdivision 2
* (TP1) = a / Short Consecutive Range | Subdivision 3
* Daily Time Frame | Trend Settings Condition
- (Hypothesis On Entry Bias)) | Regular Settings
- Position On A 1.5RR
* Stop Loss At 155.00 USD
* Entry At 140.00 USD
* Take Profit At 117.00 USD
* (Downtrend Argument)) & No Pattern Confirmation
* Ongoing Entry & (Neutral Area))
Active Sessions On Relevant Range & Elemented Probabilities;
European-Session(Upwards) - East Coast-Session(Downwards) - Asian-Session(Ranging)
Conclusion | Trade Plan Execution & Risk Management On Demand;
Overall Consensus | Sell
Cisco Is Pushing a Generational HighCisco Systems has climbed as AI investment helps power growth, and some traders may think the move will continue.
The first pattern on today’s chart is the February 13 peak of $66.50. It was the highest level since September 2000, when the dotcom bubble was deflating. The networking giant come within $0.14 of that level on June 9 and remains in close proximity. Is a breakout coming?
(If CSCO were to clear this year’s peak, investors may next eye $82, its previous all-time high from March 2000.)
Next consider the May 15 closing price of $64.26 following strong quarterly results. The stock probed below the level last week and bounced. That may suggest old resistance has become new support.
Third, the 8-day exponential moving average (EMA) has stayed above the 21-day EMA. Such a sequence may reflect a short-term uptrend.
Finally, Bollinger Band Width has dropped as price moves narrow. Could that tightening price action open the door to price expansion?
Check out TradingView's The Leap competition sponsored by TradeStation.
TradeStation has, for decades, advanced the trading industry, providing access to stocks, options and futures. If you're born to trade, we could be for you. See our Overview for more.
Past performance, whether actual or indicated by historical tests of strategies, is no guarantee of future performance or success. There is a possibility that you may sustain a loss equal to or greater than your entire investment regardless of which asset class you trade (equities, options or futures); therefore, you should not invest or risk money that you cannot afford to lose. Online trading is not suitable for all investors. View the document titled Characteristics and Risks of Standardized Options at www.TradeStation.com . Before trading any asset class, customers must read the relevant risk disclosure statements on www.TradeStation.com . System access and trade placement and execution may be delayed or fail due to market volatility and volume, quote delays, system and software errors, Internet traffic, outages and other factors.
Securities and futures trading is offered to self-directed customers by TradeStation Securities, Inc., a broker-dealer registered with the Securities and Exchange Commission and a futures commission merchant licensed with the Commodity Futures Trading Commission). TradeStation Securities is a member of the Financial Industry Regulatory Authority, the National Futures Association, and a number of exchanges.
TradeStation Securities, Inc. and TradeStation Technologies, Inc. are each wholly owned subsidiaries of TradeStation Group, Inc., both operating, and providing products and services, under the TradeStation brand and trademark. When applying for, or purchasing, accounts, subscriptions, products and services, it is important that you know which company you will be dealing with. Visit www.TradeStation.com for further important information explaining what this means.

RGTI : First Long Position AreaNASDAQ listed Rigetti Computing Inc. stock is currently trading above the 50 and 200 period moving averages.
Once it gained momentum, it later lost it but its outlook is not weak at the moment.
Right now, if the Iran-Israel war uncertainty is overcome and if there is no bad news affecting the index, the gap may close.
Risk/Reward ratio of 3.00 is a very valuable ratio to try with small position amounts.
Risk/Reward Ratio : 3.00
Stop-Loss : 9.91
Take-Profit : 18.2
Regards.

Eurofins Scientific SE Stock Quote | Chart & Forecast SummaryKey Indicators On Trade Set Up In General
1. Push Set Up
2. Range Set Up
3. Break & Retest Set Up
Notes On Session
# Eurofins Scientific SE Stock Quote
- Double Formation
* (Diagonal) - *Shift & Entry | Completed Survey
* (2nd Entry Area)) + *Lower Band Feature | Subdivision 1
- Triple Formation
* (P1)) / (P2)) & (P3)) | Subdivision 2
* (TP1) = a / Long Consecutive Range
* (TP2) = b / Short Consecutive Pullback | Subdivision 3
* Daily Time Frame | Trend Settings Condition
- (Hypothesis On Entry Bias)) | Indexed To 100
- Position On A 1.5RR
* Stop Loss At 118.00 EUR
* Entry At 123.00 EUR
* Take Profit At 128.00 EUR
* (Uptrend Argument)) & No Pattern Confirmation
* Ongoing Entry & (Neutral Area))
Active Sessions On Relevant Range & Elemented Probabilities;
European-Session(Upwards) - East Coast-Session(Downwards) - Asian-Session(Ranging)
Conclusion | Trade Plan Execution & Risk Management On Demand;
Overall Consensus | Buy

