STILL SHORT Similar Bias, nothing has changed. Following previous setup with moves that continue to show my outlook.
Moving Averages
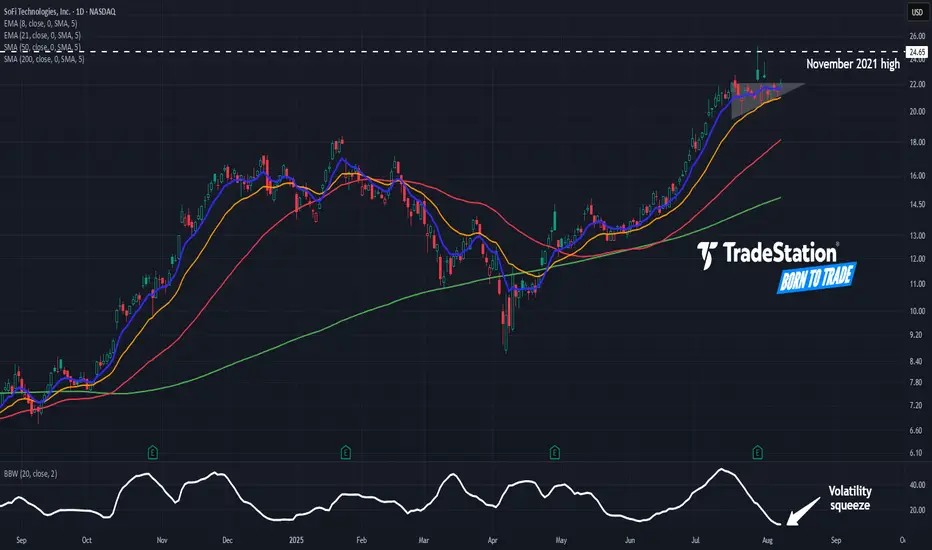
SoFi: Ascending TriangleSoFi Technologies rallied sharply in June and early July. Now, after a pause, some traders may see further upside.
The first item on today’s chart is the July 17 close of $22.09. The financial stock has remained mostly trapped below that level while making higher lows. The resulting ascending triangle is a potentially bullish continuation pattern.
Second, Bollinger Band Width has narrowed to its lowest reading since June 2024. Such tight consolidation may reflect a lack of selling pressure.
Third, the 8-day exponential moving average (EMA) has remained above the 21-day EMA. That may reflect bullishness in the short term.
Next, prices are consolidating below previous record highs from 2021. (The peaks then ranged from $24.65 to $28.26.) Could the stock challenge its old highs?
Finally, SOFI is an active underlier in the options market. Its average volume of 411,000 contracts would rank 11th in the S&P 500 (if it were a member), according to TradeStation data. That could help traders take positions with calls and puts.
TradeStation has, for decades, advanced the trading industry, providing access to stocks, options and futures. If you're born to trade, we could be for you. See our Overview for more.
Past performance, whether actual or indicated by historical tests of strategies, is no guarantee of future performance or success. There is a possibility that you may sustain a loss equal to or greater than your entire investment regardless of which asset class you trade (equities, options or futures); therefore, you should not invest or risk money that you cannot afford to lose. Online trading is not suitable for all investors. View the document titled Characteristics and Risks of Standardized Options at www.TradeStation.com . Before trading any asset class, customers must read the relevant risk disclosure statements on www.TradeStation.com . System access and trade placement and execution may be delayed or fail due to market volatility and volume, quote delays, system and software errors, Internet traffic, outages and other factors.
Securities and futures trading is offered to self-directed customers by TradeStation Securities, Inc., a broker-dealer registered with the Securities and Exchange Commission and a futures commission merchant licensed with the Commodity Futures Trading Commission). TradeStation Securities is a member of the Financial Industry Regulatory Authority, the National Futures Association, and a number of exchanges.
Options trading is not suitable for all investors. Your TradeStation Securities’ account application to trade options will be considered and approved or disapproved based on all relevant factors, including your trading experience. See www.TradeStation.com . Visit www.TradeStation.com for full details on the costs and fees associated with options.
Margin trading involves risks, and it is important that you fully understand those risks before trading on margin. The Margin Disclosure Statement outlines many of those risks, including that you can lose more funds than you deposit in your margin account; your brokerage firm can force the sale of securities in your account; your brokerage firm can sell your securities without contacting you; and you are not entitled to an extension of time on a margin call. Review the Margin Disclosure Statement at www.TradeStation.com .
TradeStation Securities, Inc. and TradeStation Technologies, Inc. are each wholly owned subsidiaries of TradeStation Group, Inc., both operating, and providing products and services, under the TradeStation brand and trademark. When applying for, or purchasing, accounts, subscriptions, products and services, it is important that you know which company you will be dealing with. Visit www.TradeStation.com for further important information explaining what this means.
GBPUSD: Enough? 1.3460 has the answer!We were anticipating a move above 1.3396 since last week, and now it finally happened. Now, our eyes are on our #1 key resistance in this area: 1.3460. A solid penetration of this level would signal more gains, and a continuation of the rising move from Aug 1st bottom.
On the other hand, failure to overcome this key level would signal a high probability that this whole move was corrective. In this case, a drop of 300-400 pips should be expected.
The 4H candle chart has generated signs of weakness ahead of 1.3460, which is encouraging for the bears, who may use this weakness to kickoff a drop that may be able to challenge, or dive below 1.3138, during the next 1-2 weeks.
A short at current prices* is a low-risk high-reward trade with a stop of about 60 pips, and a limit of 5X that number, since if we get to 1.3138 again, that is more than 300 pips in profit. Our analysis of the 4h chart shows that all the bears need to start digging is for 1.3460 to survive & show that it is a key resistance indeed.
Always remember, risk management is the #1 factor in your success or failure in trading, not analysis. Always risk very low percentages of your account on each trade. Only you can manage the risk in your account.
As always, Good Trading & Good Luck!
*We are trading around 1.3445 as this idea is being written.

EUR/USD at Major Resistance Confluence – Rejection Ahead?EUR/USD – Key Decision Zone
The price is testing a major confluence between horizontal resistance (1.16–1.20) and a long-term descending trendline. The weekly RSI shows overbought conditions, similar to 2017, 2018, and 2021 — all followed by corrections. Likely scenario: a possible false breakout above resistance followed by rejection and consolidation. Price action in this zone will be crucial.
Technical Analysis Process: EUR/USD (Weekly Chart)
1. Descending Red Line (Trendline)
This line represents a long-term dynamic resistance.
It has been respected multiple times in the past, which increases its relevance.
The current price action is approaching this trendline again, suggesting a potential bearish reaction from sellers.
2. Static Resistance Zone (Upper Brown Rectangle)
Ranges approximately between 1.16 – 1.20.
Historically acted as both support and resistance, marking it as a strong horizontal level of confluence.
Now overlaps with the descending trendline, increasing its technical significance.
3. Major Support Zone (Lower Brown Rectangle)
Located around 1.03 – 1.05.
This is the area from which the price previously launched a strong upward movement, potentially marking a cyclical bottom.
Projected Scenario (Yellow Arrow)
Indicates a possible false breakout above the resistance area and trendline.
Suggests a structure of consolidation or distribution, where price may spike above key resistance but quickly retreat.
This could lead to a retracement back toward lower support, or act as a base before a real breakout develops.
RSI Indicator (Relative Strength Index)
Weekly RSI is currently in the overbought zone, near the 70 level.
The vertical dotted orange line aligns with previous RSI peaks (2017, 2018, 2021), each followed by major tops and corrections.
This pattern suggests that the market could again experience a local top and a retracement after this overbought signal.
Overall Interpretation
EUR/USD is currently at a critical technical zone, where:
A long-term trendline and a horizontal resistance intersect.
RSI signals a potential reversal point.
The most probable outcome (as indicated by the yellow arrow):
A short-lived breakout above resistance, followed by a bearish rejection and consolidation.
Alternatively, price could consolidate here before attempting a stronger breakout.

"I remember this chart pattern in 2020.. Just before the big.."This one is going to be epic..this coming economic collapse is
going to make people rich and sadly the middle class poor
Believe it or not.I remember this chart pattern in 2020..
Just before the big market crash.
They say the poor can not get poorer
but its the middle class that gets poor
This means the average young people are
going to lose their jobs or decide to get a second job,
Capitalism is a factor of production
and having buying power
is the best feeling in the world
because i have been unemployed for a long time.
Capitalism is the only place i call home.
Even in the difficult times.
Capital markets have been my food and drink.
My hopes and dreams.
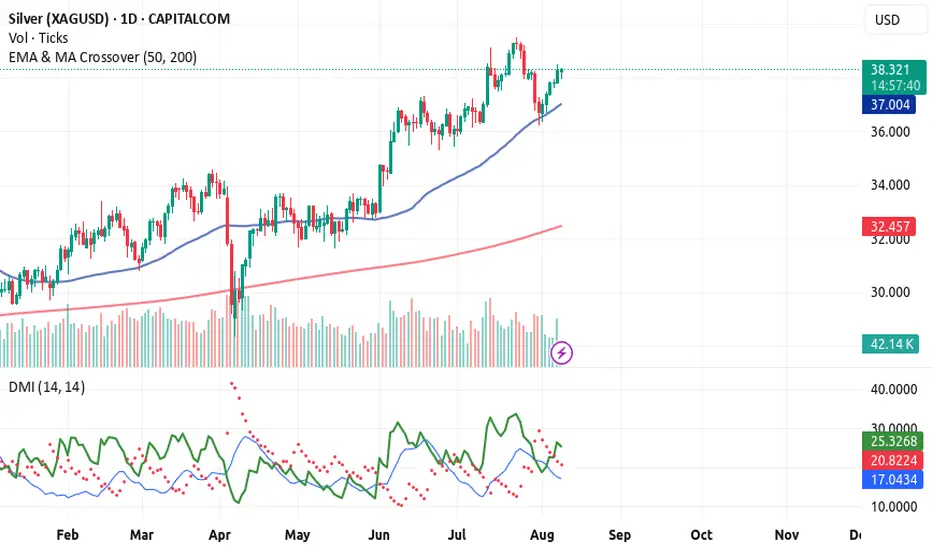
The silver TVC:SILVER price is going up because
it is following the rocket booster strategy
So what is the rocket booster strategy?
This strategy has 3 steps:
1-The price has to be above the 50 EMA
2-The price has to be above the 200 EMA
3-The price should gap up
That last step is very important
because you can see the gap from the
ADX indicator below
That trend line [ green line ]
shows that buyers are gaining strength
and running the market
But that line [ Blue line below the red line and green line]
also shows that a BIG move is coming
this big move is going to be Massive..
You will hear about it in the news by the time
it hits its peak this is going to be like 2020...
Just watch out anyway buy silver now.
Rocket boost this content to learn more.
Disclaimer:Trading is risky please
learn risk management and profit taking strategies.Feel free to use a simulation trading account before you trade with real money.
XLV SHORTMonthly chart - Head and shoulders pattern with a break below neckline and 200MA. Target for the pattern is around 118 looking to pick up long term shares there.

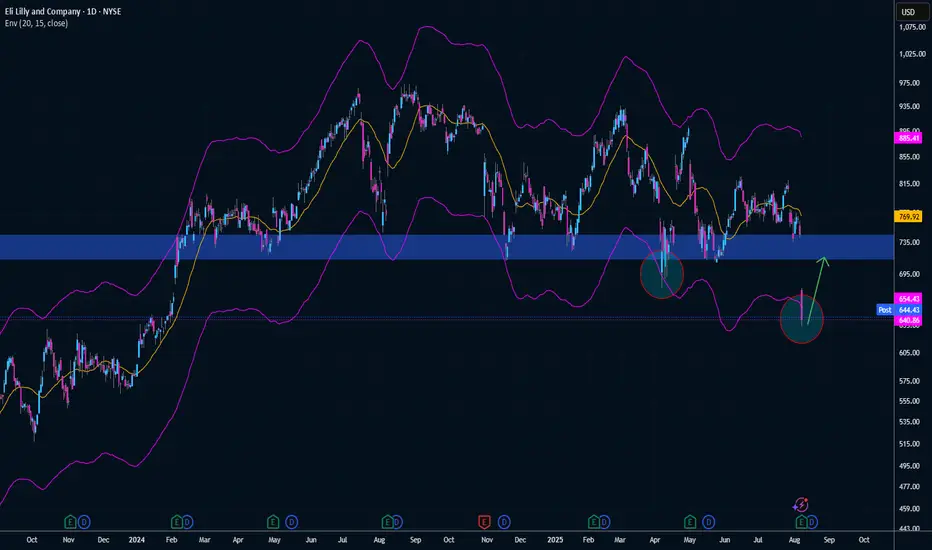
Rare Discount Below $700LLY’s sell-off today is driven by underwhelming data from its new oral GLP‑1 drug—but it came on the heels of an otherwise stellar earnings report and outlook upgrade. If you believe in Lilly’s leadership in obesity and diabetes treatments, its strong cash flows, and long-term drug development pipeline, this could be a compelling opportunity to buy at a discount.
Rare discount at 15% below the monthly average with a price last seen in Feb 2024. Buy the dip back to $700s.
Sabre Corporation (Revised) | SABR | Long at $1.76This is a revised analysis of Sabre Corp NASDAQ:SABR as seen here
-------
Full disclosure: I am still a holder of shares at $2.06 and newest entry at $1.76. My stop was triggered near $3.00 (original entry) a few days ago. If the price rises above $2.06, I plan to sell out of that entry a keep my lowest position moving forward.
This is a ***highly risky*** trade given the recent news around slower earnings growth and slump in travel demand in certain areas the company caters to. Do your own due diligence.
-------
NASDAQ:SABR stock took a major hit today after the company reported revenue growth below its projections in Q2 2025. Revenue was $687 million, down 1% year-on-year, missing the company's own guidance of "low single-digit" growth. They also significantly lowered full-year guidance for 2025, expecting Air Distribution Volumes to grow between 4-10% and full-year Adjusted EBITDA between $530-$570 million, down from previous projections. The company's higher exposure to corporate and government travel, including a decline in U.S. government and military travel, negatively impacted its performance.
From a technical analysis perspective, the price dropped today to an area 6 standard deviations away from the historical simple moving average zone (which rests now at $1.69 - blue line). While there may be a dead-cat bounce then further drop to near $1.00, the stock is behaving as expected given the bad news. However, a drop in interest rates will significantly benefit this company's debt burden. NASDAQ:SABR consistently ranks as one of the top players in the global travel technology landscape, so while I think the future is bright for the company given earnings projections (beyond 2025) and analyst estimates, 2025 will absolutely be a tough year.
So, at $1.76, I am buying the fear. Last entry near $1 if it gets there and the overall fundamentals do not change. Whatever my lowest entry is, I will be holding that and selling all previous entries near even to limit exposure.
Revised Targets into 2028:
$2.20 (+25.0%)
$2.90 (+64.8%)

GBPJPY - at ResistanceSterling Yen long term was consolidating since Aug 24.
Now the price reached the FR 127.2 and respected it as Resistance.
On Aug 1st the support at FR 100 was broken. Yet, price crossed down SMA200 (4H)
Now price is testing the SMA200 from below, which is aligned with FR 61.8 of the latest impulse down.
If the Resistance at 198 holds, price may commence a longer correction, potentially down to 194 or even to 190.
Just my humble opinion.

Ironwood Pharmaceuticals | IRWD | Long at $0.61Ironwood Pharma NASDAQ:IRWD stock dropped ~89% in the past year due to disappointing Phase 3 Apraglutide trial results, FDA requiring an additional trial, weak Q1 2025 earnings (-$0.14 EPS vs. -$0.04 expected), high debt ($599.48M), and analyst downgrades. So why would I be interested in swing trading this company? The chart. The price has entered my "crash" simple moving average zone, which often results in a reversal - even if temporary. Also, Linzess (GI drug) revenue is steady, and I thoroughly believe that alone pushes the fair value near $0.95, if not higher. Thus, at $0.61, NASDAQ:IRWD is in a personal buy zone with the potential for additional declines before future rise.
Target:
$0.95 (+55.7%)

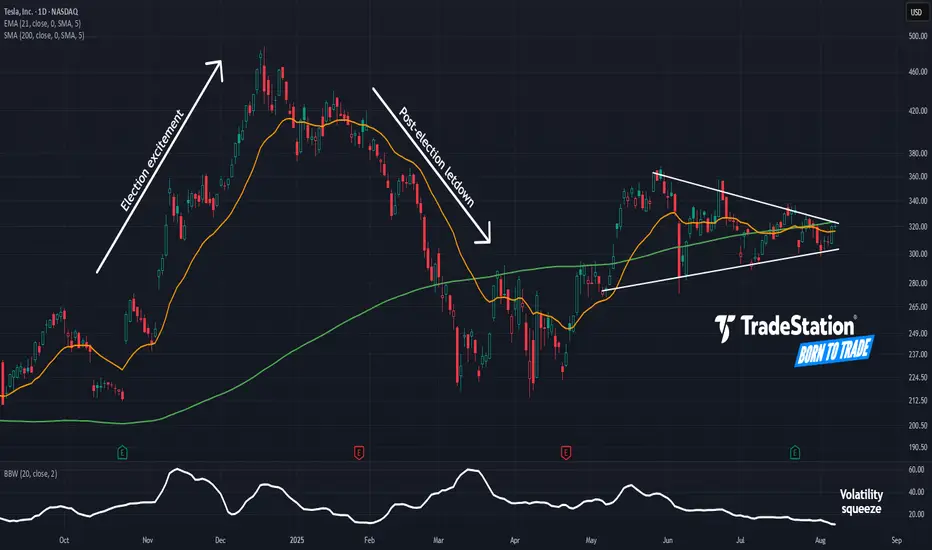
Tight Squeeze in TeslaTesla rallied sharply in late 2024, followed by a drop in the first quarter. Now, after a long period of consolidation, some traders may think the EV maker is getting ready to move again.
The first pattern on today’s chart is the series of higher lows and lower highs since May. That converging triangle may give TSLA breakout potential.
Second, Bollinger Bandwidth has squeezed to a 13-month low. Will that price compression give way to expansion?
Third, the rising 200-day simple moving average may suggest a longer-term uptrend remains in effect.
Next, prices are trying to push above the 21-day exponential moving average. That may be consistent with increasing bullishness in the short term.
Finally, TSLA is a highly active underlier in the options market. (Its average daily volume of 2.3 million contracts ranks behind only Nvidia in the S&P 500, according to TradeStation data.) That may help traders take positions with calls and puts.
TradeStation has, for decades, advanced the trading industry, providing access to stocks, options and futures. If you're born to trade, we could be for you. See our Overview for more.
Past performance, whether actual or indicated by historical tests of strategies, is no guarantee of future performance or success. There is a possibility that you may sustain a loss equal to or greater than your entire investment regardless of which asset class you trade (equities, options or futures); therefore, you should not invest or risk money that you cannot afford to lose. Online trading is not suitable for all investors. View the document titled Characteristics and Risks of Standardized Options at www.TradeStation.com . Before trading any asset class, customers must read the relevant risk disclosure statements on www.TradeStation.com . System access and trade placement and execution may be delayed or fail due to market volatility and volume, quote delays, system and software errors, Internet traffic, outages and other factors.
Securities and futures trading is offered to self-directed customers by TradeStation Securities, Inc., a broker-dealer registered with the Securities and Exchange Commission and a futures commission merchant licensed with the Commodity Futures Trading Commission). TradeStation Securities is a member of the Financial Industry Regulatory Authority, the National Futures Association, and a number of exchanges.
Options trading is not suitable for all investors. Your TradeStation Securities’ account application to trade options will be considered and approved or disapproved based on all relevant factors, including your trading experience. See www.TradeStation.com . Visit www.TradeStation.com for full details on the costs and fees associated with options.
Margin trading involves risks, and it is important that you fully understand those risks before trading on margin. The Margin Disclosure Statement outlines many of those risks, including that you can lose more funds than you deposit in your margin account; your brokerage firm can force the sale of securities in your account; your brokerage firm can sell your securities without contacting you; and you are not entitled to an extension of time on a margin call. Review the Margin Disclosure Statement at www.TradeStation.com .
TradeStation Securities, Inc. and TradeStation Technologies, Inc. are each wholly owned subsidiaries of TradeStation Group, Inc., both operating, and providing products and services, under the TradeStation brand and trademark. When applying for, or purchasing, accounts, subscriptions, products and services, it is important that you know which company you will be dealing with. Visit www.TradeStation.com for further important information explaining what this means.
SPX500 - what's next?Further to my previous idea on SPX.
SPX respected the Resistance at FR 161.8 at 6400.
Price went down and reverted form SMA200 (4H)
Now price has completed the Perfect Gartley Pattern and reached point D.
If (against fundamentals) price reverts down from there and breaks down through SMA50 (4h), I will consider it as Bearish Validation and I will expect correction movement, which cen go down to ca 6000.
Just my humble opinion

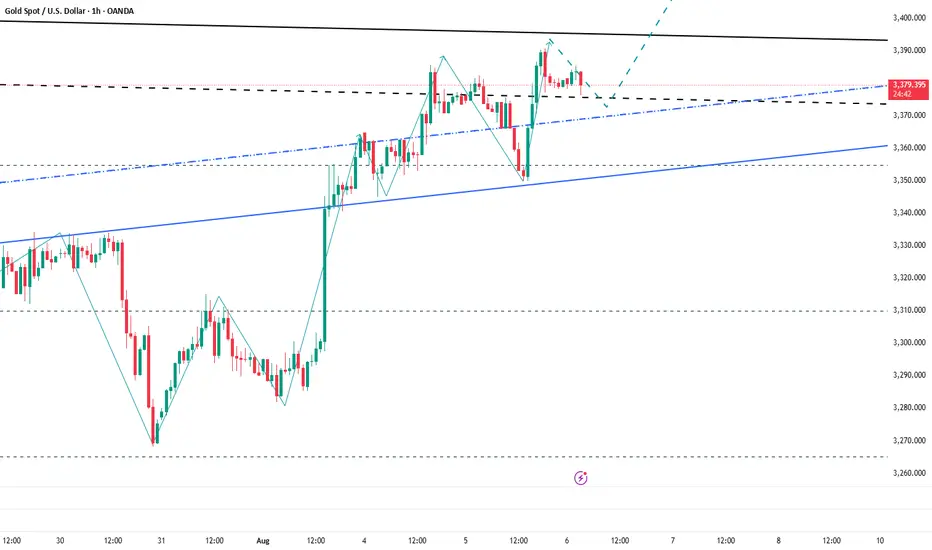
Bullish Momentum Builds: Gold Set to Challenge 3400 and BeyondAlthough gold encountered resistance again near 3385 in the short term, the retracement has not been effectively continued so far, and the downward momentum is not particularly strong. Gold has always remained above the 3375-3365 area, with strong buying support below and the market bearish sentiment is not serious. In comparison, the bulls still have a considerable advantage!
The current gold price structure clearly maintains a strong bullish trend. With gold reclaiming the 3375-3365 area yesterday, bullish sentiment has further strengthened. As gold's center of gravity shifts upward, multiple strong support areas have formed below, limiting any potential pullbacks and further supporting its upward trajectory. Therefore, as long as gold can maintain above the 3375-3365 area, I believe that gold will definitely refresh the short-term high of 3390 again, and is expected to launch a strong impact on the 3400 mark, and may even continue to the 3420-3430 area.
So for short-term trading, I don’t have much desire to short gold for the time being. I am happy to watch for opportunities to enter long positions after gold retreats to the 3375-3365 area!
When to buy the dip of Spotify?
Prices are at strong support, coinciding also with a 50% retracement level
A slight rise in RSI is a bullish sign
The convergence of the 50 and 20 day EMAs could be a source of resistance
Conclusion: let prices break above the 50 and 20 EMAs and wait for a retracement before buying

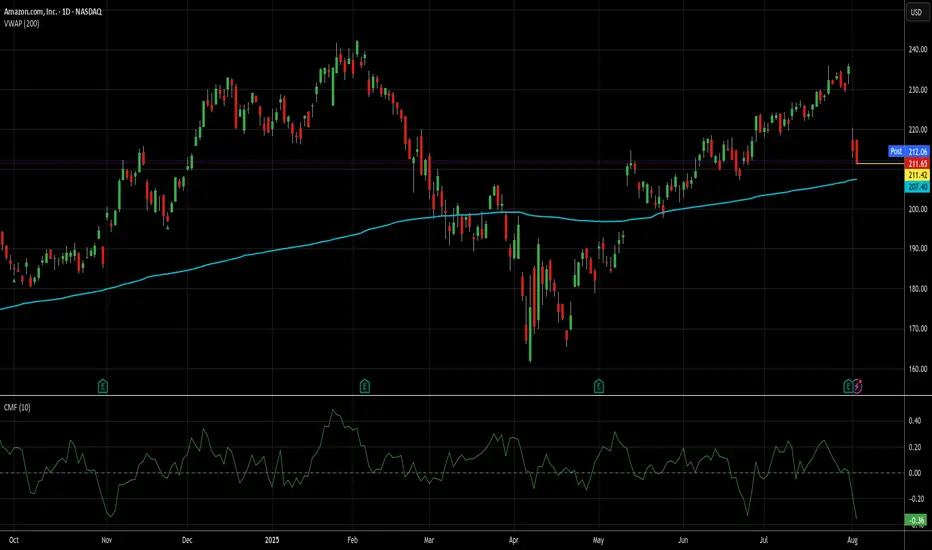
Not a perfect setup, but it's AMZN, so I'm in at 211.65.It may be a touch early to take this trade, but I"d always rather be early than late on AMZN trades. This particular setup isn't exactly like the first 2 ideas I posted about AMZN, but it's been very profitable in general, even if it hasn't done that well on AMZN recently. That said, results of trades tend to mean revert just like stocks usually do (at least mine do).
Since the beginning of 2024, there have been 45 signals for AMZN using the method I'm using today. 43 of those produced wins, while 2 are open and losing (down 12% and 8% respectively). I'm not worried about those 2, because over the long haul, those losers eventually become winners almost 100% of the time, it's just a question of how long it takes.
I just closed a RDDT trade today that's been open since Valentine's Day (see my ideas for details on that) that when tactical DCA and quick closes of them were factored in, made 6x the long term average daily return for stocks while RDDT only went up 3%. AMZN has a longer, better track record of recovery than RDDT, so I'm not even a little worried about my money here.
The average gain and trade length over these last 19 months has been kind of spoiled by those losers and a couple of other lots that took a long time to close and made almost nothing. The average trade here took just under 13 trading days and yielded only about 2.26%. That's not great for me, but a) it's still a daily rate of return (.178%) about 4x the long term average of stocks, and b) 75% of the trades produced an average daily return better than that.
Additionally, AMZN is still above its 200d VWAP and money flow is at its lowest levels since November. While not perfect, low money flow levels in a stock like AMZN does a pretty good job of, if not picking a short/med term bottom, usually getting you closer to it than not.
71% of these trades closed in a week or less, so that is my goal here. If it's longer than that and AMZN throws off another buy signal, I will add accordingly, though additional lots will be exited at the first available profitable close.
As always - this is intended as "edutainment" and my perspective on what I am or would be doing, not a recommendation for you to buy or sell. Act accordingly and invest at your own risk. DYOR and only make investments that make good financial sense for you in your current situation.
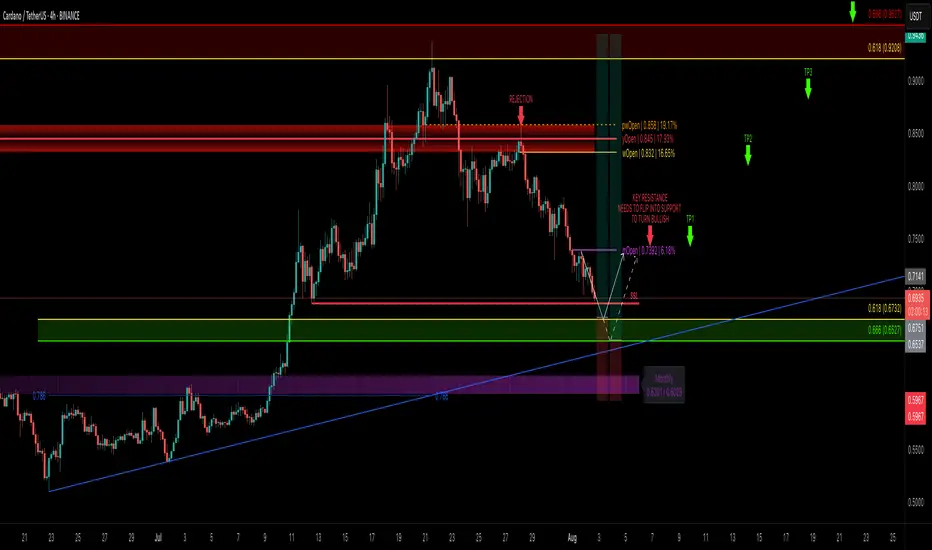
ADA Correction Nearing Completion — Is It Time to Load Up?After tagging the golden pocket resistance zone between $0.9208–$0.9527, ADA completed a clean 5-wave Elliott impulse right into a major resistance. Since then, price has corrected -25%, and we’re now likely nearing the end of an ABC correction — the final wave C.
🧩 Technical Breakdown
➡️ Wave A: 5-wave drop after the peak
➡️ Wave B: Bounce rejected at yearly open (yOpen) — that was a great short opportunity around $0.845
➡️ Wave C: Now working toward completion
🎯 C Wave Target Zone: $0.69–$0.65
This zone has strong confluence:
0.618 Fib retracement of the entire 5-wave move at $0.6732
1.0 TBFE (Trend-Based Fib Extension) aligns perfectly
Sell-side liquidity (SSL)
0.786 Fib Speed Fan support
Monthly 21 EMA/SMA adding a final confluence layer
🟢 Long Setup
Entry Zone: $0.69–$0.65 (ladder in)
Stop Loss: Below the monthly 21 EMA/SMA ($0.6)
Target 1: mOpen key resistance
Target 4: 0.666 Fib at ~$0.95
Risk:Reward: ~1:4+
💡 Educational Insight
After a 5-wave impulsive move, ABC corrections are common. Using the Trend-Based Fib Extension tool to project wave C, especially when paired with liquidity zones, VWAP, or moving averages, helps pinpoint high-probability reversal zones. It’s about confluence and reaction — not prediction.
🔍 Indicators
For this analysis, I’m using my own indicators
DriftLine – Pivot Open Zones and
MFT MA Support/Resistance Zones
both available for free. You can find them on my profile under “Scripts” and apply them directly to your charts for extra confluence when planning your trades.
_________________________________
💬 If you found this helpful, drop a like and comment!
ZETA: when a wedge isn’t just a wedge — it’s a launchpadTechnically, this setup is textbook clean. Price completed the fifth wave within a falling wedge and instantly reacted with a bullish breakout. The expected breakdown didn’t happen — instead, buyers stepped in, confirmed by rising volume. All EMAs are compressed at the bottom of the structure, signaling a clear shift in momentum. The volume profile shows strong accumulation around $14, while the area above current levels is a vacuum — ideal conditions for acceleration.
The key resistance zone is $16.70–17.20 — former base highs and the 0.236 Fibonacci retracement. If price breaks this area with volume, the next stop is likely $24.48 (0.5 Fibo). Classical wedge targets land at $38.28 and $55.33 (1.272 and 1.618 extensions). If a trending leg begins, it could move fast — because there’s simply no supply overhead.
Fundamentals:
ZETA isn’t a profitable company yet, but it shows consistent revenue growth and aggressive expansion. Capitalization is rising, debt is manageable, and institutional interest has increased over recent quarters. In an environment where tech and AI are regaining momentum, ZETA could be a speculative second-tier breakout candidate.
Tactical plan:
— Entry: market or after a retest of $14.00–14.30
— First target: $17.20
— Main target: $24.48
— Continuation: $38.28+
— Stop: below $13.00 (bottom wedge boundary)
When the market prints a wedge like this and the crowd ignores it — that’s often the best trap setup. Only this time, it’s not for retail buyers. It’s for the shorts. Because when a falling wedge breaks to the upside with volume — it’s time to buckle up.

EURUSD - approaching the Resistance ClusterFurther for my previous idea on EURUSD - we are getting to the Resistance cluster, which if respected will constitute the Bearish Validation for trend reversal to downtrend.
The level will most likely be reached on the today's session, then I need to see the price crossing down SMA20 (4H) to confirm the reaction.
Just my humble opinion.

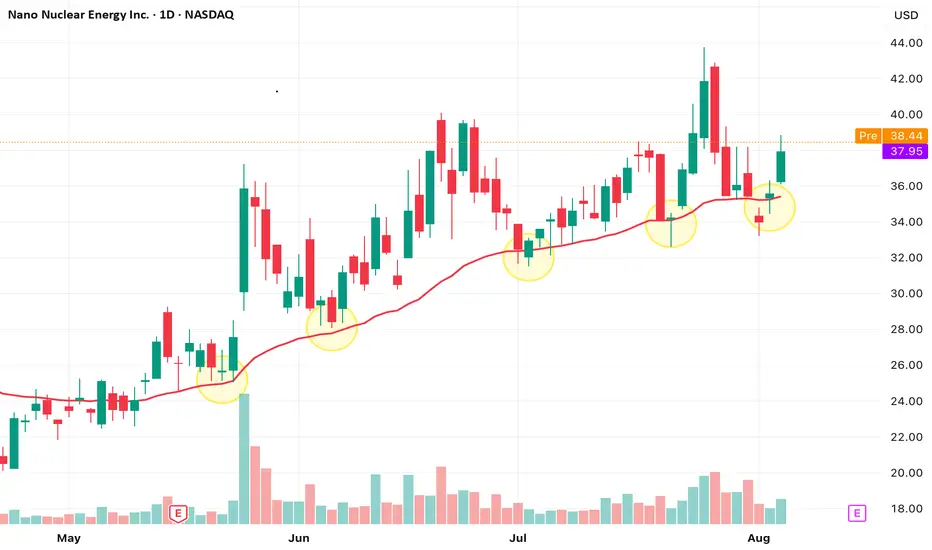
NASDAQ: NNE - Bouncing Off the Strong EMA 30?Nano Nuclear Energy - Price is retesting the EMA 30 after a sharp rally—will it hold as dynamic support and fuel the next leg up?
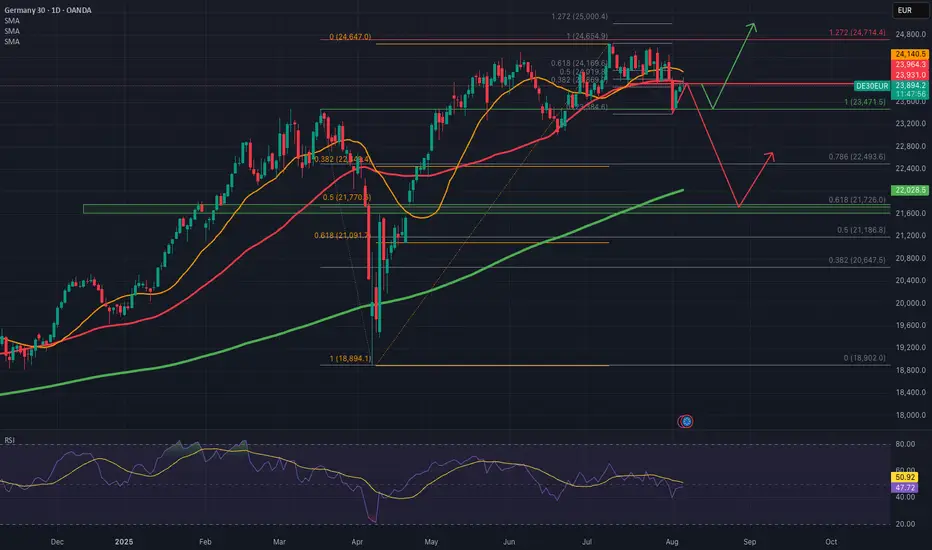
GER40 - the way forward uncertainMain German Index has always had an excellent reputation of ever-gainer.
Now however, German economy has been slowing down for years and the outlook is far from bright. At least in my view.
The price has reached the technical resistance at FR 127.2 and reacted to it. It has been consolidating in between FR 127.2 and FR 100 since June 5th, and on July 31st it broke the SMA 50 with a strong move down. Now the price is testing the SMA 50 from below. If it holds and price breaks down below FR 100, we may see a significant correction on this instrument.
Just my humble opinion.
GOLD RISING AGAIN1. MA20 on weekly held the price again
2. Gold is making Higher Lows in a row
3. 100 days of sideway movement
Now its time for $4000 in my opinion

GBPUSD 4H: retest done - bearish continuation beginsOn the 4H chart, GBPUSD has completed a textbook head and shoulders pattern. The neckline has already been broken, and the price is now finalizing a retest around 1.3365–1.3380, where the 0.5 Fibo level also lies. This confirms a trend reversal, with the market preparing for the next leg down.
MA and EMA are above the current price, adding pressure to the downside. RSI remains neutral, and volume is shifting in favor of bears. The key resistance zone at 1.3365 has been tested from below, and the price is beginning to roll over - a classic bearish continuation signal.
Targets: 1.3240 first, then 1.3150 and potentially 1.2 870 if momentum builds. The invalidation point is a close above 1.3365, which is not likely at this stage.
Fundamentals support the move: the dollar remains strong as the Fed holds its hawkish stance, while the UK economy continues to show weakness across services and manufacturing.
Neckline broken ✅
Retest done ✅
Momentum building ✅
The setup is complete — time to follow the structure.

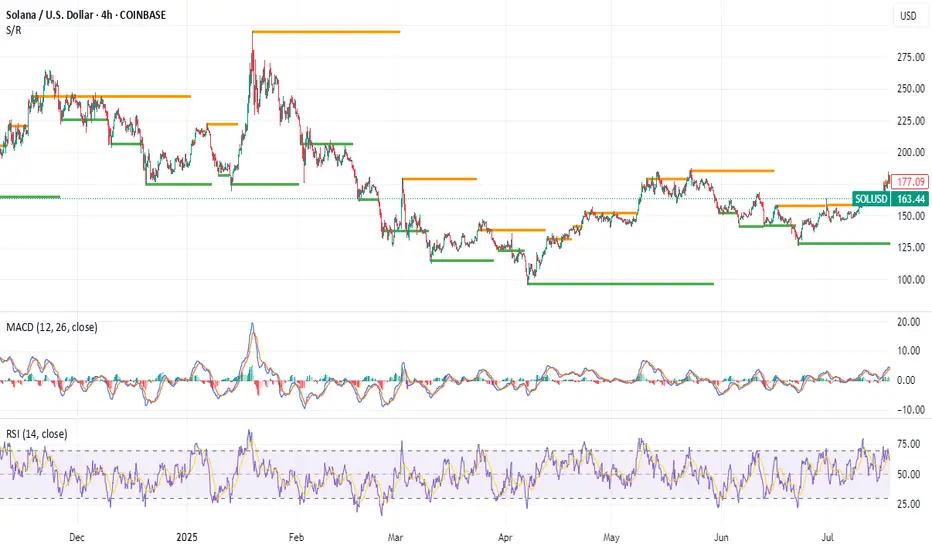
SOL Institutional Capital Fuels Bull Run SpeculationSolana's Ascent: A Perfect Storm of Adoption and Institutional Capital Fuels Bull Run Speculation
A powerful and rare confluence of tangible real-world adoption, significant institutional investment, and bullish technical indicators is generating a palpable buzz around Solana (SOL). The high-performance blockchain, often touted as a leading "Ethereum killer," is experiencing a resurgence that has captured the market's attention. After a period of sideways consolidation, SOL has decisively broken through key psychological and technical price levels, igniting speculation that this may be the start of a sustained and powerful bull run.
The narrative driving this optimism is not based on fleeting hype but on two concrete, fundamental pillars. The first is the global shipment of Solana Mobile's second-generation smartphone, the "Seeker," a device engineered to onboard millions into the Web3 ecosystem by seamlessly integrating crypto into the user's daily life. The second is a powerful vote of confidence from the traditional finance world, where a growing number of publicly traded companies are aggressively accumulating SOL for their corporate treasuries, treating it as a strategic reserve asset. As these foundational tailwinds gather force, technical charts are beginning to align, suggesting that the path of least resistance for Solana's price may soon be sharply upward.
The Seeker Phone: Solana's Trojan Horse for Mass Adoption
Perhaps the most visible and innovative catalyst is the global rollout of the Seeker smartphone. Following up on its first-generation "Saga" device, Solana Mobile has initiated the shipment of tens of thousands of pre-ordered Seeker phones to a global audience. The market's reception has been nothing short of explosive, with pre-orders soaring past 150,000 units—a dramatic increase from the 20,000 total sales of its predecessor. This overwhelming demand underscores a pent-up desire for a mobile-native Web3 experience.
But the Seeker is far more than just a piece of hardware; it represents a strategic masterstroke to solve the persistent problem of user experience in the crypto space. For years, interacting with decentralized applications (dApps) on mobile has been a clunky, insecure, and fragmented process, creating a high barrier to entry for the average consumer. The Seeker directly addresses these pain points. It features a built-in crypto wallet and a hardware-isolated "Seed Vault," which secures a user's private keys in a protected environment within the phone, drastically enhancing security and simplifying transactions.
This mobile-first approach creates a powerful economic flywheel. Priced accessibly, the phone is projected to generate substantial revenue for Solana Mobile. However, its true value lies in its ability to foster a vibrant, self-sustaining ecosystem. Each device includes a "Genesis NFT," a digital key that unlocks exclusive airdrops, rewards, and early access to new applications. This model, which proved incredibly successful with the Saga phone and the famous BONK memecoin airdrop, gamifies participation and incentivizes users to actively explore and engage with the Solana network. It transforms the phone from a passive communication tool into an active portal for decentralized finance (DeFi), NFT marketplaces, and Web3 gaming.
Furthermore, the Seeker boasts its own decentralized dApp store, presenting a direct challenge to the incumbent duopoly of Apple and Google. By offering developers a platform with lower fees and fewer restrictions, Solana is cultivating an environment where innovation can flourish. This attracts builders to the ecosystem, leading to a richer and more diverse array of applications, which in turn attracts more users. The Seeker phone, therefore, is not just a product—it's a Trojan Horse designed to embed the Solana network into the fabric of daily life, driving network utility, transaction volume, and ultimately, sustained demand for the SOL token.
The Institutional Stampede: Big Money Places Its Bet on Solana
While the Seeker phone provides a compelling grassroots adoption narrative, it is the concurrent wave of institutional investment that adds a powerful layer of validation and financial firepower. A growing cohort of publicly traded companies is now strategically adding SOL to their corporate treasuries, signaling deep-seated, long-term confidence in the network's technology and economic potential. This trend moves Solana beyond the realm of speculative trading and into the domain of strategic corporate finance.
Leading this charge is DeFi Development Corp (DFDV), a firm that has made headlines with its aggressive accumulation strategy. The company recently purchased an additional 110,466 SOL, bringing its total holdings to a staggering 1.29 million SOL. This move is part of a publicly stated ambition to hold one SOL per outstanding company share by 2028, a strategy explicitly modeled after MicroStrategy's high-conviction Bitcoin treasury plan. By securing a multi-billion dollar line of credit for these purchases, DeFi Dev Corp is making a clear and unequivocal bet on Solana's future.
This institutional embrace extends beyond a single entity. Upexi Inc., a consumer brand holding company, has significantly increased its SOL holdings and secured a $500 million credit line for further acquisitions. Bit Mining, a prominent player in the digital asset mining space, has not only purchased millions of dollars worth of SOL but has also launched its first Solana validator, contributing directly to the network's security and decentralization. Perhaps most surprisingly, Artelo Biosciences, a Nasdaq-listed pharmaceutical company, has pivoted to include SOL in its treasury, becoming the first public pharma firm to adopt a digital asset as a reserve.
These companies are drawn to Solana for its unique combination of high throughput, low transaction costs, and yield-bearing potential. The network's ability to process thousands of transactions per second at a fraction of a penny makes it a viable platform for enterprise-grade applications. Furthermore, the ability to stake SOL and earn a consistent annual yield of 7-8% presents a compelling alternative to holding depreciating fiat currencies or low-yield government bonds. This makes SOL an attractive treasury asset that can both appreciate in value and generate a recurring revenue stream. This institutional inflow provides robust price support and has an outsized market impact, as it effectively removes large quantities of SOL from the circulating supply, creating a potential supply shock as demand continues to grow.
Coiling for a Breakout: A Technical Perspective
This potent mix of fundamental catalysts is vividly reflected in Solana's price chart, which shows the asset coiling for a potentially explosive move. After establishing a solid foundation of support, SOL has demonstrated significant strength by breaking through the crucial $160 and $162 levels. The price is now trading firmly above its 100-hourly simple moving average, a key indicator that traders use to gauge short-term trend momentum. A price holding above this moving average is generally considered a sign of bullish health.
Currently, a key bullish trend line has formed on the hourly chart, with immediate and strong support located at the $165 mark. This level now acts as the first line of defense for the bulls; as long as the price remains above it, the upward trajectory is considered intact. However, the path higher is not without obstacles. The first major test awaits at the $172 resistance zone. A decisive and high-volume break above this level would signal that buyers are in firm control and could trigger a cascade of further buying.
Should the bulls conquer $172, the next significant hurdle lies near the $180-$182 range. Overcoming this area would open the door to a more sustained rally, with analysts eyeing subsequent targets at $192 and the psychologically important $200 level. While these technical levels present challenges, the underlying momentum indicators are encouraging. The Moving Average Convergence Divergence (MACD) is showing bullish acceleration, and the Relative Strength Index (RSI) is holding strong above the 50 midpoint, indicating that buying pressure is outweighing selling pressure.
Of course, no market moves in a straight line. A failure to break the $172 resistance could lead to a temporary pullback. If the $165 support level were to fail, the next support zones would be found near $160 and $155. A break below these levels could signal a short-term bearish reversal and would invalidate the immediate bullish thesis. However, given the powerful fundamental drivers at play, many analysts believe that any such dips would likely be viewed as buying opportunities.
The Verdict: Is This the Definitive Catalyst?
Solana currently finds itself in an exceptionally strong position. It is one of the few blockchain projects that can boast a clear, tangible strategy for mass adoption through its mobile initiatives. The Seeker phone is a game-changer, providing a seamless on-ramp to Web3 that could onboard a new generation of users.
This powerful fundamental narrative is being amplified and validated by a wave of institutional capital. The strategic accumulation of SOL by public companies lends the asset a new level of legitimacy and provides a powerful source of demand that is unlikely to waver based on short-term market fluctuations.
When these two forces are combined with a bullish technical structure, the result is a perfect storm of positive catalysts. While the broader crypto market will always be subject to macroeconomic factors and regulatory shifts, Solana has carved out a uniquely compelling growth story. The immediate challenge is for the bulls to maintain their momentum and decisively break through the upcoming resistance zones. If they succeed, this confluence of events may very well be remembered as the definitive catalyst that propelled Solana into its next major bull run, solidifying its position not just as a competitor, but as a leader in the new digital economy.