The Hershey Company Stock Quote | Chart & Forecast SummaryKey Indicators On Trade Set Up In General
1. Push Set Up
2. Range Set up
3. Break & Retest Set Up
Notes On Session
# The Hershey Company Stock Quote
- Double Formation
* (A+ Set Up)) At 210.00 USD | Completed Survey
* Wave Feature - *ABC / Entry & Retest | Subdivision 1
- Triple Formation
* (Consolidation Argument))
- 0.5 Retracement Area - *100 EMA | Subdivision 2
* (TP1) | Subdivision 3
* Daily Time Frame | Trend Settings Condition
- (Hypothesis On Entry Bias)) | Regular Settings
- Position On A 1.5RR
* Stop Loss At 165.00 USD
* Entry At 155.00 USD
* Take Profit At 144.00 USD
* (Ranging Argument)) & No Pattern Confirmation
* Ongoing Entry & (Neutral Area))
Active Sessions On Relevant Range & Elemented Probabilities;
European-Session(Upwards) - East Coast-Session(Downwards) - Asian-Session(Ranging)
Conclusion | Trade Plan Execution & Risk Management On Demand;
Overall Consensus | Sell
Moving Averages

BTCUSD 5/19/25 Daily Update - Hold Steady!Here is your daily update on BTCUSD via analyzing Cumulative Delta Volume (CDV), divergence between price and the Money Flow Index (MFI), and the 4h and D McGinley Moving Averages!
Happy trading, and I hope the video was helpful!

Ethereum Golden Cross: ETH Eyes $3,000 BreakoutEthereum Flashes Golden Cross: A Bullish Beacon or a Fleeting Glimmer for the $3,000 Target?
The cryptocurrency market is once again abuzz with technical signals, and this time, Ethereum (ETH), the second-largest cryptocurrency by market capitalization, is in the spotlight. Traders and analysts are keenly observing a "Golden Cross" that has recently manifested on Ethereum's price charts. This classic bullish indicator has historically been associated with potential upward momentum, igniting discussions and hopes among investors: could this be the catalyst that propels ETH bulls to conquer the coveted $3,000 price level?
Understanding the Golden Cross: A Primer
Before diving into Ethereum's specific prospects, it's crucial to understand what a Golden Cross signifies. In technical analysis, a Golden Cross occurs when a shorter-term moving average (MA) of an asset's price crosses above a longer-term moving average. Most commonly, this involves the 50-day moving average (50-MA) moving above the 200-day moving average (200-MA).
The rationale behind its bullish interpretation is straightforward: the 50-MA reflects the average price over the last 50 trading days, representing recent momentum. The 200-MA, on the other hand, represents the longer-term trend. When the shorter-term momentum (50-MA) surpasses the longer-term trend (200-MA) from below, it suggests that the recent buying pressure and positive price action are strong enough to potentially shift the overall market sentiment and initiate a more sustained uptrend.
However, it's vital to approach this signal with a degree of caution. The Golden Cross is a lagging indicator, meaning it confirms a trend that has already been underway for some time, rather than predicting a future one with certainty. By the time a Golden Cross appears, a significant portion of the initial upward move might have already occurred. Furthermore, like all technical indicators, it's not infallible. False signals can happen, where a Golden Cross appears but fails to lead to a sustained rally, sometimes even preceding a market downturn. Therefore, while a Golden Cross is a positive sign, it’s best used in conjunction with other indicators and a broader market analysis.
Ethereum's Current Landscape and the Significance of the Signal
For Ethereum, the appearance of a Golden Cross is a noteworthy development, especially considering its price action in recent months. After periods of consolidation and navigating broader market uncertainties, such a signal can inject a fresh wave of optimism. It often attracts trend-following traders and algorithms programmed to react to such patterns, potentially increasing buying pressure.
The journey towards $3,000 for Ethereum is not just a numerical target; it represents a significant psychological level. Reclaiming this mark would signify a strong recovery and could pave the way for further exploration of higher price territories. The Golden Cross, in this context, acts as a technical validation for bulls who believe in Ethereum's underlying fundamentals and its potential for growth.
Factors Fueling the Bullish Case for ETH to $3,000
Several factors, beyond the Golden Cross itself, could support a bullish push for Ethereum towards the $3,000 milestone:
1. Strong Network Fundamentals: Ethereum continues to be the dominant smart contract platform, hosting the vast majority of decentralized finance (DeFi) applications, non-fungible tokens (NFTs), and a burgeoning ecosystem of Layer 2 scaling solutions. Ongoing development, such as progress on future upgrades aimed at enhancing scalability and efficiency (like proto-danksharding with EIP-4844), bolsters long-term confidence.
2. The Impact of "The Merge" and Staking: The transition to a Proof-of-Stake (PoS) consensus mechanism (The Merge) has fundamentally changed Ethereum's tokenomics. It significantly reduced new ETH issuance and, coupled with the EIP-1559 fee-burning mechanism, has often made ETH deflationary during periods of high network activity. The growth in staked ETH, which secures the network and earns rewards for stakers, also reduces the liquid supply available on exchanges, potentially creating upward price pressure.
3. Layer 2 Scaling Solutions Gaining Traction: Solutions like Arbitrum, Optimism, zkSync, and StarkNet are increasingly handling a significant portion of Ethereum's transaction load. This alleviates congestion on the mainnet, reduces gas fees for users interacting with these Layer 2s, and improves the overall user experience, making the Ethereum ecosystem more attractive and scalable. As these solutions mature and gain wider adoption, they enhance Ethereum's value proposition.
4. Renewed Institutional Interest: While institutional adoption of crypto can be cyclical, a clear bullish signal like a Golden Cross, combined with improving macroeconomic conditions or regulatory clarity, could reignite interest from larger financial players looking for exposure to digital assets beyond Bitcoin. Ethereum's utility and its role as a platform for decentralized applications make it an attractive candidate for institutional portfolios.
5. Positive Market Sentiment: The cryptocurrency market is heavily influenced by sentiment. A Golden Cross can contribute to a positive feedback loop: the signal encourages buying, which pushes prices up, further reinforcing bullish sentiment and attracting more participants. If Bitcoin, the market leader, also shows strength, it often creates a favorable environment for altcoins like Ethereum to rally.
6. Growing NFT and DeFi Ecosystems: Despite market fluctuations, innovation within the NFT and DeFi sectors on Ethereum continues. New use cases, improved user interfaces, and greater mainstream adoption of these technologies can drive demand for ETH, which is used to pay for transactions and interact with these applications.
Potential Headwinds and Obstacles on the Path to $3,000
Despite the optimism generated by the Golden Cross, several challenges could hinder Ethereum's ascent to $3,000:
1. Macroeconomic Uncertainty: Broader economic factors, such as inflation rates, interest rate policies by central banks, and geopolitical events, can significantly impact risk assets, including cryptocurrencies. A deteriorating macroeconomic outlook could dampen investor appetite and stall any potential rally.
2. Regulatory Scrutiny: The regulatory landscape for cryptocurrencies remains a significant unknown in many jurisdictions. Unfavorable regulations or enforcement actions targeting Ethereum, DeFi, or staking could negatively impact its price.
3. Technical Resistance Levels: The path to $3,000 is likely to encounter several technical resistance levels where selling pressure might increase. Traders will be closely watching these zones, and failure to break through them decisively could lead to pullbacks.
4. Profit-Taking: As the price of ETH rises, especially after a significant signal like a Golden Cross, traders who bought at lower levels may decide to take profits, creating selling pressure that needs to be absorbed by new buyers for the uptrend to continue.
5. Competition: While Ethereum is the dominant player, it faces ongoing competition from other Layer 1 blockchains (e.g., Solana, Avalanche, BNB Chain) that also aim to offer scalable smart contract platforms. Significant advancements or adoption shifts towards competitors could impact Ethereum's market share and sentiment.
6. The "False Signal" Risk: As mentioned earlier, no technical indicator is perfect. The Golden Cross could prove to be a false signal if broader market conditions turn bearish or if unforeseen negative catalysts emerge.
Conclusion: A Promising Signal, But Prudence is Key
The appearance of a Golden Cross on Ethereum's charts is undeniably a positive development that warrants attention. It provides a technical basis for bullish optimism and could indeed be a contributing factor if ETH is to make a sustained push towards the $3,000 mark. The combination of this signal with Ethereum's strong network fundamentals, ongoing technological advancements, and the deflationary pressures from its tokenomics paints a compelling picture for potential price appreciation.
However, investors should approach this scenario with a balanced perspective. The Golden Cross is a piece of the puzzle, not the entire picture. Its predictive power is enhanced when considered alongside other market indicators, fundamental analysis, and the overall macroeconomic environment. While bulls may feel emboldened by this signal, the path to $3,000 will likely involve navigating volatility, overcoming resistance levels, and contending with potential external shocks.
Ultimately, whether Ethereum can leverage this Golden Cross to reach $3,000 will depend on a confluence of factors: sustained buying momentum, continued positive developments within the Ethereum ecosystem, a favorable broader market sentiment, and the absence of significant negative catalysts. For now, the Golden Cross serves as a beacon of hope for ETH holders, but diligent research, risk management, and an awareness of the inherent uncertainties in the crypto market remain paramount.

AVAX 5/19/25 - Getting in early? Putting this one on!!!Here is an update on AVAXUSD via analyzing Cumulative Delta Volume (CDV), divergence between price and the Money Flow Index (MFI), and the 4h and D McGinley Moving Averages!
This setup is showing me what I want to see, so I will be putting this trade on!!!
Happy trading, and I hope the video was helpful!

TAO breaks channelSo the TAOUSDT breaks the the channel range and now going for an testing 200M if it holds the we are going for an another leg up soon. I told you in my last post bitcoin dominance going to 64-65% and it touched 64% and I still believe that Dominance will pump higher in coming Days and Weeks so be careful about your ALTs and my target is still be for TAOUSDT is $350-$380 If holds 200MA if not then be ready for more dump. If holds then be ready for an another leg up very soon.
"BE CAREFUL ABOUT YPUR ALTs"
#TAOUSDT #TAO #CryptoAnalysis #TechnicalAnalysis #TradingView

Apple Might Be StuckThe broader market has rebounded sharply in the last month, but Apple might be getting left behind.
The first pattern on today’s chart is the April 15 peak of $212.94. The smartphone giant probed that level in early May and again last week without breaking it. (The more recent high was also slightly lower.) That may suggest resistance is in place.
Second, the Nasdaq-100 and S&P 500 are back to levels from late February and early March. AAPL’s smaller bounce compared with the broader market may reflect weaker relative strength.
Third, the stock is below its 200-day simple day moving average (SMA). That also contrasts with the bigger indexes, which are above their respective 200-day SMAs.
Fourth, the 50-day SMA had a “death cross” below the 200-day SMA in early April and has remained there since.
Next, stochastics are dipping from an overbought condition.
Finally, AAPL is one of the most active underliers in the options market. (Its average volume of 1.1 million contracts ranks third in the S&P 500, according to TradeStation data.) That could help traders take positions with calls and puts.
TradeStation has, for decades, advanced the trading industry, providing access to stocks, options and futures. If you're born to trade, we could be for you. See our Overview for more.
Past performance, whether actual or indicated by historical tests of strategies, is no guarantee of future performance or success. There is a possibility that you may sustain a loss equal to or greater than your entire investment regardless of which asset class you trade (equities, options or futures); therefore, you should not invest or risk money that you cannot afford to lose. Online trading is not suitable for all investors. View the document titled Characteristics and Risks of Standardized Options at www.TradeStation.com . Before trading any asset class, customers must read the relevant risk disclosure statements on www.TradeStation.com . System access and trade placement and execution may be delayed or fail due to market volatility and volume, quote delays, system and software errors, Internet traffic, outages and other factors.
Securities and futures trading is offered to self-directed customers by TradeStation Securities, Inc., a broker-dealer registered with the Securities and Exchange Commission and a futures commission merchant licensed with the Commodity Futures Trading Commission). TradeStation Securities is a member of the Financial Industry Regulatory Authority, the National Futures Association, and a number of exchanges.
Options trading is not suitable for all investors. Your TradeStation Securities’ account application to trade options will be considered and approved or disapproved based on all relevant factors, including your trading experience. See www.TradeStation.com . Visit www.TradeStation.com for full details on the costs and fees associated with options.
Margin trading involves risks, and it is important that you fully understand those risks before trading on margin. The Margin Disclosure Statement outlines many of those risks, including that you can lose more funds than you deposit in your margin account; your brokerage firm can force the sale of securities in your account; your brokerage firm can sell your securities without contacting you; and you are not entitled to an extension of time on a margin call. Review the Margin Disclosure Statement at www.TradeStation.com .
TradeStation Securities, Inc. and TradeStation Technologies, Inc. are each wholly owned subsidiaries of TradeStation Group, Inc., both operating, and providing products and services, under the TradeStation brand and trademark. When applying for, or purchasing, accounts, subscriptions, products and services, it is important that you know which company you will be dealing with. Visit www.TradeStation.com for further important information explaining what this means.

XAUUSD POSSIBLE SELL OPPORTUNITYPrice currently react round the $3244.44 I anticipate a sell off around that price level. i presume the current high to be a lower high that could furthermore, increase the sell probability and therefore, a sell opportunity is envisaged from that area.

GBPUSD TRADES BACK AT PREV. MONTH HIGH!!Market surged higher as we see it trade back to previous month high. a break above the high provides a further buy opportunity. keep a close watch as we have economic reports/news set to be released in later days of the week.
The 200EMA supports buy opportunities.

EURUSD 5/18/25 UpdateHere is a weekend update on EURUSD via analyzing Cumulative Delta Volume (CDV), divergence between price and the Money Flow Index (MFI), and the 4h and D McGinley Moving Averages!
Happy trading, and I hope the video was helpful!

Bitcoin Stalls, But Chart Watchers Eye $300,000 Peak: Here's Whe
Bitcoin, the world's leading cryptocurrency, has experienced a period of consolidation, leaving investors and analysts alike pondering its next move. While the price has stalled below the $105,000 mark, a confluence of factors, including popular predictive models and bullish sentiment from prominent crypto analysts, suggests that a significant surge could be on the horizon. The potential for Bitcoin to reach new all-time highs, possibly soaring to between $275,000 and $300,000 by October of this year, is fueling excitement and speculation within the crypto community.
This article delves into the factors driving the bullish outlook for Bitcoin, examining the predictive models, analyst forecasts, and underlying fundamentals that support the possibility of a substantial price increase. We will explore the potential catalysts that could propel Bitcoin to new heights and analyze the technical indicators that chart watchers are monitoring closely.
Predictive Models Point to a Massive Surge
One of the primary drivers of the bullish sentiment surrounding Bitcoin is the existence of popular predictive models that suggest a massive price surge in the coming months. These models, often based on historical data, supply and demand dynamics, and other relevant factors, attempt to forecast the future price of Bitcoin with varying degrees of accuracy.
One such model, which has gained considerable attention in the crypto community, points to a potential surge to between $275,000 and $300,000 by October of this year. While the specifics of this model are not explicitly detailed in the prompt, it is likely based on factors such as Bitcoin's scarcity, its increasing adoption as a store of value, and the potential for institutional investment to drive demand.
It is important to note that predictive models are not foolproof and should not be taken as definitive guarantees of future price movements. However, they can provide valuable insights into potential scenarios and help investors make informed decisions.
Analyst Forecasts: $159,000 This Cycle
In addition to predictive models, bullish forecasts from prominent crypto analysts are also contributing to the optimistic outlook for Bitcoin. One analyst, in particular, has predicted that Bitcoin's price could reach $159,000 this cycle.
While the specific methodology used by this analyst is not detailed in the prompt, it is likely based on a combination of technical analysis, fundamental analysis, and market sentiment. Technical analysis involves studying price charts and other technical indicators to identify potential trends and patterns. Fundamental analysis involves evaluating the underlying value of Bitcoin based on factors such as its adoption rate, network security, and regulatory environment. Market sentiment involves gauging the overall mood and expectations of investors in the crypto market.
The analyst's forecast of $159,000 this cycle suggests a belief that Bitcoin is currently undervalued and that its price will eventually catch up to its intrinsic value.
Bitcoin IS The Opt Out
The phrase "Bitcoin IS The Opt Out" encapsulates a growing sentiment within the crypto community that Bitcoin represents a viable alternative to traditional financial systems. This sentiment is based on the belief that Bitcoin offers several advantages over traditional currencies and financial institutions:
• Decentralization: Bitcoin is not controlled by any single entity, such as a government or central bank. This decentralization makes it resistant to censorship and manipulation.
• Scarcity: Bitcoin has a limited supply of 21 million coins, which makes it a scarce asset. This scarcity is expected to drive its price higher over time as demand increases.
• Transparency: All Bitcoin transactions are recorded on a public ledger called the blockchain. This transparency makes it difficult to engage in illicit activities using Bitcoin.
• Security: The Bitcoin network is secured by cryptography, making it difficult to hack or tamper with.
The belief that Bitcoin offers a viable "opt out" from traditional financial systems is driving increased adoption and investment in the cryptocurrency.
BTC Price to $116K Next? 'Early Week' All-Time High
The prospect of Bitcoin reaching $116,000 in the near future, potentially even achieving an all-time high early in the week, is further fueling bullish sentiment. This forecast, attributed to a Bitcoin trader, suggests that the cryptocurrency is poised to break out of its current consolidation phase and enter a new period of price discovery.
The trader's forecast is likely based on technical analysis, identifying potential breakout patterns and momentum indicators that suggest an imminent surge in price. The expectation of an "early week" all-time high suggests a belief that the market is primed for a rapid and decisive move to the upside.
Leaving the Tight Range Behind
The statement that "Bitcoin is in line to leave its tight range behind in the coming days" suggests that the period of consolidation is nearing its end. A tight trading range typically indicates a period of indecision in the market, where buyers and sellers are evenly matched. However, such periods often precede significant price movements, as pent-up energy is released in one direction or another.
The expectation that Bitcoin will leave its tight range behind suggests a belief that the balance of power is shifting in favor of buyers, setting the stage for a potential breakout to the upside.
Retaking All-Time Highs and Pushing into Price Discovery
The ultimate goal for Bitcoin bulls is to see the cryptocurrency retake its all-time highs and push into price discovery. Price discovery refers to the process of establishing a new price level for an asset when it breaks out of its previous range.
When Bitcoin reaches a new all-time high, it enters a period of price discovery, where there are no historical resistance levels to impede its upward movement. This can lead to rapid and substantial price increases, as buyers are willing to pay higher and higher prices to acquire the asset.
Potential Catalysts for a Bitcoin Surge
Several potential catalysts could propel Bitcoin to new all-time highs and trigger a period of price discovery:
• Increased Institutional Investment: As more and more institutional investors, such as hedge funds, pension funds, and corporations, allocate capital to Bitcoin, demand for the cryptocurrency is likely to increase, driving its price higher.
• Regulatory Clarity: Greater regulatory clarity surrounding Bitcoin and other cryptocurrencies could remove a major source of uncertainty and encourage more investors to enter the market.
• Mainstream Adoption: As Bitcoin becomes more widely accepted as a form of payment and a store of value, its adoption rate is likely to increase, driving demand and price appreciation.
• Macroeconomic Factors: Macroeconomic factors, such as inflation, currency devaluation, and geopolitical instability, could drive investors to seek refuge in Bitcoin as a safe haven asset.
Technical Indicators to Watch
Chart watchers are closely monitoring several technical indicators to gauge the potential for a Bitcoin surge:
• Breakout Patterns: Identifying potential breakout patterns, such as ascending triangles, cup and handle formations, and flag patterns, can provide clues about when Bitcoin is likely to break out of its current range.
• Volume: Monitoring trading volume can help to confirm the validity of a breakout. A breakout accompanied by high volume is generally considered more reliable than a breakout accompanied by low volume.
• Momentum Indicators: Momentum indicators, such as the Relative Strength Index (RSI) and the Moving Average Convergence Divergence (MACD), can help to gauge the strength of a trend and identify potential overbought or oversold conditions.
• Support and Resistance Levels: Identifying key support and resistance levels can help to anticipate potential price movements and set appropriate entry and exit points.
Conclusion: Awaiting the Next Chapter in Bitcoin's Story
Bitcoin's recent period of consolidation has left investors and analysts eager to see what the future holds. While the price has stalled below $105,000, a confluence of factors, including predictive models, analyst forecasts, and bullish market sentiment, suggests that a significant surge could be on the horizon.
The potential for Bitcoin to reach new all-time highs, possibly soaring to between $275,000 and $300,000 by October of this year, is fueling excitement and speculation within the crypto community. Whether Bitcoin achieves these lofty targets remains to be seen, but the stage is set for what could be another exciting chapter in the cryptocurrency's story. As always, investors should conduct their own research, assess their risk tolerance, and make informed decisions before investing in Bitcoin or any other cryptocurrency. The journey ahead promises to be volatile, but the potential rewards could be substantial for those who are willing to navigate the risks.
Is XRP About to Rebound? Bullish Signals EmergeXRP Flashes Bullish Signal: Technical Indicator Hints at Imminent Rebound – 100x Gains Coming? The Future Is Closer Than You Think—Analyst
The cryptocurrency market is a volatile and often unpredictable space, where fortunes can be made and lost in the blink of an eye. Among the myriad of digital assets vying for attention, XRP, the cryptocurrency associated with Ripple Labs, has consistently been a topic of intense debate and speculation. While it has faced its fair share of challenges, including regulatory scrutiny and market fluctuations, XRP continues to hold the interest of investors and analysts alike.
Recently, XRP has been displaying what some experts are interpreting as bullish signals, suggesting a potential rebound in its price. These signals are primarily derived from technical analysis, a method of evaluating assets by analyzing statistical trends gathered from trading activity, such as price movement and volume. One particular technical indicator is hinting at an imminent upswing, leading some analysts to predict significant gains for XRP in the near future.
This article delves into the technical indicators flashing bullish signals for XRP, examines the factors that could contribute to a potential rebound, and explores the possibility of a 100x gain, a prospect that has captured the imagination of many XRP enthusiasts.
Technical Indicators Pointing Towards a Rebound
Technical analysis plays a crucial role in understanding potential price movements in the cryptocurrency market. Several indicators are currently suggesting a bullish outlook for XRP:
1. Moving Averages: Moving averages are commonly used to smooth out price data over a specific period, helping to identify trends. When a shorter-term moving average crosses above a longer-term moving average, it is often seen as a bullish signal, indicating that the price is likely to rise. XRP has recently exhibited this "golden cross" pattern on certain timeframes, suggesting a potential upward trend.
2. Relative Strength Index (RSI): The RSI is a momentum indicator that measures the magnitude of recent price changes to evaluate overbought or oversold conditions in the price of an asset. An RSI value below 30 typically indicates that an asset is oversold and may be due for a rebound. XRP's RSI has been hovering in oversold territory, suggesting that buying pressure could soon increase.
3. Fibonacci Retracement Levels: Fibonacci retracement levels are horizontal lines that indicate potential support and resistance levels based on the Fibonacci sequence. These levels are often used to predict where the price of an asset might find support during a downtrend or resistance during an uptrend. XRP has been testing key Fibonacci retracement levels, and a successful breakout above these levels could signal a significant price increase.
4. Chart Patterns: Technical analysts also look for specific chart patterns that can provide clues about future price movements. Some patterns, such as the "inverse head and shoulders" or the "double bottom," are considered bullish formations, suggesting that the price is likely to rise. XRP has been forming patterns that resemble these bullish formations, further supporting the possibility of a rebound.
Factors Contributing to a Potential XRP Rebound
While technical indicators can provide valuable insights, it is essential to consider the fundamental factors that could influence XRP's price. Several factors could contribute to a potential rebound:
1. Ripple's Ongoing Legal Battle with the SEC: The most significant factor weighing on XRP's price has been Ripple's legal battle with the U.S. Securities and Exchange Commission (SEC). The SEC alleges that Ripple sold XRP as an unregistered security, a claim that Ripple vehemently denies. A favorable outcome in this case could significantly boost XRP's price, as it would remove a major source of uncertainty and regulatory risk.
2. Growing Adoption of XRP for Cross-Border Payments: Ripple has been actively promoting XRP as a solution for cross-border payments, touting its speed, efficiency, and low cost compared to traditional methods. Increased adoption of XRP by financial institutions and payment providers could drive demand for the cryptocurrency, leading to a price increase.
3. Expansion of Ripple's Ecosystem: Ripple has been expanding its ecosystem by developing new products and services that utilize XRP. These include RippleNet, a network of financial institutions that use Ripple's technology for cross-border payments, and On-Demand Liquidity (ODL), a service that allows businesses to use XRP to source liquidity for cross-border transactions. A thriving ecosystem could attract more users and investors to XRP, further supporting its price.
4. Overall Cryptocurrency Market Sentiment: XRP's price is also influenced by the overall sentiment in the cryptocurrency market. A positive market sentiment, characterized by rising prices and increased investor confidence, could lift XRP along with other cryptocurrencies. Conversely, a negative market sentiment could put downward pressure on XRP's price.
The Possibility of a 100x Gain: A Realistic Scenario?
The prospect of a 100x gain in XRP's price has captured the imagination of many investors. While such a gain is certainly possible, it is essential to approach this scenario with a healthy dose of skepticism and realism.
To achieve a 100x gain, XRP's price would need to increase by a factor of 100 from its current level. This would require a massive influx of capital into XRP, driven by a combination of factors, such as a favorable outcome in the SEC case, widespread adoption of XRP for cross-border payments, and a significant increase in overall cryptocurrency market capitalization.
While these factors are not entirely out of the realm of possibility, they are by no means guaranteed. The cryptocurrency market is inherently unpredictable, and unforeseen events could derail any potential rally in XRP's price.
Analyst Perspective: The Future Is Closer Than You Think
Despite the inherent risks and uncertainties, some analysts remain optimistic about XRP's future. These analysts point to the potential for XRP to disrupt the traditional cross-border payments industry, the growing adoption of Ripple's technology, and the possibility of a favorable outcome in the SEC case as reasons for their bullish outlook.
One analyst, in particular, has stated that "the future is closer than you think" for XRP, suggesting that significant gains could be realized in the near future. This analyst believes that XRP is currently undervalued and that its price could surge once the regulatory uncertainty surrounding Ripple is resolved.
Conclusion: Navigating the XRP Landscape
XRP presents a complex and often contradictory picture. Technical indicators are flashing bullish signals, suggesting a potential rebound in its price. Factors such as Ripple's ongoing legal battle with the SEC, growing adoption of XRP for cross-border payments, and the overall cryptocurrency market sentiment could all play a role in determining XRP's future.
While the possibility of a 100x gain is enticing, it is essential to approach this scenario with caution and realism. The cryptocurrency market is inherently volatile, and unforeseen events could impact XRP's price.
Ultimately, whether XRP achieves its full potential remains to be seen. However, the recent bullish signals and the ongoing developments surrounding Ripple suggest that the future of XRP is closer than many might think. As always, investors should conduct their own research, assess their risk tolerance, and make informed decisions before investing in any cryptocurrency, including XRP.

CL Update 5/18/25Here is an update on Crude Oil via analyzing Cumulative Delta Volume (CDV), divergence between price and the Money Flow Index (MFI), and the 4h and D McGinley Moving Averages!
Happy trading, and I hope the video was helpful!

BTCUSD Weekend Update 5/18/25 - Don't get too excited...!Here is a weekend update on BTCUSD via analyzing Cumulative Delta Volume (CDV), divergence between price and the Money Flow Index (MFI), and the 4h and D McGinley Moving Averages!
Happy trading, and I hope the video was helpful!

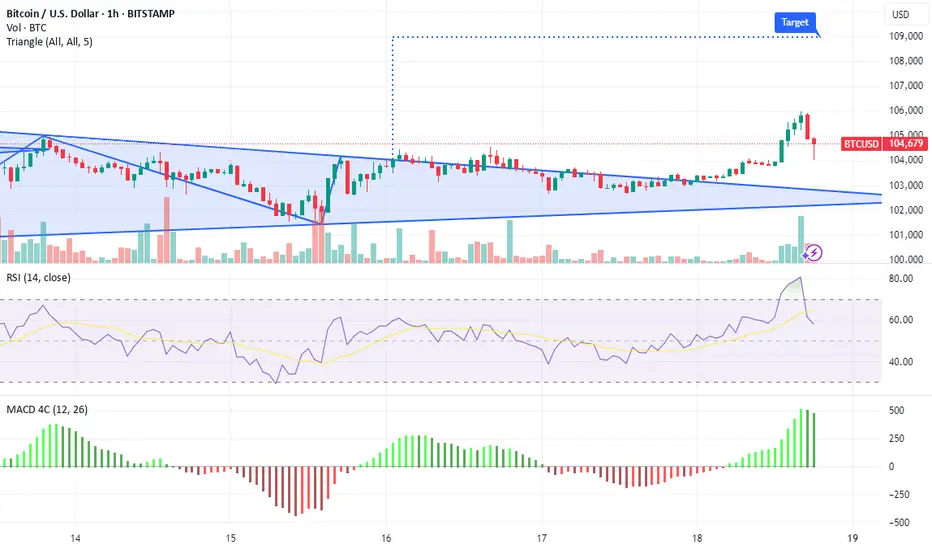
Bitcoin Ready to Explode – Just Like Last TimeCRYPTOCAP:BTC is currently showing a powerful accumulation and breakout pattern, repeating the same bullish structure that led to explosive rallies in the recent past.
The chart highlights three key zones where Bitcoin consolidated before breaking out:
🔹 First breakout from the $81K–$86K zone
🔹 Second breakout above $93K after holding above the 50 EMA
🔹Now, Bitcoin is accumulating again just below a key resistance zone (~$105K–$106K)
This resistance zone has acted as a ceiling before, but the current price action suggests strength. The tight consolidation just below resistance often precedes a breakout — and if it happens here, Bitcoin could explode toward $115K+ in the coming weeks.
Key Technical Points:
🔹50 EMA is acting as dynamic support
🔹Higher low structure remains intact
🔹Each consolidation is followed by a strong upward breakout
Repeating accumulation breakout pattern is visible
Next targets: $111K → $115K → $120K
Invalidation: Breakdown below GETTEX:98K with strong volume
If you found this helpful, don’t forget to like, comment, and repost.
Thank you!
#BTC #BTCUSDT #Unichartz

Solana possible reject off the 21 smaThis is just an observance that I've made. The last time we rejected off this 21 sma, we dropped 93% to the bottom. I am by no means a bear, but I like to read what the charts are telling me. Bitcoin rejected in the same exact way last cycle but blew through it this cycle. Maybe this will change things. Let's just keep on eye on it.

Why Your EMA Isn't What You Think It IsMany new traders adopt the Exponential Moving Average (EMA) believing it's simply a "better Simple Moving Average (SMA)". This common misconception leads to fundamental misunderstandings about how EMA works and when to use it.
EMA and SMA differ at their core. SMA use a window of finite number of data points, giving equal weight to each data point in the calculation period. This makes SMA a Finite Impulse Response (FIR) filter in signal processing terms. Remember that FIR means that "all that we need is the 'period' number of data points" to calculate the filter value. Anything beyond the given period is not relevant to FIR filters – much like how a security camera with 14-day storage automatically overwrites older footage, making last month's activity completely invisible regardless of how important it might have been.
EMA, however, is an Infinite Impulse Response (IIR) filter. It uses ALL historical data, with each past price having a diminishing - but never zero - influence on the calculated value. This creates an EMA response that extends infinitely into the past—not just for the last N periods. IIR filters cannot be precise if we give them only a 'period' number of data to work on - they will be off-target significantly due to lack of context, like trying to understand Game of Thrones by watching only the final season and wondering why everyone's so upset about that dragon lady going full pyromaniac.
If we only consider a number of data points equal to the EMA's period, we are capturing no more than 86.5% of the total weight of the EMA calculation. Relying on he period window alone (the warm-up period) will provide only 1 - (1 / e^2) weights, which is approximately 1−0.1353 = 0.8647 = 86.5%. That's like claiming you've read a book when you've skipped the first few chapters – technically, you got most of it, but you probably miss some crucial early context.
▶️ What is period in EMA used for?
What does a period parameter really mean for EMA? When we select a 15-period EMA, we're not selecting a window of 15 data points as with an SMA. Instead, we are using that number to calculate a decay factor (α) that determines how quickly older data loses influence in EMA result. Every trader knows EMA calculation: α = 1 / (1+period) – or at least every trader claims to know this while secretly checking the formula when they need it.
Thinking in terms of "period" seriously restricts EMA. The α parameter can be - should be! - any value between 0.0 and 1.0, offering infinite tuning possibilities of the indicator. When we limit ourselves to whole-number periods that we use in FIR indicators, we can only access a small subset of possible IIR calculations – it's like having access to the entire RGB color spectrum with 16.7 million possible colors but stubbornly sticking to the 8 basic crayons in a child's first art set because the coloring book only mentioned those by name.
For example:
Period 10 → alpha = 0.1818
Period 11 → alpha = 0.1667
What about wanting an alpha of 0.17, which might yield superior returns in your strategy that uses EMA? No whole-number period can provide this! Direct α parameterization offers more precision, much like how an analog tuner lets you find the perfect radio frequency while digital presets force you to choose only from predetermined stations, potentially missing the clearest signal sitting right between channels.
Sidenote: the choice of α = 1 / (1+period) is just a convention from 1970s, probably started by J. Welles Wilder, who popularized the use of the 14-day EMA. It was designed to create an approximate equivalence between EMA and SMA over the same number of periods, even thought SMA needs a period window (as it is FIR filter) and EMA doesn't. In reality, the decay factor α in EMA should be allowed any valye between 0.0 and 1.0, not just some discrete values derived from an integer-based period! Algorithmic systems should find the best α decay for EMA directly, allowing the system to fine-tune at will and not through conversion of integer period to float α decay – though this might put a few traditionalist traders into early retirement. Well, to prevent that, most traditionalist implementations of EMA only use period and no alpha at all. Heaven forbid we disturb people who print their charts on paper, draw trendlines with rulers, and insist the market "feels different" since computers do algotrading!
▶️ Calculating EMAs Efficiently
The standard textbook formula for EMA is:
EMA = CurrentPrice × alpha + PreviousEMA × (1 - alpha)
But did you know that a more efficient version exists, once you apply a tiny bit of high school algebra:
EMA = alpha × (CurrentPrice - PreviousEMA) + PreviousEMA
The first one requires three operations: 2 multiplications + 1 addition. The second one also requires three ops: 1 multiplication + 1 addition + 1 subtraction.
That's pathetic, you say? Not worth implementing? In most computational models, multiplications cost much more than additions/subtractions – much like how ordering dessert costs more than asking for a water refill at restaurants.
Relative CPU cost of float operations :
Addition/Subtraction: ~1 cycle
Multiplication: ~5 cycles (depending on precision and architecture)
Now you see the difference? 2 * 5 + 1 = 11 against 5 + 1 + 1 = 7. That is ≈ 36.36% efficiency gain just by swapping formulas around! And making your high school math teacher proud enough to finally put your test on the refrigerator.
▶️ The Warmup Problem: how to start the EMA sequence right
How do we calculate the first EMA value when there's no previous EMA available? Let's see some possible options used throughout the history:
Start with zero : EMA(0) = 0. This creates stupidly large distortion until enough bars pass for the horrible effect to diminish – like starting a trading account with zero balance but backdating a year of missed trades, then watching your balance struggle to climb out of a phantom debt for months.
Start with first price : EMA(0) = first price. This is better than starting with zero, but still causes initial distortion that will be extra-bad if the first price is an outlier – like forming your entire opinion of a stock based solely on its IPO day price, then wondering why your model is tanking for weeks afterward.
Use SMA for warmup : This is the tradition from the pencil-and-paper era of technical analysis – when calculators were luxury items and "algorithmic trading" meant your broker had neat handwriting. We first calculate an SMA over the initial period, then kickstart the EMA with this average value. It's widely used due to tradition, not merit, creating a mathematical Frankenstein that uses an FIR filter (SMA) during the initial period before abruptly switching to an IIR filter (EMA). This methodology is so aesthetically offensive (abrupt kink on the transition from SMA to EMA) that charting platforms hide these early values entirely, pretending EMA simply doesn't exist until the warmup period passes – the technical analysis equivalent of sweeping dust under the rug.
Use WMA for warmup : This one was never popular because it is harder to calculate with a pencil - compared to using simple SMA for warmup. Weighted Moving Average provides a much better approximation of a starting value as its linear descending profile is much closer to the EMA's decay profile.
These methods all share one problem: they produce inaccurate initial values that traders often hide or discard, much like how hedge funds conveniently report awesome performance "since strategy inception" only after their disastrous first quarter has been surgically removed from the track record.
▶️ A Better Way to start EMA: Decaying compensation
Think of it this way: An ideal EMA uses an infinite history of prices, but we only have data starting from a specific point. This creates a problem - our EMA starts with an incorrect assumption that all previous prices were all zero, all close, or all average – like trying to write someone's biography but only having information about their life since last Tuesday.
But there is a better way. It requires more than high school math comprehension and is more computationally intensive, but is mathematically correct and numerically stable. This approach involves compensating calculated EMA values for the "phantom data" that would have existed before our first price point.
Here's how phantom data compensation works:
We start our normal EMA calculation:
EMA_today = EMA_yesterday + α × (Price_today - EMA_yesterday)
But we add a correction factor that adjusts for the missing history:
Correction = 1 at the start
Correction = Correction × (1-α) after each calculation
We then apply this correction:
True_EMA = Raw_EMA / (1-Correction)
This correction factor starts at 1 (full compensation effect) and gets exponentially smaller with each new price bar. After enough data points, the correction becomes so small (i.e., below 0.0000000001) that we can stop applying it as it is no longer relevant.
Let's see how this works in practice:
For the first price bar:
Raw_EMA = 0
Correction = 1
True_EMA = Price (since 0 ÷ (1-1) is undefined, we use the first price)
For the second price bar:
Raw_EMA = α × (Price_2 - 0) + 0 = α × Price_2
Correction = 1 × (1-α) = (1-α)
True_EMA = α × Price_2 ÷ (1-(1-α)) = Price_2
For the third price bar:
Raw_EMA updates using the standard formula
Correction = (1-α) × (1-α) = (1-α)²
True_EMA = Raw_EMA ÷ (1-(1-α)²)
With each new price, the correction factor shrinks exponentially. After about -log₁₀(1e-10)/log₁₀(1-α) bars, the correction becomes negligible, and our EMA calculation matches what we would get if we had infinite historical data.
This approach provides accurate EMA values from the very first calculation. There's no need to use SMA for warmup or discard early values before output converges - EMA is mathematically correct from first value, ready to party without the awkward warmup phase.
Here is Pine Script 6 implementation of EMA that can take alpha parameter directly (or period if desired), returns valid values from the start, is resilient to dirty input values, uses decaying compensator instead of SMA, and uses the least amount of computational cycles possible.
// Enhanced EMA function with proper initialization and efficient calculation
ema(series float source, simple int period=0, simple float alpha=0)=>
// Input validation - one of alpha or period must be provided
if alpha<=0 and period<=0
runtime.error("Alpha or period must be provided")
// Calculate alpha from period if alpha not directly specified
float a = alpha > 0 ? alpha : 2.0 / math.max(period, 1)
// Initialize variables for EMA calculation
var float ema = na // Stores raw EMA value
var float result = na // Stores final corrected EMA
var float e = 1.0 // Decay compensation factor
var bool warmup = true // Flag for warmup phase
if not na(source)
if na(ema)
// First value case - initialize EMA to zero
// (we'll correct this immediately with the compensation)
ema := 0
result := source
else
// Standard EMA calculation (optimized formula)
ema := a * (source - ema) + ema
if warmup
// During warmup phase, apply decay compensation
e *= (1-a) // Update decay factor
float c = 1.0 / (1.0 - e) // Calculate correction multiplier
result := c * ema // Apply correction
// Stop warmup phase when correction becomes negligible
if e <= 1e-10
warmup := false
else
// After warmup, EMA operates without correction
result := ema
result // Return the properly compensated EMA value
▶️ CONCLUSION
EMA isn't just a "better SMA"—it is a fundamentally different tool, like how a submarine differs from a sailboat – both float, but the similarities end there. EMA responds to inputs differently, weighs historical data differently, and requires different initialization techniques.
By understanding these differences, traders can make more informed decisions about when and how to use EMA in trading strategies. And as EMA is embedded in so many other complex and compound indicators and strategies, if system uses tainted and inferior EMA calculatiomn, it is doing a disservice to all derivative indicators too – like building a skyscraper on a foundation of Jell-O.
The next time you add an EMA to your chart, remember: you're not just looking at a "faster moving average." You're using an INFINITE IMPULSE RESPONSE filter that carries the echo of all previous price actions, properly weighted to help make better trading decisions.
EMA done right might significantly improve the quality of all signals, strategies, and trades that rely on EMA somewhere deep in its algorithmic bowels – proving once again that math skills are indeed useful after high school, no matter what your guidance counselor told you.

$LINK Long Overdue Move on the Horizon
BIST:LINK has shockingly been a very poor performer as well considering their revolutionary tech connecting web2 -> web3
Dump >67% and rebounded 50% since then.
PA has been trapped between the 200 and 50DA, which suggest voilent breakout coming up.
RSI Is still healthy.

$JUP is Struggling but shows signs for HOPEwtf happened to LSE:JUP
It was once heralded at the leading DEX in web3 on the premier blockchain, but dumped ~75% from ATH with only a 57% rally.
Couldn't even make a run at the 200DMA, but retesting the 50 soon.
needs to have a big dally soon above the .236 fib to test the 200DMA. A breakthrough is a strong reversal confirmation.
market cap is about 60% cheaper than BME:UNI so im liking the value here.

$SOL and Most Major Alts Get Hard Rejection from 200DMAMost of your favorite Alts such as CRYPTOCAP:SOL had hard rejections from the 200DMA.
If this trend breaks into the red box we should see a retest around the .236 Fib and 50DMA ~$140
RSI also looks McDonald's toppy
Not a good time to FOMO.
PS. Normally i dont post TA this late in the night from the US but I'm gonna consider doing more if i get some decent engagement.
Lmk if you think i should post more at these midnight hours 🎃

ETHUSD 5/16/25 UpdateHere is your update on ETHUSD via analyzing Cumulative Delta Volume (CDV), divergence between price and the Money Flow Index (MFI), and the 4h and D McGinley Moving Averages!
Happy trading, and I hope the video was helpful!

XAUUSD Update 5/16/25Here is an update on XAUUSD via analyzing Cumulative Delta Volume (CDV), divergence between price and the Money Flow Index (MFI), and the 4h and D McGinley Moving Averages!
Happy trading, and I hope the video was helpful!

CPNG (South Korean Amazon)Sitting above IPO anchored VWAP and Daily/Weekly key moving averages (50,200) and is currently in an uptrend if we can get a weekly close above the previous resistance zone at 27.12 it is looking pretty bullish. If we break the $27.12 the next target would be 30.80 where previous weekly rejections. If close above the next target is 1.618 fib of $38.31

SPY Daily Update 5/16/25Here is your daily update on SPY via analyzing Cumulative Delta Volume (CDV), divergence between price and the Money Flow Index (MFI), and the 4h and D McGinley Moving Averages!
Happy trading, and I hope the video was helpful!
